In today’s rapidly evolving manufacturing landscape, 3D printing (additive manufacturing) has changed how companies design, prototype, and produce components. Businesses now manufacture complex parts faster, reduce material waste, and improve customization capabilities. However, despite technological advancement, many organizations still struggle to measure performance effectively.
Without structured performance monitoring, production inefficiencies remain unnoticed. As a result, companies face higher operational costs, inconsistent quality, and delayed decision-making. Therefore, manufacturers increasingly rely on data-driven KPI dashboards to manage performance intelligently.
The 3D Printing Manufacturing KPI Dashboard in Power BI provides a powerful and interactive solution that transforms raw production data into actionable insights.
In this comprehensive guide, you will learn everything about the 3D Printing Manufacturing KPI Dashboard in Power BI, including features, structure, implementation steps, advantages, best practices, and frequently asked questions.
Click to Purchases 3D Printing Manufacturing KPI Dashboard in Power BI
What Is a 3D Printing Manufacturing KPI Dashboard in Power BI?
A 3D Printing Manufacturing KPI Dashboard in Power BI is an interactive business intelligence solution designed to monitor manufacturing performance using measurable Key Performance Indicators (KPIs).
Instead of reviewing multiple spreadsheets manually, users analyze all KPIs through dynamic visual reports. Consequently, managers quickly understand operational performance and take corrective actions.
Moreover, Power BI enables real-time filtering, drill-through analysis, and advanced visualization. Therefore, organizations gain deeper insights compared to traditional reporting methods.
Why Is KPI Monitoring Important in 3D Printing Manufacturing?
3D printing operations involve multiple production stages such as design preparation, printing, material handling, post-processing, and quality inspection. Because each stage affects performance, companies must monitor operational metrics continuously.
Key Challenges Without KPI Tracking
-
Lack of production visibility
-
Inefficient machine utilization
-
High material waste
-
Quality inconsistencies
-
Difficulty comparing historical performance
-
Delayed strategic decisions
However, KPI dashboards eliminate these problems by presenting clear performance insights.
Click to Purchases 3D Printing Manufacturing KPI Dashboard in Power BI
How Does Power BI Improve Manufacturing Analytics?
Power BI converts raw Excel data into interactive dashboards.
Because visuals update dynamically, users can:
-
Analyze trends instantly
-
Compare performance across periods
-
Detect operational issues early
-
Monitor targets continuously
-
Improve production planning
Therefore, Power BI becomes an essential analytics platform for modern manufacturing environments.
Click to Purchases 3D Printing Manufacturing KPI Dashboard in Power BI
Key Features of the 3D Printing Manufacturing KPI Dashboard in Power BI
This ready-to-use dashboard contains three powerful pages, each designed for a specific analytical purpose.
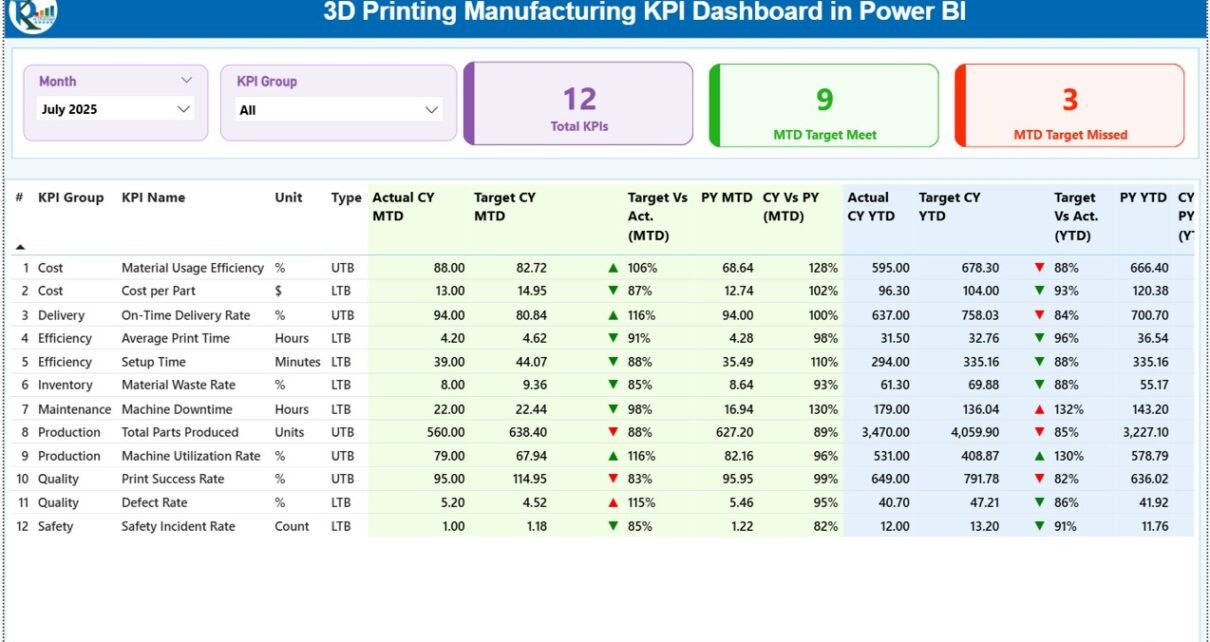
1️⃣ Summary Page – Central Performance Overview
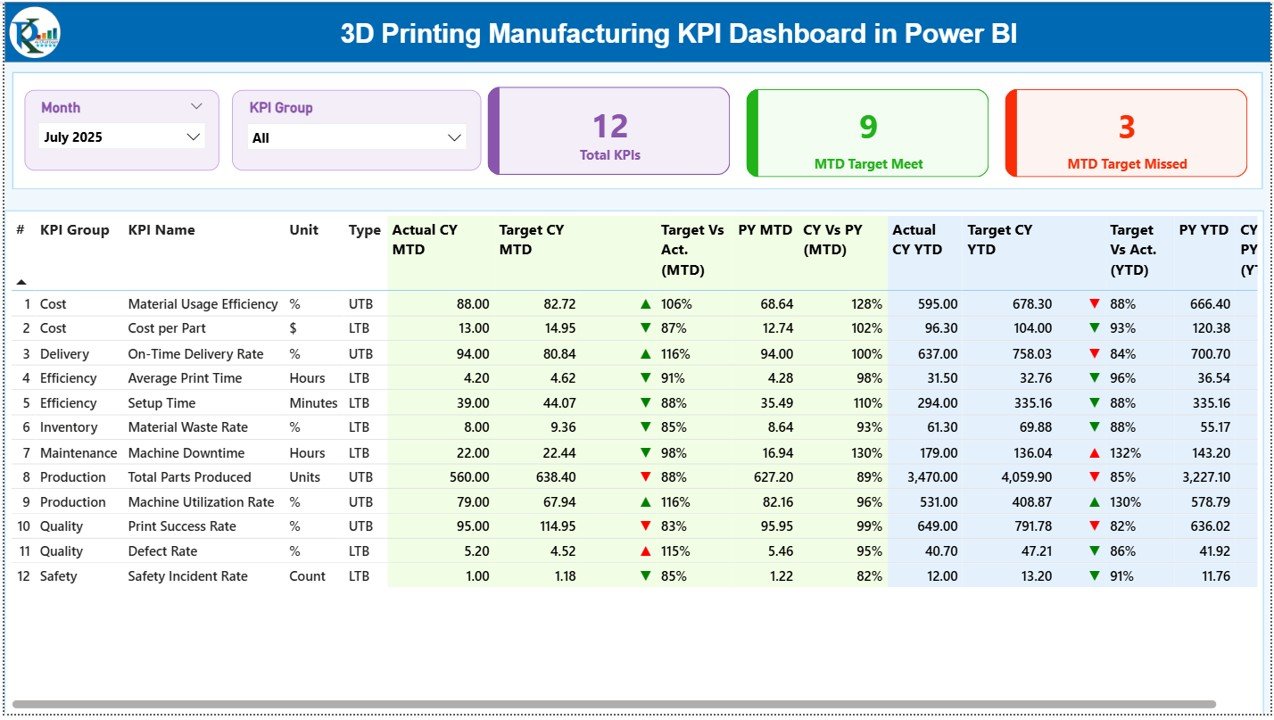
The Summary Page serves as the main dashboard interface where users monitor overall KPI performance.
Interactive Filters
At the top of the dashboard, users find:
-
Month slicer
-
KPI Group slicer
These filters allow instant performance analysis by period or category.
KPI Performance Cards
The dashboard displays three key performance cards:
-
Total KPIs Count
-
MTD Target Meet Count
-
MTD Target Missed Count
As a result, managers quickly evaluate operational success levels.
Detailed KPI Performance Table
Below the cards, a comprehensive KPI table provides detailed analytics.
KPI Information Displayed
-
KPI Number – Sequential KPI identification
-
KPI Group – KPI category
-
KPI Name – Performance metric name
-
Unit – Measurement unit
-
Type – LTB (Lower the Better) or UTB (Upper the Better)
Month-To-Date (MTD) Performance Metrics
The dashboard shows several MTD performance indicators:
-
Actual CY MTD (Current Year Actual)
-
Target CY MTD (Target Value)
-
MTD Status Icons (▲ Green / ▼ Red)
-
Target vs Actual %
The system calculates performance using:
Actual ÷ Target
Therefore, users instantly understand whether performance meets expectations.
Previous Year Comparison (MTD)
The dashboard also includes historical benchmarking:
-
PY MTD (Previous Year Value)
-
CY vs PY (MTD %) comparison
Formula used:
Current Year MTD ÷ Previous Year MTD
This comparison helps organizations measure improvement over time.
Year-To-Date (YTD) Performance Metrics
In addition, the dashboard analyzes long-term performance:
-
Actual CY YTD
-
Target CY YTD
-
YTD Status Icons
-
Target vs Actual (YTD %)
Managers therefore monitor annual progress continuously.
Year-over-Year Comparison (YTD)
Historical evaluation includes:
-
PY YTD values
-
CY vs PY (YTD %) comparison
This analysis highlights long-term operational trends clearly.
Click to Purchases 3D Printing Manufacturing KPI Dashboard in Power BI
2️⃣ KPI Trend Page – Performance Trend Analysis
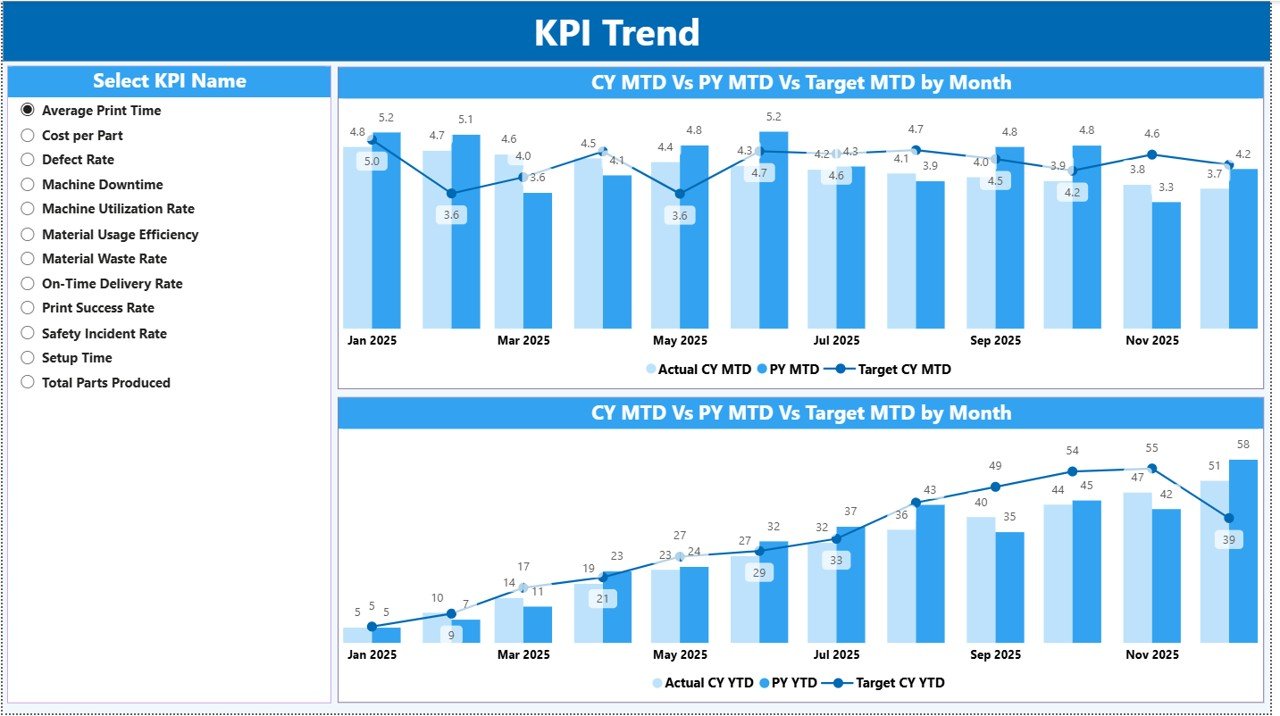
The KPI Trend Page focuses on deeper performance analysis.
Users select a KPI using the slicer available on the left side. Immediately, charts update dynamically.
Charts Available
Two combo charts display:
-
Current Year Actual values
-
Previous Year values
-
Target values
for both:
-
MTD trends
-
YTD trends
Because trends appear visually, managers easily identify performance patterns.
Click to Purchases 3D Printing Manufacturing KPI Dashboard in Power BI
3️⃣ KPI Definition Page – Drill-Through Analytics
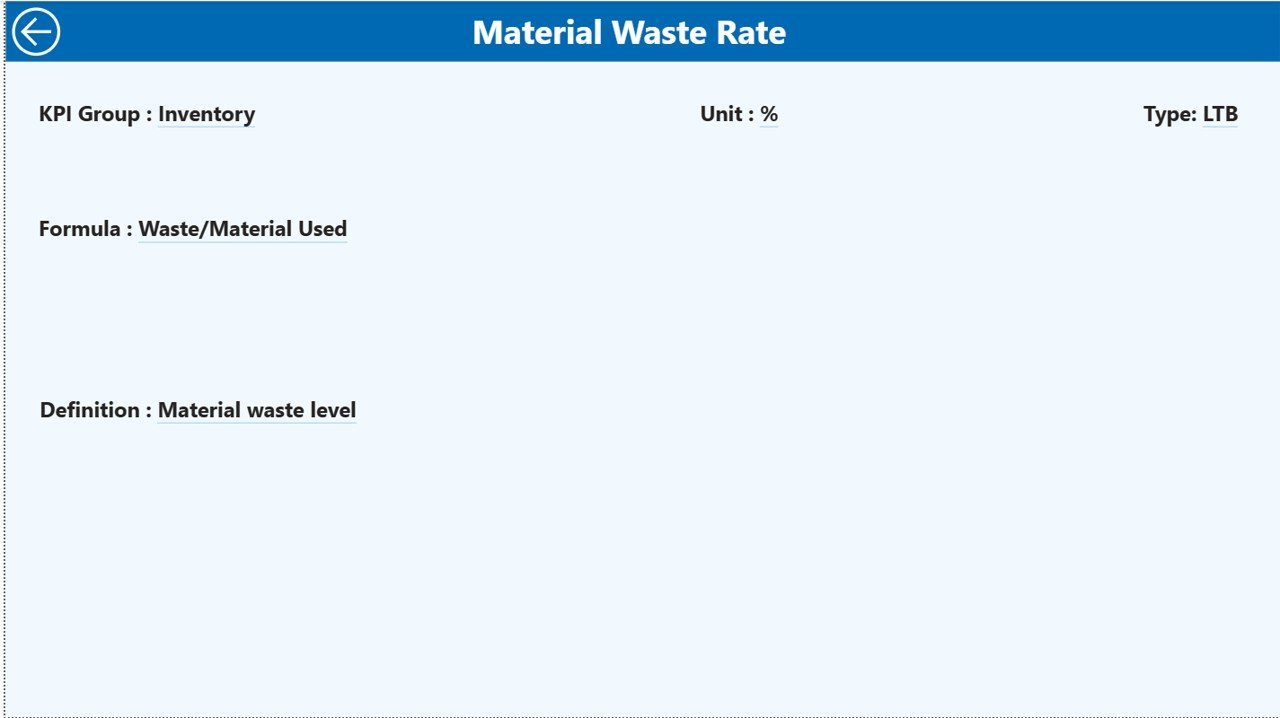
The KPI Definition Page acts as a hidden drill-through page.
From the Summary Page, users can drill into KPI details and view:
-
KPI Formula
-
KPI Definition
-
KPI Type
-
Measurement logic
This feature ensures transparency and clarity in performance measurement.
To return, users simply click the Back Button located at the top-left corner.
Excel Data Source Structure
The dashboard connects directly to an Excel file as its data source.
Users only need to update three worksheets.
1. Input_Actual Sheet
Here users enter:
-
KPI Name
-
Month (first date of month)
-
MTD Actual values
-
YTD Actual values
Once data updates, Power BI refreshes automatically.
2. Input_Target Sheet
This sheet stores performance targets:
-
KPI Name
-
Month
-
MTD Target
-
YTD Target
Targets enable automated performance comparison.
3. KPI Definition Sheet
This sheet documents KPI information:
-
KPI Number
-
KPI Group
-
KPI Name
-
Unit
-
Formula
-
Definition
-
KPI Type (LTB or UTB)
Centralized definitions ensure consistent reporting.
Click to Purchases 3D Printing Manufacturing KPI Dashboard in Power BI
Which KPIs Can Be Used in 3D Printing Manufacturing?
Organizations can customize KPIs depending on operational needs.
Common KPIs Include:
-
Print Success Rate
-
Machine Utilization Rate
-
Production Cycle Time
-
Material Waste Percentage
-
Energy Consumption per Print
-
Build Completion Rate
-
Quality Defect Rate
-
Post-Processing Efficiency
-
On-Time Delivery Rate
-
Cost per Printed Part
Tracking these KPIs improves operational control significantly.
Click to Purchases 3D Printing Manufacturing KPI Dashboard in Power BI
Advantages of 3D Printing Manufacturing KPI Dashboard in Power BI
✅ Real-Time Performance Visibility
Managers instantly view production performance through dynamic visuals.
✅ Data-Driven Decisions
Interactive analytics support faster and smarter decisions.
✅ Historical Comparison
Year-over-year insights reveal improvement opportunities.
✅ Interactive Filtering
Users analyze data by month or KPI group easily.
✅ Centralized Analytics
All KPIs remain available in one dashboard.
✅ Scalable Solution
Dashboard grows with business expansion.
How to Implement the Dashboard Successfully?
Follow these steps for smooth implementation:
-
Define manufacturing KPIs
-
Prepare Excel data structure
-
Enter KPI definitions
-
Input actual and target values
-
Refresh Power BI data model
-
Review dashboard insights monthly
Consistency ensures maximum benefits.
Click to Purchases 3D Printing Manufacturing KPI Dashboard in Power BI
Best Practices for the 3D Printing Manufacturing KPI Dashboard
✔ Maintain Clean Data
Accurate input ensures reliable analysis.
✔ Update Data Regularly
Schedule monthly updates for consistency.
✔ Focus on Actionable KPIs
Track metrics that influence decisions.
✔ Use Trend Analysis
Analyze performance over time rather than isolated values.
✔ Train Stakeholders
Ensure teams understand KPI meaning and impact.
✔ Review Targets Periodically
Adjust goals according to operational growth.
How Does This Dashboard Support Continuous Improvement?
Continuous improvement requires measurable insights.
Because this dashboard highlights performance gaps, organizations can:
-
Identify inefficiencies
-
Implement corrective actions
-
Measure improvement results
-
Optimize production workflows
Consequently, productivity increases while operational risks decrease.
Who Should Use This Dashboard?
This solution benefits multiple roles:
-
Manufacturing Managers
-
Operations Leaders
-
Production Supervisors
-
Quality Engineers
-
Data Analysts
-
Business Owners
Therefore, it fits both small and large manufacturing organizations.
Click to Purchases 3D Printing Manufacturing KPI Dashboard in Power BI
Why Use Power BI for Manufacturing KPI Reporting?
Power BI offers advantages beyond traditional spreadsheets.
Key Benefits
-
Interactive visualization
-
Drill-through analytics
-
Dynamic filtering
-
Automated calculations
-
Professional reporting experience
As a result, organizations gain enterprise-level analytics at low cost.
Common Mistakes to Avoid When Using KPI Dashboards
Avoid these errors to maximize value:
-
Tracking too many KPIs
-
Ignoring trend analysis
-
Using inconsistent definitions
-
Delayed data updates
-
Lack of performance reviews
Proper usage ensures long-term success.
Future of KPI Analytics in Additive Manufacturing
As Industry 4.0 evolves, KPI dashboards will integrate with:
-
IoT-enabled printers
-
Real-time production sensors
-
Predictive analytics models
-
AI-driven optimization systems
However, structured KPI tracking will always remain the foundation of smart manufacturing.
Conclusion
The 3D Printing Manufacturing KPI Dashboard in Power BI provides a modern and efficient way to monitor additive manufacturing performance. Instead of relying on manual reports, organizations gain interactive insights that improve operational visibility and decision-making.
Because the dashboard combines Excel data with Power BI visualization, companies achieve both flexibility and advanced analytics. Consequently, teams improve efficiency, reduce waste, and drive continuous improvement.
Organizations that adopt KPI dashboards today position themselves for smarter manufacturing tomorrow.
Click to Purchases 3D Printing Manufacturing KPI Dashboard in Power BI
Frequently Asked Questions (FAQs)
What is a 3D Printing KPI Dashboard?
It is a Power BI dashboard that tracks manufacturing performance using structured KPIs and interactive visuals.
Does the dashboard require Power BI expertise?
No. Users mainly update Excel data, and Power BI automatically refreshes visuals.
Can I customize KPIs?
Yes. You can modify KPIs through the KPI Definition Excel sheet.
How often should data be updated?
Most organizations update data monthly, although weekly updates also work.
Can this dashboard compare past performance?
Yes. It includes Previous Year comparisons for both MTD and YTD analysis.
Is this dashboard suitable for small manufacturers?
Yes. Small and medium businesses benefit greatly because implementation remains simple.
What makes Power BI better than static reports?
Power BI provides interactive visuals, filters, and drill-through analytics that improve decision-making speed.
Click to Purchases 3D Printing Manufacturing KPI Dashboard in Power BI
Visit our YouTube channel to learn step-by-step video tutorials