In today’s digital entertainment industry, music festivals, theater productions, concerts, and performing arts events generate massive amounts of data every day. Event organizers must track ticket sales, venue performance, expenses, profitability, and audience engagement continuously. However, many organizations still rely on scattered spreadsheets and manual reports. As a result, decision-making becomes slow and inefficient.
Therefore, organizations increasingly adopt data-driven dashboards to manage performance effectively. One powerful solution is the Music and Performing Arts Dashboard in Power BI — a modern analytics system that transforms raw event data into meaningful visual insights.
In this comprehensive guide, you will learn everything about the Music and Performing Arts Dashboard in Power BI, including its structure, features, benefits, implementation methods, best practices, and frequently asked questions.
Click to buy Music and Performing Arts Dashboard in Power BI
What Is a Music and Performing Arts Dashboard in Power BI?
A Music and Performing Arts Dashboard in Power BI is an interactive business intelligence solution designed to monitor and analyze performance metrics related to music events, theater shows, live performances, and cultural programs.
Instead of reviewing disconnected reports, organizers can analyze all KPIs on one centralized platform. Consequently, teams understand performance faster and make better decisions.
The dashboard converts raw operational data into:
- Visual charts and KPI cards
- Profitability analysis reports
- Venue utilization insights
- Audience engagement metrics
- Monthly performance trends
Because Power BI provides real-time filtering and interactive visuals, users explore data instantly without technical complexity.
Why Do Music and Performing Arts Organizations Need a Dashboard?
Managing performing arts events involves multiple moving parts. Event managers must track expenses, ticket sales, artist performance, venue utilization, and audience turnout simultaneously.
However, traditional reporting methods create several problems:
- Data remains scattered across files
- Reports take too long to prepare
- Performance trends remain unclear
- Revenue leaks go unnoticed
- Decision-making becomes reactive instead of proactive
Therefore, a Power BI dashboard solves these issues by delivering centralized and automated insights.
Key Objectives of the Dashboard
- Monitor revenue and expenses in real time
- Analyze performance by event type and genre
- Optimize venue utilization
- Improve profitability planning
- Track audience engagement trends
What Are the Key Features of the Music and Performing Arts Dashboard in Power BI?
This dashboard contains five interactive pages inside the Power BI Desktop application. Each page focuses on a specific performance area.
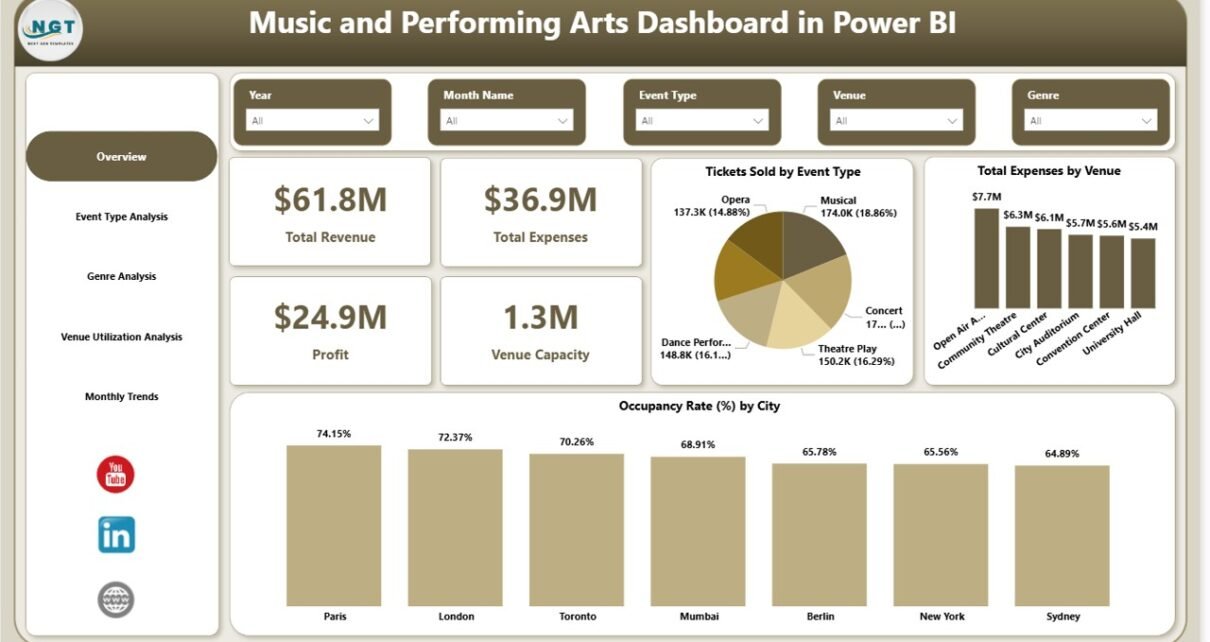
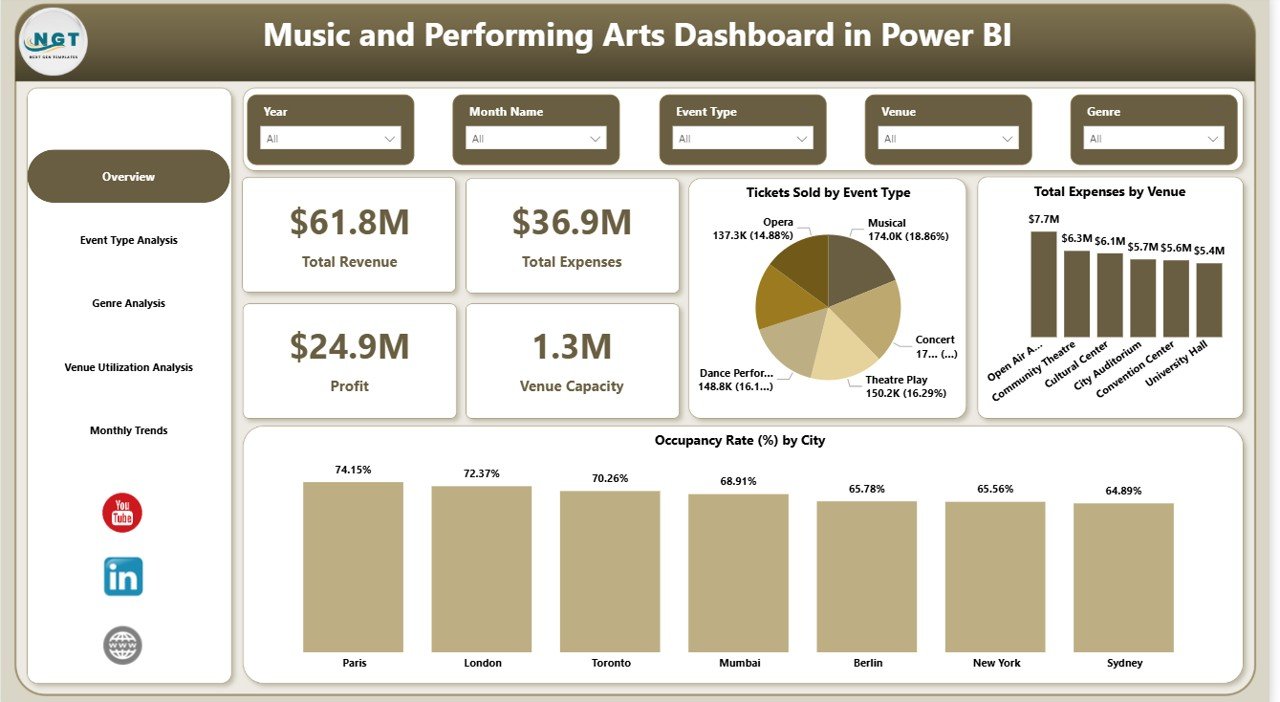
Overview Page – How Does It Provide Instant Performance Insights?
The Overview Page works as the main control center of the dashboard. It gives a quick summary of overall performance.
KPI Cards Included
- Total Revenue
- Total Expenses
- Profit
- Venue Capacity
These KPI cards allow decision-makers to understand financial performance immediately.
Charts Available
- Tickets Sold by Event Type
- Total Expenses by Venue
- Occupancy Rate (%) by City
Additionally, slicers help users filter information by different parameters, enabling faster analysis.
Why this page matters:
Managers quickly identify whether events perform profitably without opening multiple reports.
Click to buy Music and Performing Arts Dashboard in Power BI
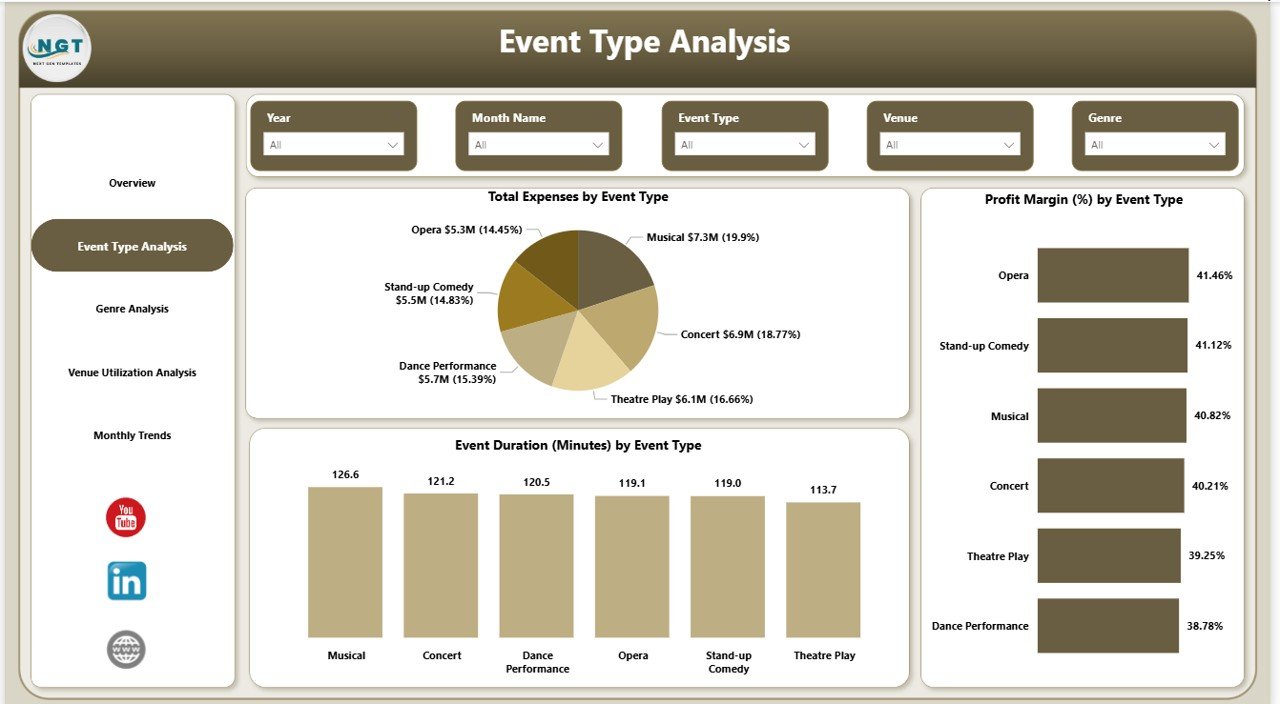
Event Type Analysis – Which Event Types Perform Best?
Different event types generate different outcomes. For example, concerts may attract larger audiences, while theater shows may generate higher profit margins.
The Event Type Analysis Page answers these questions clearly.
Charts Included
- Total Expenses by Event Type
- Profit Margin (%) by Event Type
- Event Duration (Minutes) by Event Type
With slicers applied, users compare performance across categories such as:
- Concerts
- Theatre Performances
- Dance Shows
- Cultural Events
- Live Music Sessions
As a result, organizers allocate budgets more effectively.
Click to buy Music and Performing Arts Dashboard in Power BI
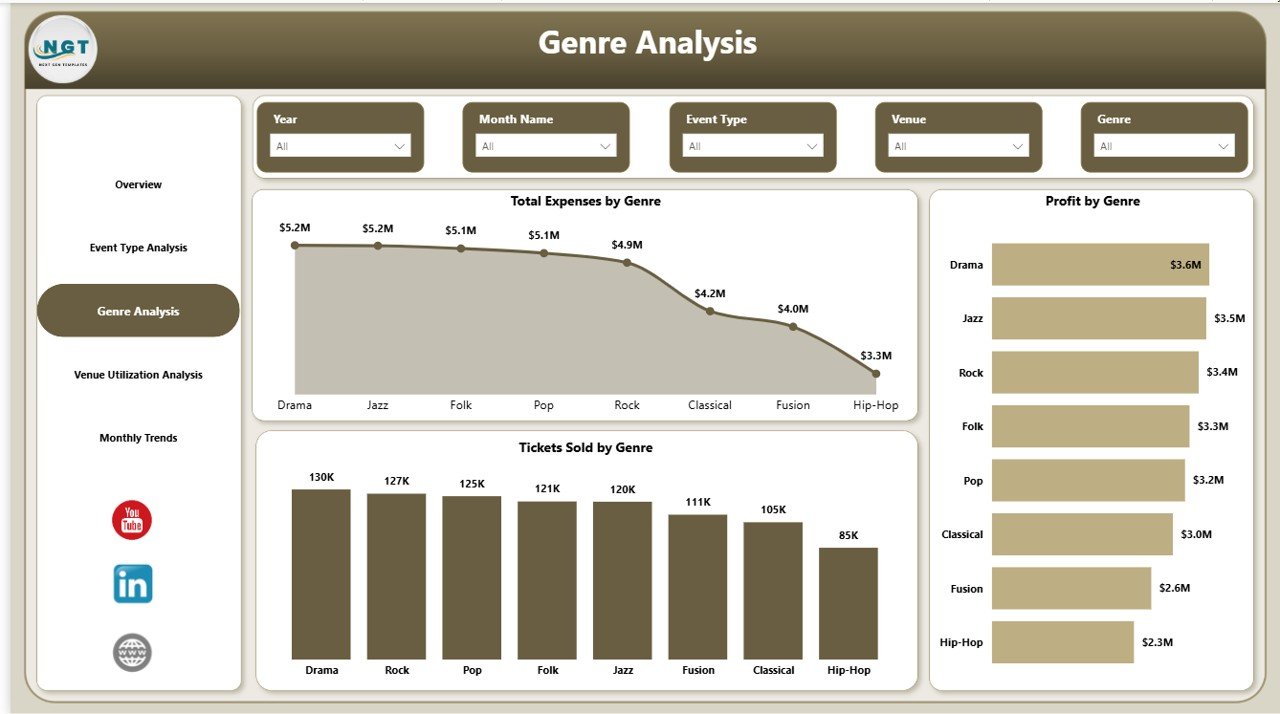
Genre Analysis – Which Music Genres Generate Maximum Profit?
Audience preferences vary widely across genres. Therefore, understanding genre performance becomes essential.
The Genre Analysis Page helps stakeholders analyze financial and audience metrics by genre.
Charts Included
- Total Expenses by Genre
- Profit by Genre
- Tickets Sold by Genre
For instance, organizers may discover that classical performances require lower costs but generate steady revenue, while pop concerts drive high ticket sales.
Consequently, event planning becomes data-backed rather than assumption-based.
Click to buy Music and Performing Arts Dashboard in Power BI
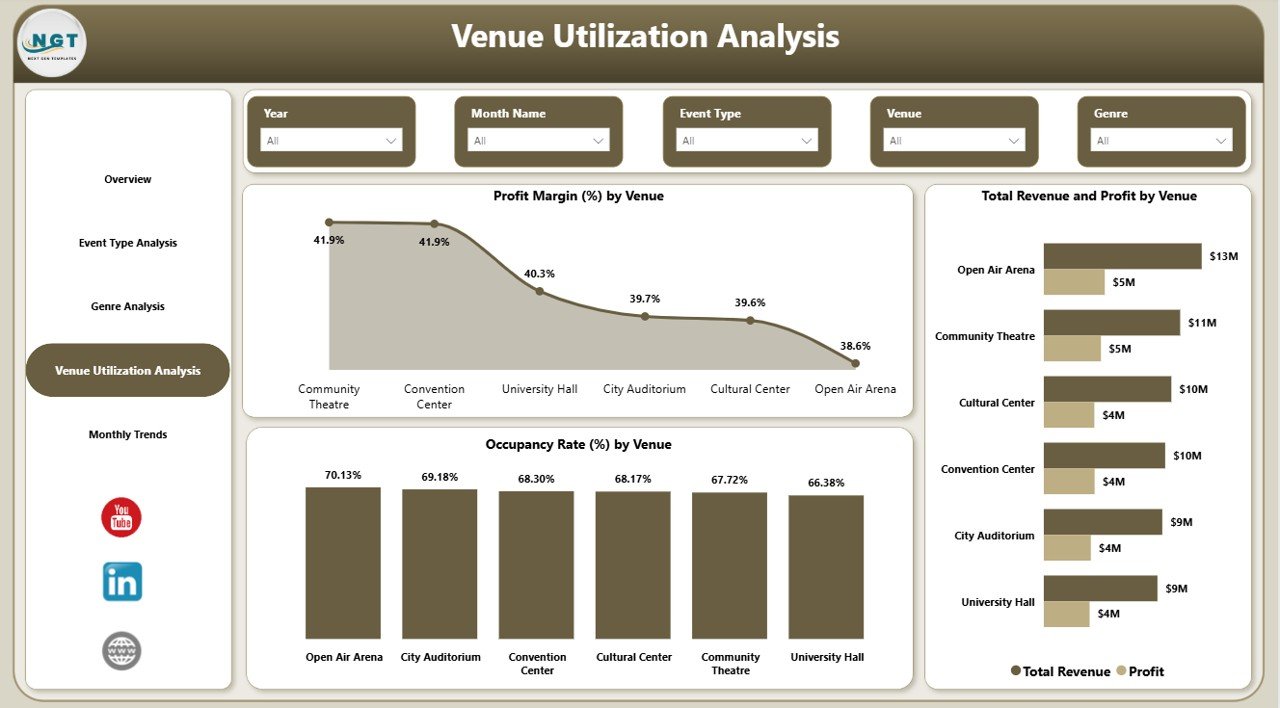
Venue Utilization Analysis – Are Venues Used Efficiently?
Venue management directly impacts profitability. Underutilized venues increase operational costs, while overbooked venues reduce audience experience.
The Venue Utilization Analysis Page provides detailed venue insights.
Charts Included
- Profit Margin (%) by Venue
- Total Revenue and Profit by Venue
- Occupancy Rate (%) by Venue
This page allows event managers to:
- Identify high-performing venues
- Optimize booking schedules
- Improve seating utilization
- Reduce unnecessary expenses
Therefore, organizations maximize revenue from available infrastructure.
Click to buy Music and Performing Arts Dashboard in Power BI
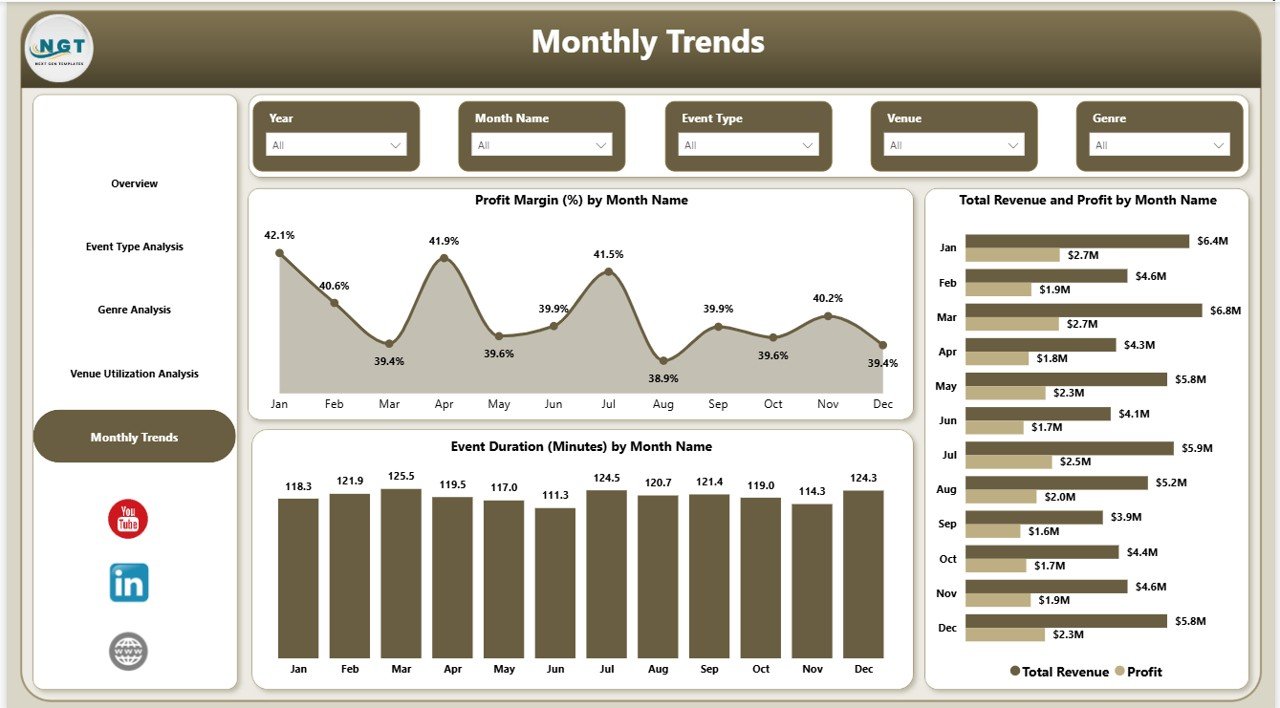
Monthly Trends – How Does Performance Change Over Time?
Tracking trends over time helps organizations plan future events effectively.
The Monthly Trends Page analyzes performance patterns throughout the year.
Charts Included
- Profit Margin (%) by Month Name
- Total Revenue and Profit by Month
- Event Duration (Minutes) by Month
Because seasonal demand affects performing arts industries, this analysis helps teams schedule events strategically.
For example:
- Festivals may boost revenue during specific months
- Summer seasons may show higher attendance
- Certain genres perform better during holidays
Click to buy Music and Performing Arts Dashboard in Power BI
How Does Power BI Improve Performing Arts Analytics?
Power BI offers powerful analytical capabilities that traditional spreadsheets cannot match.
Major Advantages
- Interactive filtering using slicers
- Dynamic visual dashboards
- Automated calculations
- Real-time performance monitoring
- Easy sharing across teams
Moreover, Power BI allows organizations to connect multiple data sources seamlessly.
Advantages of Music and Performing Arts Dashboard in Power BI
Using this dashboard provides several strategic advantages.
Improved Decision-Making
- Managers access insights instantly.
- Teams respond quickly to performance issues.
Better Financial Control
- Track revenue and expenses clearly.
- Identify profit-driving events.
Enhanced Audience Analysis
- Understand ticket sales trends.
- Identify popular genres and event types.
Efficient Venue Management
- Optimize seating utilization.
- Reduce operational waste.
Time-Saving Reporting
- Eliminate manual reporting tasks.
- Generate instant performance summaries.
How Can Organizations Implement This Dashboard Successfully?
Implementing the dashboard requires a structured approach.
Step 1: Collect Data
Gather data related to:
- Ticket sales
- Event schedules
- Venue capacity
- Expenses
- Revenue streams
Step 2: Prepare Data Model
Clean and structure data for analysis.
Step 3: Import Data into Power BI
Load datasets into Power BI Desktop.
Step 4: Build Relationships
Create relationships between tables.
Step 5: Create Visualizations
Add KPI cards, charts, and slicers.
Step 6: Publish and Share
Deploy dashboards to stakeholders.
Best Practices for the Music and Performing Arts Dashboard in Power BI
To achieve the best results, organizations should follow proven practices.
Maintain Clean Data
Accurate dashboards require structured datasets.
Use Consistent KPIs
Define metrics clearly across events.
Update Data Regularly
Frequent updates ensure reliable insights.
Focus on Key Metrics
Avoid overcrowding visuals.
Train Users
Ensure teams understand dashboard navigation.
Monitor Trends Continuously
Regular analysis improves future planning.
Who Can Benefit from This Dashboard?
This solution supports multiple stakeholders.
- Event Managers
- Performing Arts Organizations
- Music Festival Planners
- Theatre Companies
- Cultural Institutions
- Venue Owners
- Financial Analysts
Each role gains actionable insights for better planning.
Future of Performing Arts Analytics
The entertainment industry increasingly relies on data analytics. As technology evolves, dashboards will integrate:
- AI-based attendance predictions
- Audience behavior analytics
- Dynamic pricing strategies
- Real-time ticket monitoring
Therefore, organizations that adopt analytics early gain competitive advantages.
Conclusion
The Music and Performing Arts Dashboard in Power BI transforms how organizations manage events, finances, and audience engagement. Instead of relying on manual reports, decision-makers gain real-time insights through interactive visuals and automated analysis.
Because the dashboard combines revenue tracking, genre analysis, venue utilization, and monthly trends into one platform, teams improve efficiency and profitability simultaneously. Moreover, organizations make smarter strategic decisions backed by data rather than assumptions.
As the performing arts industry continues to grow, adopting analytics-driven solutions becomes essential for sustainable success.
Frequently Asked Questions (FAQs)
- What is a Music and Performing Arts Dashboard in Power BI?
It is an interactive analytics dashboard that helps organizations track event performance, revenue, expenses, and audience trends using Power BI visuals.
- Who should use this dashboard?
Event organizers, theatre companies, music producers, venue managers, and cultural institutions benefit the most.
- Can beginners use this dashboard?
Yes. Power BI dashboards provide easy navigation through slicers and interactive charts.
- What data is required for the dashboard?
You need ticket sales data, event details, expenses, revenue information, and venue capacity data.
- Does this dashboard support real-time updates?
Yes. When connected to live data sources, Power BI updates visuals automatically.
- How does the dashboard improve profitability?
It identifies profitable event types, high-performing venues, and cost-heavy areas, allowing better financial planning.
- Can organizations customize the dashboard?
Yes. Users can modify visuals, KPIs, and filters according to business needs.
- Why choose Power BI instead of Excel reports?
Power BI provides interactive visuals, automation, scalability, and advanced analytics capabilities.
Click to buy Music and Performing Arts Dashboard in Power BI
Visit our YouTube channel to learn step-by-step video tutorials
Watch the step-by-step video tutorial: