In today’s global financial environment, foreign exchange (Forex) services play a critical role in international trade, remittances, travel, investments, and online transactions. Businesses, banks, financial institutions, and forex brokers process thousands of currency transactions every day. However, managing forex data manually often creates confusion, delays, and reporting errors.
Therefore, organizations increasingly rely on structured analytics tools to monitor forex operations effectively. One powerful and practical solution is the Forex Services Dashboard in Excel — a ready-to-use analytical system that transforms raw forex transaction data into meaningful business insights.
Click to Purchases Forex Services Dashboard in Excel
In this comprehensive guide, you will learn everything about the Forex Services Dashboard in Excel, including its features, structure, benefits, implementation strategy, best practices, and frequently asked questions.
What Is a Forex Services Dashboard in Excel?
A Forex Services Dashboard in Excel is an interactive reporting and analysis tool designed to track foreign exchange transactions, customer activity, service fees, settlement performance, and regional currency conversions in a centralized format.
Instead of reviewing multiple spreadsheets separately, users can monitor all forex performance indicators on a single dashboard. As a result, decision-makers quickly understand operational performance and identify improvement areas.
Moreover, Excel provides flexibility, automation, and visualization features that allow organizations to analyze forex services without investing in expensive software.
Why Do Forex Businesses Need a Dashboard?
Forex operations involve multiple variables such as exchange rates, transaction volumes, customer categories, branches, and service channels. Without a dashboard, teams struggle to track performance consistently.
Common Challenges Without a Dashboard
-
Data scattered across multiple files
-
Difficulty tracking completed vs pending transactions
-
Lack of visibility into customer behavior
-
Slow reporting processes
-
Errors in manual calculations
-
Poor decision-making due to delayed insights
However, when organizations implement a structured Excel dashboard, they solve these challenges efficiently.
Key Features of the Forex Services Dashboard in Excel
This ready-to-use dashboard includes a Page Navigator placed on the left side, allowing users to switch between analytical pages easily. Additionally, slicers on the right side enable dynamic filtering and instant analysis.
The Excel file contains five interactive dashboard pages, each designed to analyze forex performance from a different perspective.
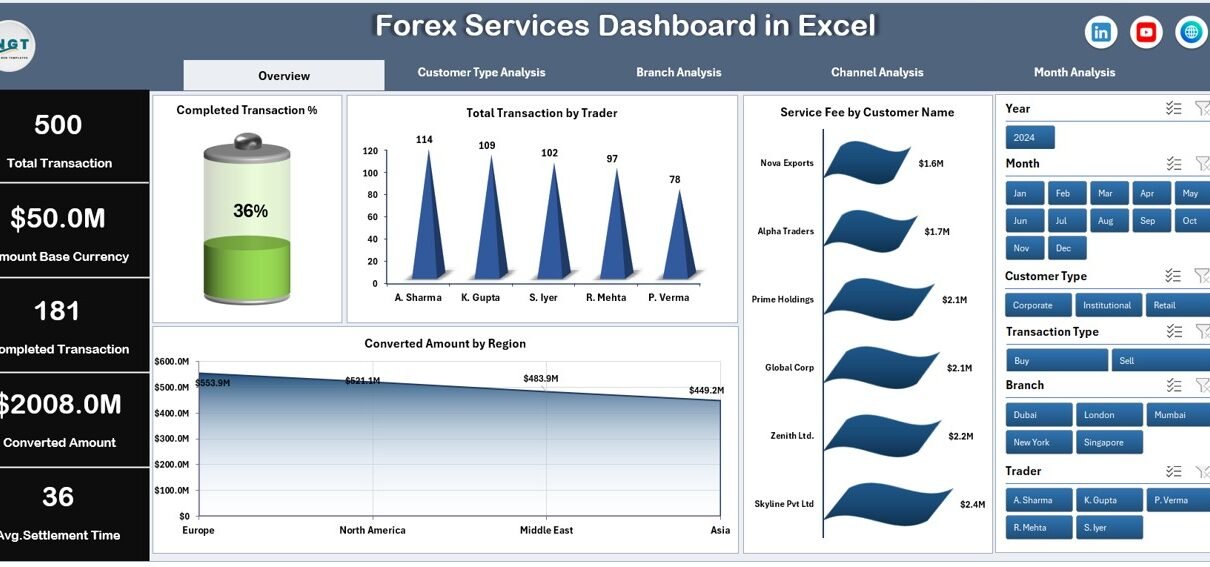
1. Overview Page – How Does It Provide a Complete Business Snapshot?
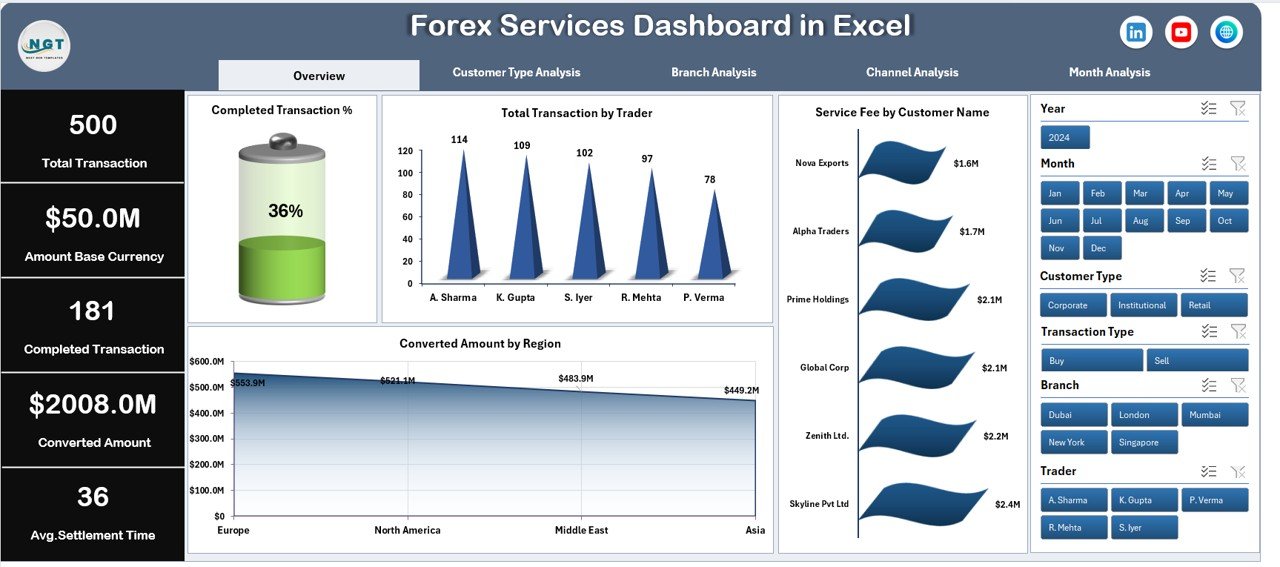
The Overview Page acts as the main control center of the dashboard. It summarizes overall forex performance through visual KPI cards and charts.
Key Elements
-
Right-side slicer for quick filtering
-
Four KPI cards displaying major performance indicators
-
Interactive charts for operational monitoring
Charts Included
-
Completed Transaction % – Measures operational efficiency
-
Total Transaction by Trader – Tracks trader performance
-
Service Fee by Customer Name – Identifies high-value customers
-
Converted Amount by Region – Shows regional transaction distribution
Because this page provides an instant overview, managers can quickly evaluate overall performance without analyzing raw data.
Click to Purchases Forex Services Dashboard in Excel
2. Customer Type Analysis – How Do Different Customers Behave?
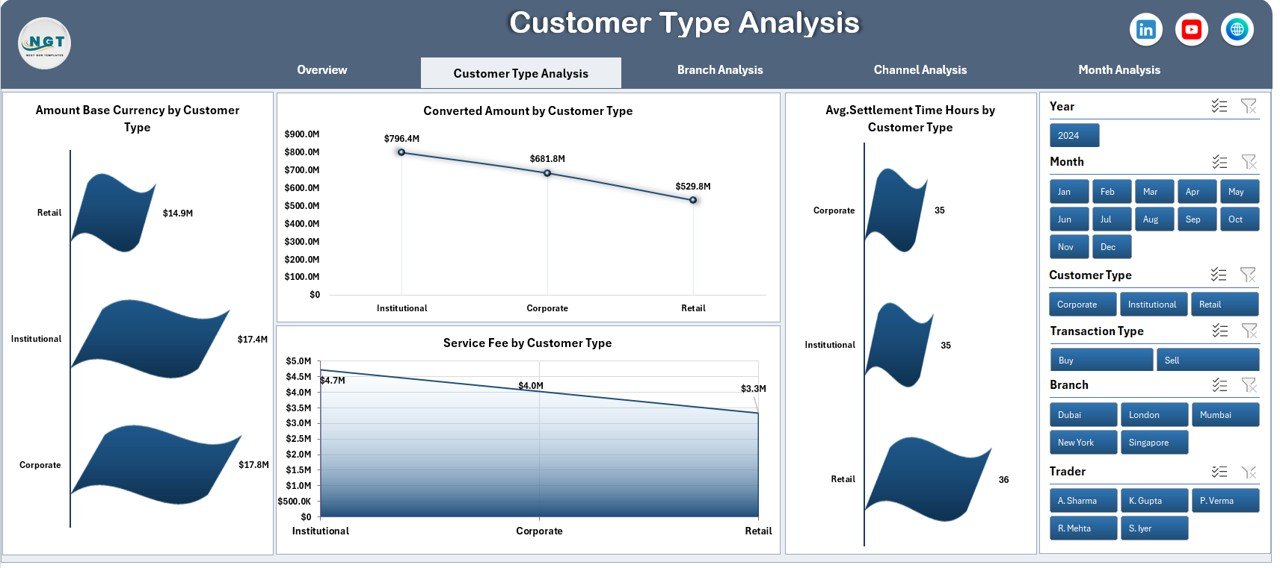
Understanding customer behavior helps forex companies improve services and pricing strategies. Therefore, the dashboard includes a dedicated Customer Type Analysis page.
Charts Available
-
Amount Base Currency by Customer Type
-
Converted Amount by Customer Type
-
Average Settlement Time (Hours) by Customer Type
-
Service Fee by Customer Type
Business Benefits
-
Compare retail vs corporate customers
-
Identify profitable customer segments
-
Monitor service efficiency
-
Improve customer experience strategies
As a result, organizations make data-driven decisions about customer engagement and pricing models.
3. Branch Analysis – Which Branch Performs Better?
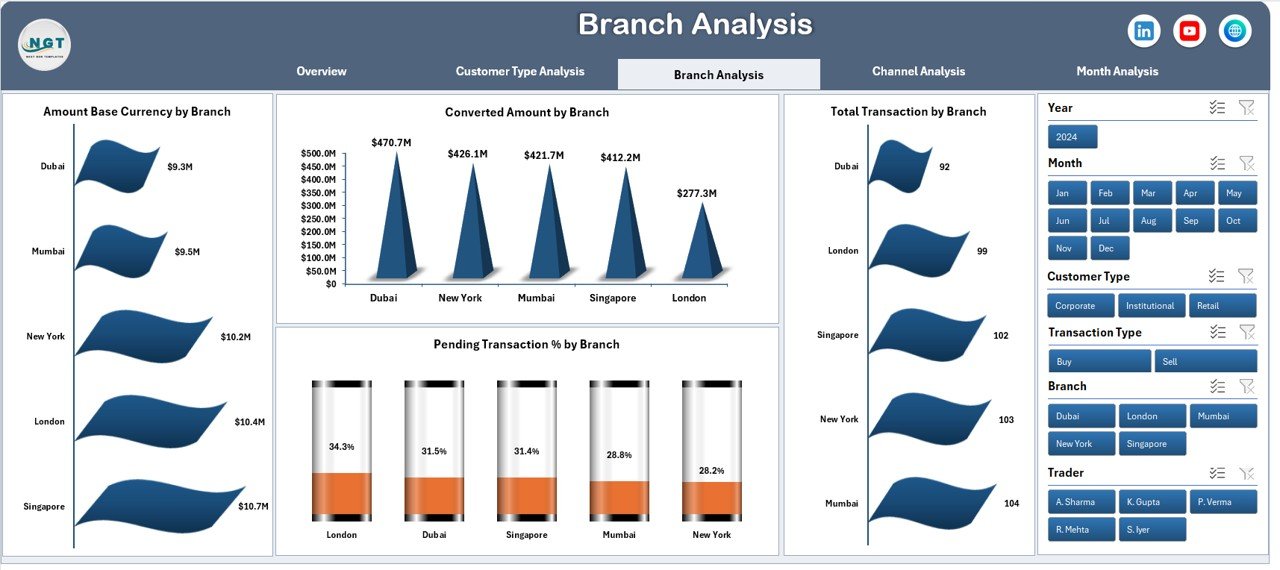
Forex companies often operate across multiple branches. Consequently, performance comparison becomes essential.
The Branch Analysis Page allows managers to evaluate operational efficiency branch-wise.
Charts Included
-
Amount Base Currency by Branch
-
Converted Amount by Branch
-
Total Transactions by Branch
-
Pending Transaction % by Branch
-
Click to Purchases Forex Services Dashboard in Excel
Why This Matters
-
Detect underperforming branches quickly
-
Improve operational accountability
-
Allocate resources efficiently
-
Reduce pending transactions
Therefore, branch managers gain clear performance visibility.
4. Channel Analysis – Which Service Channel Drives More Transactions?
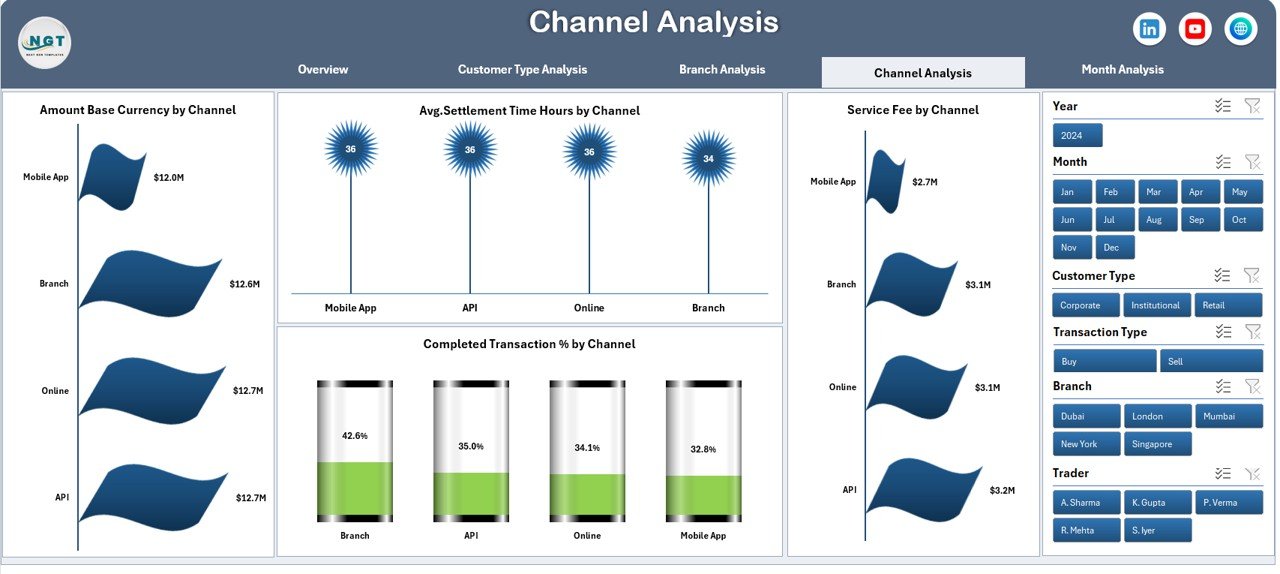
Customers interact with forex services through different channels such as online platforms, agents, mobile apps, or physical counters.
The Channel Analysis Page helps organizations understand channel performance.
Charts Available
-
Amount Base Currency by Channel
-
Average Settlement Time Hours by Channel
-
Service Fee by Channel
-
Completed Transaction % by Channel
Insights Provided
-
Identify the fastest transaction channels
-
Evaluate digital adoption trends
-
Optimize customer service channels
-
Improve processing efficiency
Consequently, companies enhance operational strategy based on real usage patterns.
5. Month Analysis – How Does Performance Change Over Time?
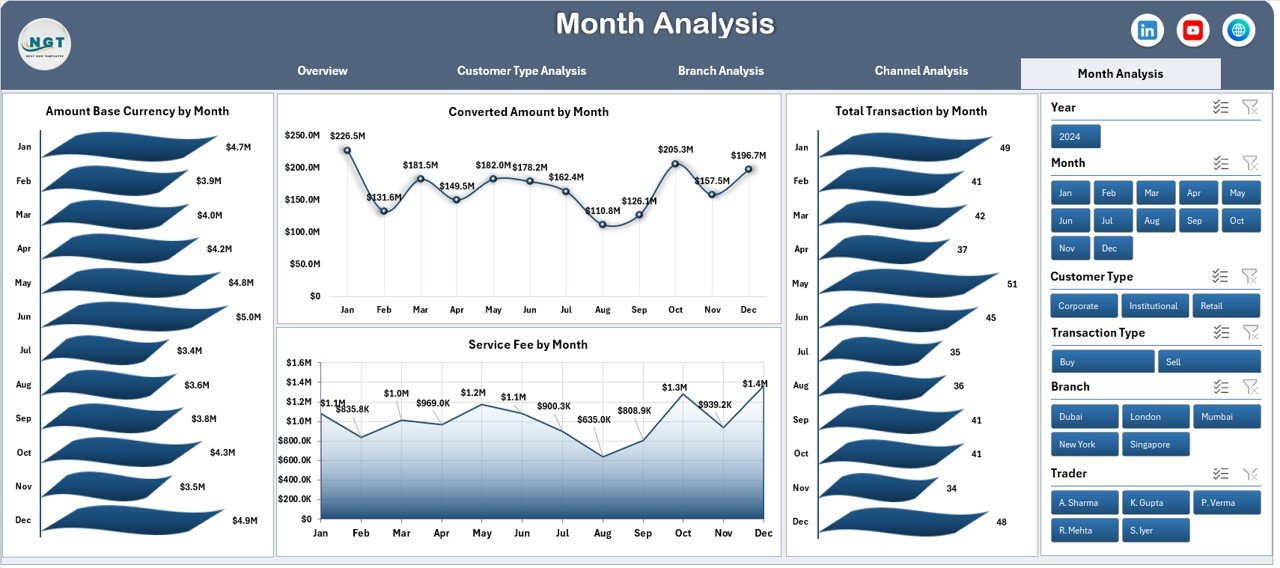
Trend analysis plays a crucial role in financial planning. Therefore, the dashboard includes a Month Analysis Page.
Charts Included
-
Amount Base Currency by Month
-
Converted Amount by Month
-
Total Transactions by Month
-
Service Fee by Month
Key Advantages
-
Identify seasonal transaction trends
-
Monitor monthly growth
-
Forecast future performance
-
Evaluate business expansion impact
Because monthly analysis reveals patterns, leaders make smarter financial decisions.
Click to Purchases Forex Services Dashboard in Excel
Support Sheet – Why Is It Important?
The Support Sheet works as the backend logic layer of the dashboard.
It helps in:
-
Data calculations
-
Lookup formulas
-
Data transformation
-
KPI preparation
Although users rarely interact with this sheet, it ensures smooth dashboard functioning.
Data Sheet – The Foundation of the Dashboard
The Data Sheet stores all forex transaction records.
Typical data fields include:
-
Transaction ID
-
Trader Name
-
Customer Name
-
Customer Type
-
Branch
-
Channel
-
Base Currency Amount
-
Converted Amount
-
Settlement Time
-
Service Fee
-
Region
-
Transaction Status
-
Transaction Date
Since the dashboard connects directly to this sheet, updating data automatically refreshes reports.
How Does the Forex Services Dashboard Improve Decision-Making?
A structured dashboard converts raw data into actionable insights. Therefore, management teams can make faster and more accurate decisions.
Key Improvements
-
Real-time performance visibility
-
Faster reporting cycles
-
Reduced manual work
-
Accurate transaction tracking
-
Improved operational control
Moreover, decision-makers identify risks before they become serious problems.
Advantages of Forex Services Dashboard in Excel
Using an Excel-based forex dashboard provides multiple operational and strategic benefits.
✅ Centralized Data Management
All forex information stays in one place, which improves accessibility.
✅ Easy Performance Monitoring
Interactive charts simplify complex data interpretation.
✅ Faster Decision-Making
Managers instantly identify performance trends.
✅ Cost-Effective Solution
Excel eliminates the need for expensive BI tools.
✅ Customizable Structure
Organizations can modify KPIs according to business needs.
✅ Improved Transparency
Teams clearly track transactions and settlement performance.
✅ Better Customer Insights
Businesses understand customer segments more effectively.
How to Use the Forex Services Dashboard in Excel?
Click to Purchases Forex Services Dashboard in Excel
Implementing the dashboard remains simple and user-friendly.
Step-by-Step Process
-
Enter transaction data into the Data Sheet.
-
Refresh pivot tables if required.
-
Use slicers to filter information.
-
Navigate pages using the Page Navigator.
-
Analyze KPIs and charts instantly.
Because Excel automates calculations, users save significant time.
Who Can Benefit from This Dashboard?
Many professionals and organizations can use this dashboard effectively.
Ideal Users
-
Forex service providers
-
Currency exchange companies
-
Banks and financial institutions
-
International payment companies
-
Remittance businesses
-
Financial analysts
-
Operations managers
Additionally, small forex firms benefit because Excel requires minimal technical setup.
Best Practices for the Forex Services Dashboard in Excel
To maximize dashboard performance, organizations should follow proven best practices.
✔ Maintain Clean Data
Always avoid duplicate or incomplete records.
✔ Update Data Regularly
Frequent updates ensure accurate analysis.
✔ Use Consistent Currency Formats
Standard formatting prevents calculation errors.
✔ Monitor Settlement Time
Track delays and improve processing workflows.
✔ Review KPIs Monthly
Regular review helps detect trends early.
✔ Limit Manual Changes
Avoid altering formulas or support sheets unnecessarily.
✔ Train Team Members
Ensure users understand slicers and filters.
By following these practices, businesses maintain dashboard accuracy and reliability.
How Does Excel Make Forex Analytics Powerful?
Click to Purchases Forex Services Dashboard in Excel
Although advanced BI tools exist, Excel remains widely used because of its flexibility.
Excel Strengths
-
Pivot tables for quick analysis
-
Interactive slicers
-
Conditional formatting
-
Chart customization
-
Automation formulas
-
Easy data updates
Therefore, even non-technical users can analyze forex performance effectively.
Future Scope of Forex Dashboards
As digital payments grow, forex analytics will become even more important. Organizations increasingly focus on data-driven strategies.
Future dashboards may include:
-
Real-time exchange rate integration
-
Automated alerts for delays
-
AI-based forecasting
-
Risk monitoring indicators
-
Integration with banking systems
Consequently, dashboards will evolve into intelligent decision platforms.
Common Mistakes to Avoid While Using Forex Dashboards
Even powerful dashboards fail if users ignore data discipline.
Avoid These Errors
-
Entering incorrect transaction dates
-
Mixing currency formats
-
Ignoring pending transactions
-
Overloading dashboards with unnecessary KPIs
-
Not reviewing trends regularly
Therefore, maintaining data quality remains essential.
Conclusion
The Forex Services Dashboard in Excel provides a smart and practical solution for managing forex operations efficiently. Instead of relying on manual reports, organizations gain structured insights into transactions, customers, branches, channels, and monthly performance.
Moreover, the dashboard simplifies complex forex data through interactive visuals and automated analysis. As a result, businesses improve operational efficiency, reduce delays, and make faster strategic decisions.
Because Excel remains accessible and customizable, companies of all sizes can implement this dashboard without technical barriers. Ultimately, adopting a Forex Services Dashboard helps organizations move toward data-driven forex management and sustainable growth.
Frequently Asked Questions (FAQs)
1. What is a Forex Services Dashboard in Excel used for?
It helps organizations monitor forex transactions, settlement performance, service fees, and operational efficiency using interactive charts and KPIs.
2. Is this dashboard suitable for small forex businesses?
Yes. Excel-based dashboards work perfectly for small and medium businesses because they require minimal investment.
3. Can I customize the dashboard KPIs?
Yes. Users can modify KPIs, charts, and calculations according to business requirements.
4. Do I need advanced Excel skills to use it?
No. Basic Excel knowledge is enough to operate slicers, filters, and data updates.
5. How often should data be updated?
You should update data daily or weekly depending on transaction volume.
6. Can the dashboard handle multiple currencies?
Yes. The dashboard supports multiple currency transactions through structured data fields.
7. Does updating data automatically refresh charts?
Yes. Once data updates and pivots refresh, charts update automatically.
8. Why is settlement time tracking important?
Settlement time indicates operational efficiency and helps reduce processing delays.
9. Can banks use this dashboard?
Absolutely. Banks, forex brokers, and remittance companies can all use it effectively.
10. Is Excel secure for financial reporting?
Yes, especially when organizations apply file permissions and access controls properly.
Visit our YouTube channel to learn step-by-step video tutorials