Digital streaming platforms have transformed the entertainment industry. Today, millions of users watch movies, TV shows, documentaries, and live content through online streaming services. Because of this rapid growth, companies must continuously monitor subscriptions, revenue, operational costs, and user engagement.
However, many streaming companies struggle to track their performance effectively. Often, teams rely on scattered spreadsheets, disconnected reports, or incomplete analytics. As a result, decision-makers cannot clearly understand which platform performs best, which content generates the highest revenue, or which device users prefer the most.
Therefore, companies need a centralized and visual system to track streaming performance.
This is where the Digital Streaming Platforms Dashboard in Power BI becomes extremely valuable.
A Power BI dashboard allows organizations to analyze streaming data, monitor revenue, evaluate operational costs, and identify profitable content or platforms in one place. Instead of reviewing multiple reports, managers can instantly understand performance through interactive charts and visuals.
In this detailed guide, you will learn:
- What a Digital Streaming Platforms Dashboard in Power BI is
- Why streaming companies need analytics dashboards
- Key features of the Power BI dashboard template
- Important streaming performance metrics
- Advantages of using a streaming dashboard
- Best practices for managing streaming analytics
- Frequently asked questions about streaming dashboards
Click to buy Digital Streaming Platforms Dashboard in Power BI
What Is a Digital Streaming Platforms Dashboard in Power BI?
A Digital Streaming Platforms Dashboard in Power BI is an interactive analytics tool that helps streaming businesses track subscriptions, revenue, content performance, operational costs, and profitability.
Power BI connects streaming data and converts it into visual insights through charts, KPIs, and filters. As a result, managers can monitor platform performance quickly and make data-driven decisions.
Instead of manually reviewing multiple spreadsheets, organizations can analyze streaming performance in a centralized dashboard.
This type of dashboard helps answer important questions such as:
- Which streaming platform generates the most revenue?
- Which subscription plan performs best?
- Which device generates the highest streaming revenue?
- Which content type produces the most profit?
- How do monthly streaming costs compare with revenue?
Because of these insights, companies can optimize content strategy, pricing models, and operational efficiency.
Why Do Streaming Platforms Need a Power BI Dashboard?
Digital streaming companies operate in a highly competitive environment. Every day, they manage subscriptions, streaming content, user engagement, and operational costs.
However, without proper analytics tools, performance tracking becomes difficult.
A Power BI dashboard solves this problem by providing real-time visual insights.
Streaming companies use dashboards to:
- Monitor subscription revenue growth
- Track operational and content costs
- Analyze content performance
- Evaluate platform profitability
- Understand user viewing devices
- Compare subscription plans
- Identify top-performing content
As a result, managers gain a clear understanding of streaming operations.
Key Features of the Digital Streaming Platforms Dashboard in Power BI
The Digital Streaming Platforms Dashboard in Power BI includes multiple analytical pages that help organizations analyze streaming performance from different perspectives.
This dashboard contains five analytical pages in the Power BI Desktop file.
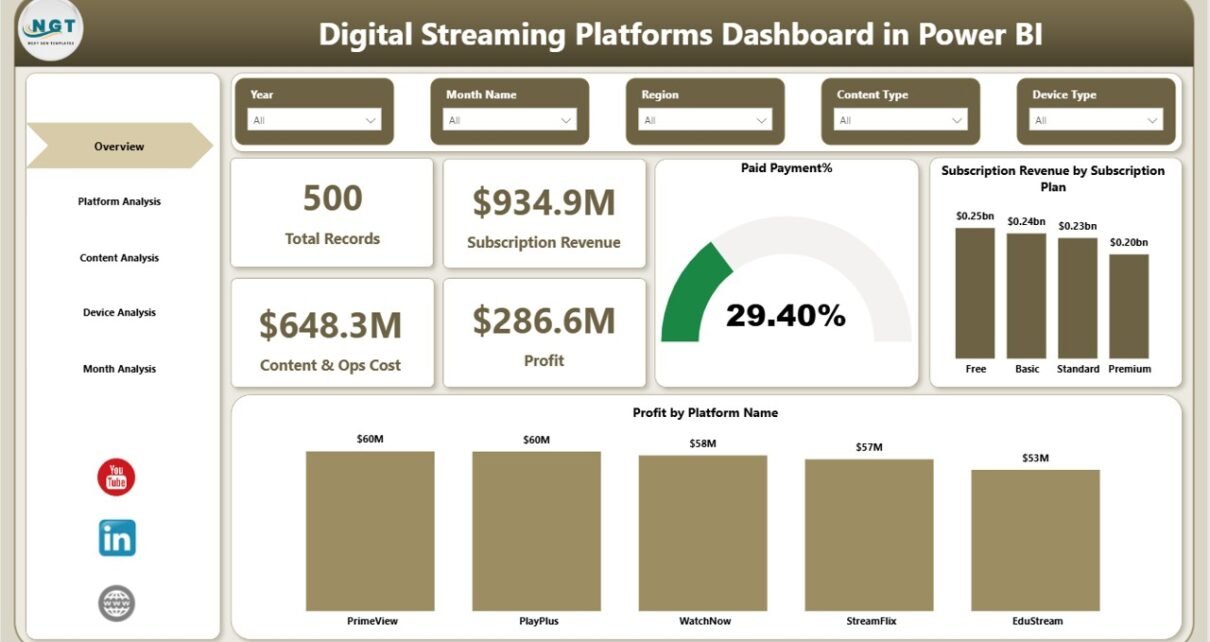
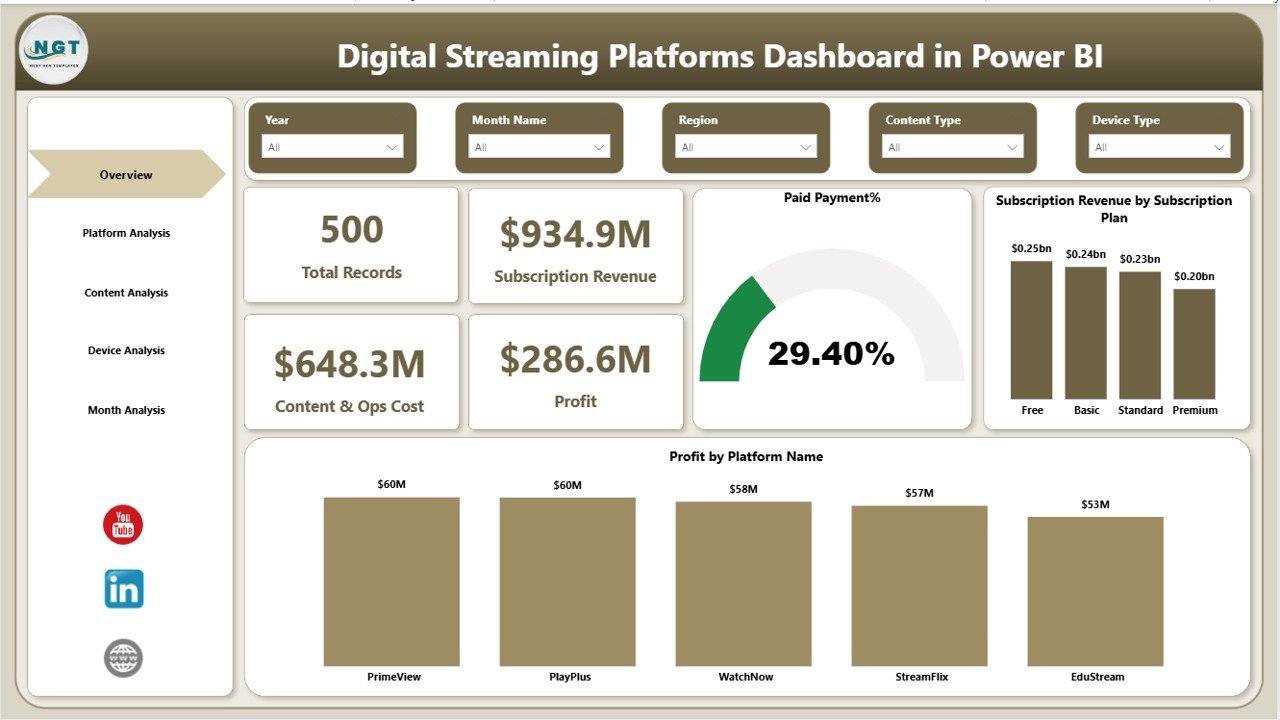
Overview Page
The Overview Page serves as the main dashboard where users can quickly evaluate the overall performance of streaming platforms.
This page includes slicers that allow users to filter data easily.
KPI Cards on the Overview Page
The dashboard displays four key performance indicators:
- Total Records
- Subscription Revenue
- Content & Operations Cost
- Profit
These KPI cards help users instantly understand the business performance.
Charts Available on the Overview Page
The Overview page contains three visual charts:
- Paid Payment %
- Subscription Revenue by Subscription Plan
- Profit by Platform Name
Because of these visuals, decision-makers can quickly understand which subscription plans generate the most revenue and which platforms contribute the most profit.
Click to buy Digital Streaming Platforms Dashboard in Power BI
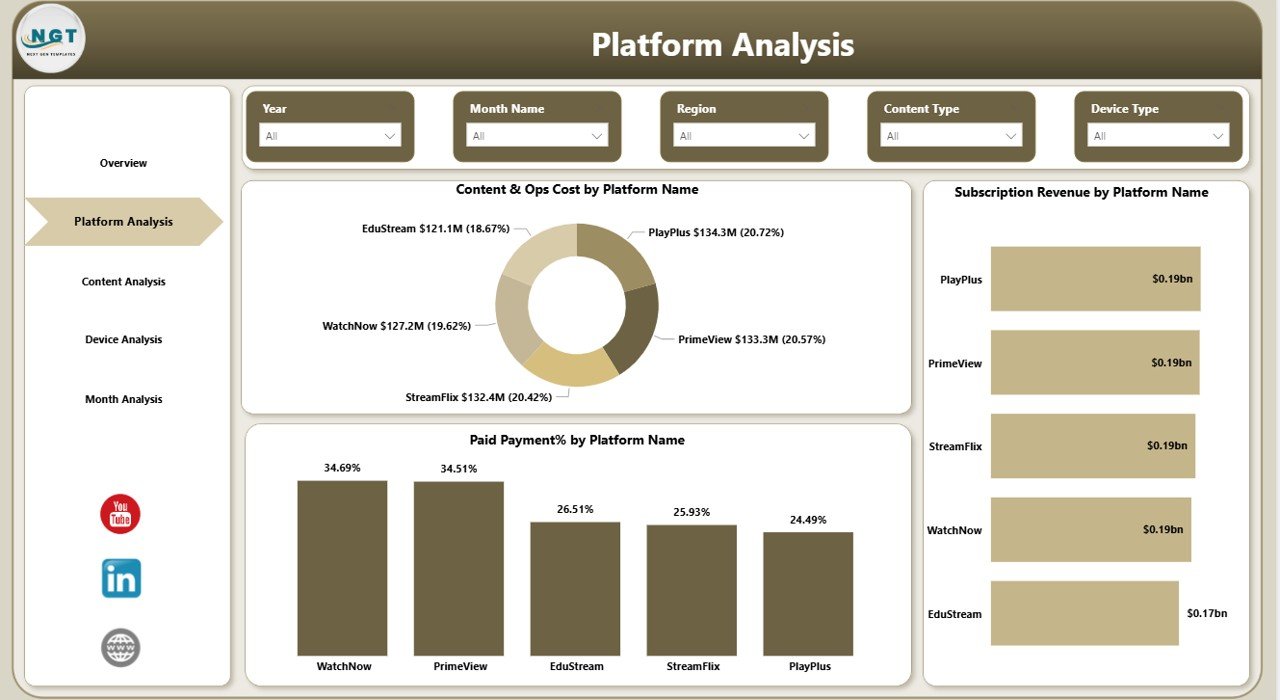
Platform Analysis Page
The Platform Analysis Page focuses on analyzing streaming performance across different platforms.
Streaming companies often operate on multiple platforms such as:
- Mobile apps
- Smart TVs
- Web browsers
- Streaming devices
Therefore, platform-level analytics becomes essential.
Charts in Platform Analysis
This page includes three analytical charts:
- Content & Operations Cost by Platform Name
- Subscription Revenue by Platform Name
- Paid Invoice % by Platform Name
These insights help companies evaluate the profitability of each platform.
For example, if a platform generates high costs but low revenue, managers can optimize content distribution strategies.
Click to buy Digital Streaming Platforms Dashboard in Power BI
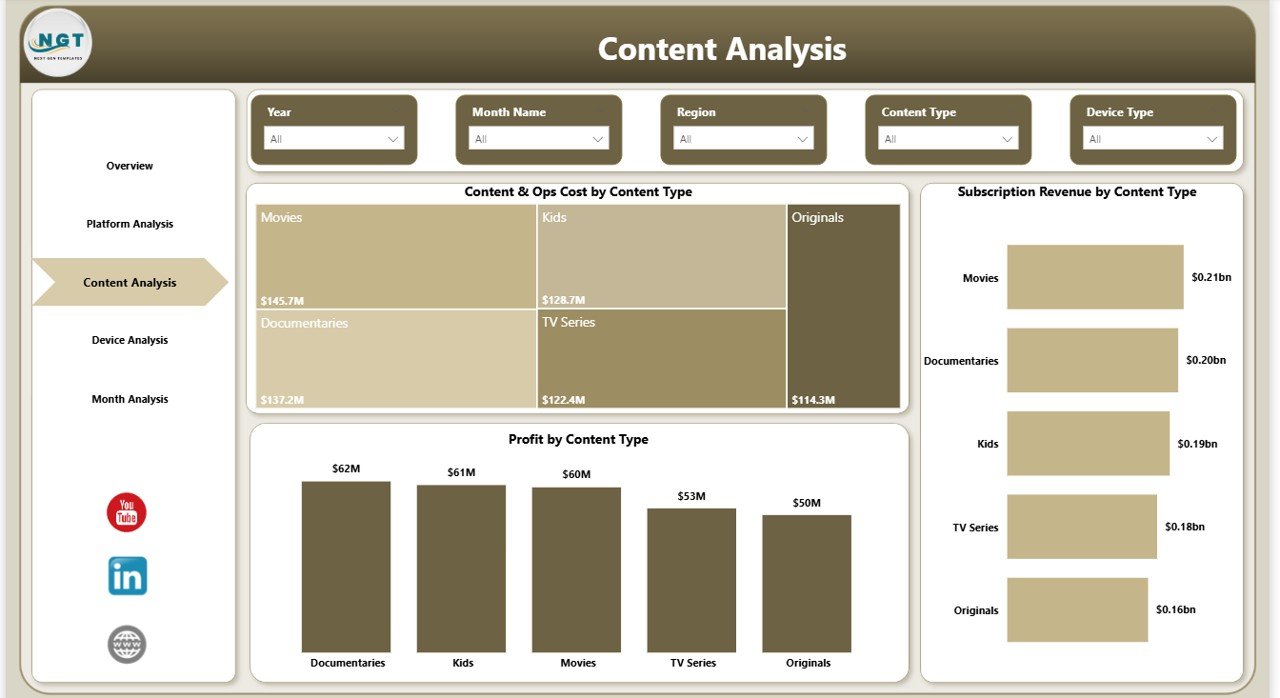
Content Analysis Page
Content drives the success of every streaming platform. Therefore, understanding content performance becomes critical.
The Content Analysis Page helps companies analyze which content types generate the most revenue and profit.
This page includes slicers that allow users to filter data easily.
Charts in Content Analysis
The page contains three important charts:
- Content & Operations Cost by Content Name
- Subscription Revenue by Content Type
- Profit by Content Type
These charts help companies understand:
- Which shows attract more viewers
- Which content types generate the most subscriptions
- Which content categories produce the highest profit
Because of these insights, streaming companies can make better content investment decisions.
Click to buy Digital Streaming Platforms Dashboard in Power BI
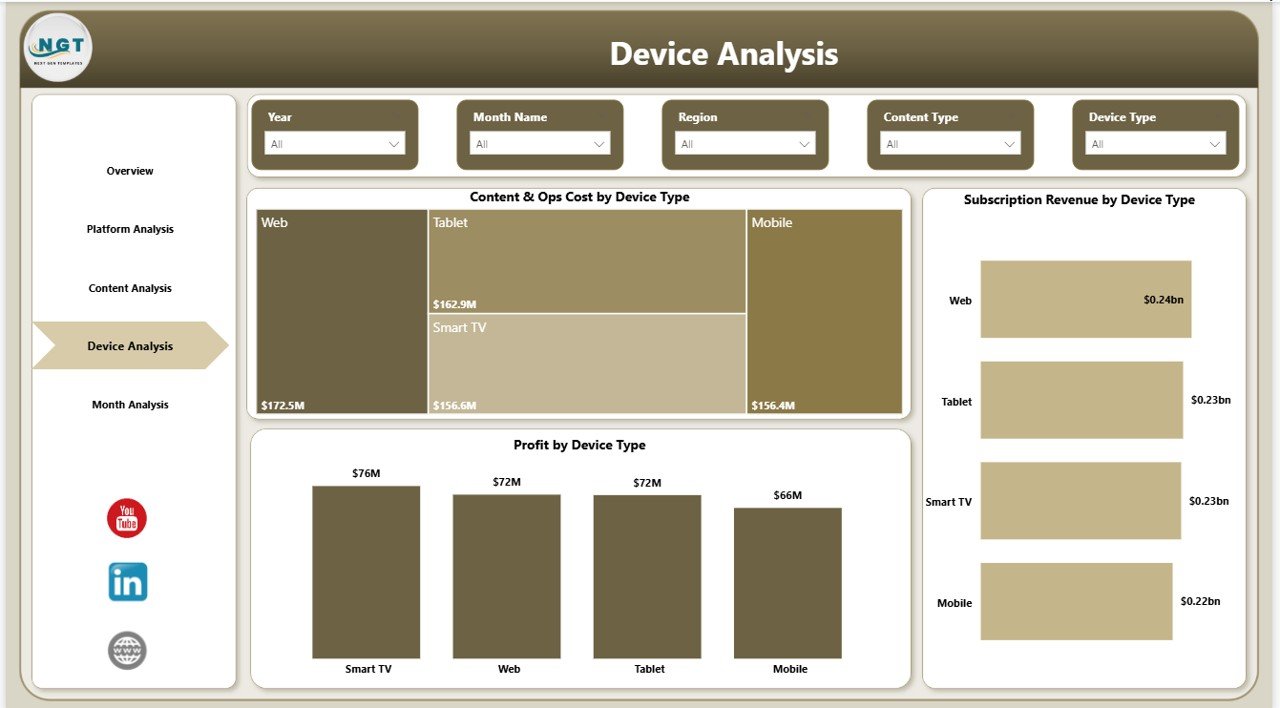
Device Analysis Page
Streaming audiences use multiple devices to watch content.
Common streaming devices include:
- Smartphones
- Tablets
- Smart TVs
- Laptops
- Gaming consoles
Therefore, device-level analytics becomes extremely valuable.
The Device Analysis Page provides insights about streaming performance across different devices.
Charts in Device Analysis
This page contains three analytical visuals:
- Content & Operations Cost by Device Type
- Subscription Revenue by Device Type
- Profit by Device Type
These insights help streaming companies understand where users watch content most frequently.
For example, if smart TV users generate the highest revenue, companies can prioritize smart TV optimization.
Click to buy Digital Streaming Platforms Dashboard in Power BI
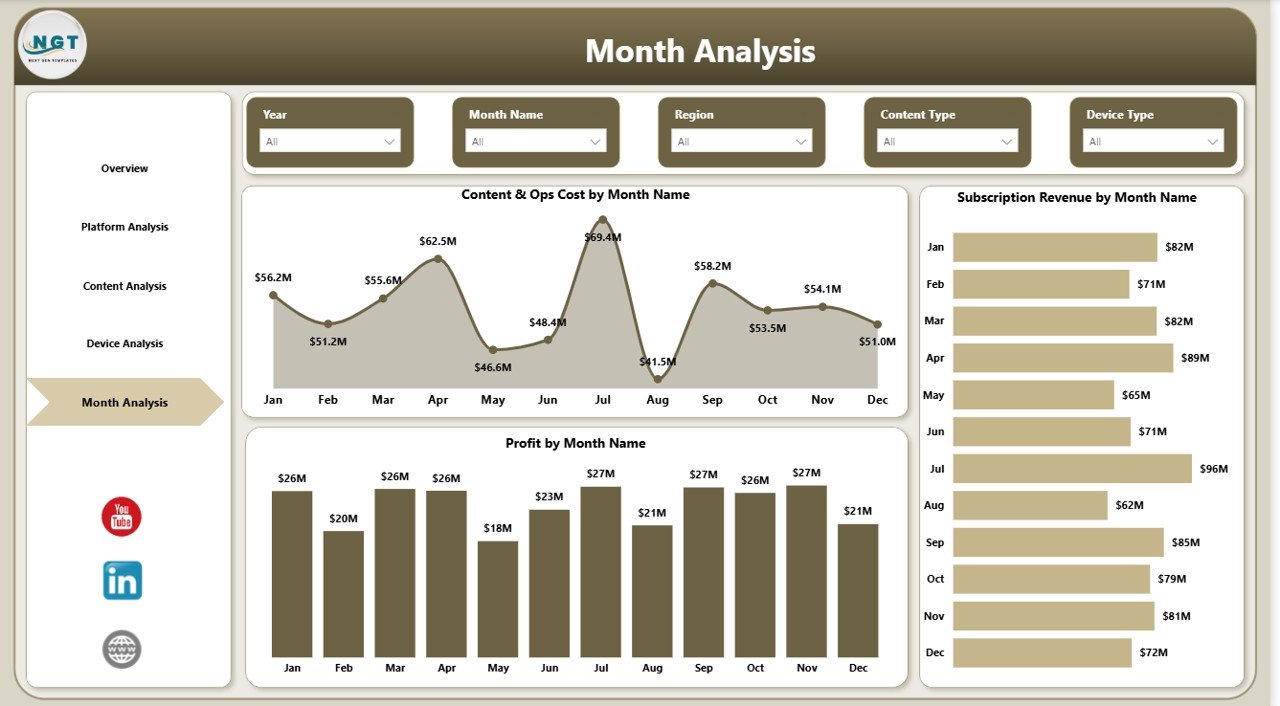
Month Analysis Page
Streaming performance changes throughout the year. Seasonal trends, content releases, and promotions can significantly impact subscriptions and revenue.
The Month Analysis Page helps managers analyze monthly streaming performance.
This page includes slicers to filter data based on different criteria.
Charts in Month Analysis
The page includes charts such as:
- Content & Operations Cost by Month
- Revenue Trends by Month
- Profit Trends by Month
Because of these visuals, organizations can easily identify growth trends and seasonal patterns.
For example:
- Revenue may increase during holiday seasons
- Costs may rise when companies launch new content
- Profit margins may fluctuate depending on subscriber growth
Therefore, monthly analysis helps companies plan content launches and marketing campaigns more effectively.
Click to buy Digital Streaming Platforms Dashboard in Power BI
Important KPIs for Digital Streaming Platforms
Streaming companies rely on several key performance indicators to measure business success.
Some of the most important KPIs include:
Revenue KPIs
- Subscription Revenue
- Average Revenue per User (ARPU)
- Revenue by Subscription Plan
- Revenue by Platform
Cost KPIs
- Content Production Cost
- Content Licensing Cost
- Operational Cost
- Technology Infrastructure Cost
Profit KPIs
- Platform Profit
- Profit Margin
- Content Profitability
User Engagement KPIs
- Paid Subscription Percentage
- Active Subscribers
- Viewing Time
- Device Usage Distribution
These KPIs provide a complete picture of streaming performance.
Advantages of Digital Streaming Platforms Dashboard in Power BI
Using a Power BI dashboard for streaming analytics offers several benefits.
- Centralized Performance Monitoring
A single dashboard consolidates all streaming metrics in one place. As a result, managers no longer need to review multiple reports.
- Faster Decision-Making
Power BI visualizations allow teams to understand performance instantly. Therefore, companies can make quicker decisions.
- Interactive Data Analysis
Slicers and filters allow users to analyze data dynamically. Because of this, managers can explore different perspectives easily.
- Improved Revenue Optimization
The dashboard helps companies identify profitable subscription plans, platforms, and content types.
- Better Content Investment Strategy
By analyzing content performance, companies can invest in high-performing shows and reduce spending on low-performing content.
Opportunities for Improvement
Even though dashboards provide powerful insights, companies can always improve their analytics strategies.
Organizations can enhance their dashboards by:
- Integrating real-time streaming data
- Adding viewer engagement metrics
- Tracking subscriber churn rate
- Monitoring content watch time
- Including regional streaming analysis
- Adding customer demographics insights
- Integrating marketing campaign analytics
These improvements can provide deeper insights and support better decision-making.
Best Practices for the Digital Streaming Platforms Dashboard in Power BI
Organizations should follow certain best practices to maximize the value of their streaming dashboards.
Define Clear KPIs
Companies must define the most important streaming KPIs before designing dashboards.
Maintain Data Accuracy
Clean and structured data ensures reliable analytics.
Use Interactive Filters
Slicers allow users to analyze data dynamically across different platforms, devices, and months.
Keep Visualizations Simple
Simple charts improve readability and help decision-makers understand insights faster.
Update Data Regularly
Regular data updates ensure the dashboard reflects the latest streaming performance.
Monitor Profitability Continuously
Companies should track profit trends to ensure sustainable growth.
How Does a Power BI Dashboard Improve Streaming Business Decisions?
A Power BI dashboard significantly improves decision-making.
Managers can quickly identify:
- Which platforms generate the most profit
- Which content types attract subscribers
- Which devices drive revenue
- Which months produce the highest growth
Because of these insights, companies can adjust their strategies effectively.
For example:
- Invest more in popular content categories
- Improve device compatibility
- Optimize subscription pricing
- Reduce operational costs
Therefore, analytics dashboards play a crucial role in the success of digital streaming businesses.
Conclusion
The digital streaming industry continues to grow rapidly. As competition increases, streaming companies must monitor their performance carefully.
A Digital Streaming Platforms Dashboard in Power BI provides a powerful solution for tracking subscriptions, revenue, operational costs, and profitability.
Through interactive visuals and data insights, organizations can analyze platform performance, evaluate content profitability, and understand user behavior.
As a result, decision-makers gain the clarity needed to improve streaming strategies and increase profitability.
Ultimately, a well-designed Power BI dashboard helps streaming companies transform raw data into actionable insights.
Frequently Asked Questions (FAQs)
What is a Digital Streaming Platforms Dashboard?
A Digital Streaming Platforms Dashboard is an analytics tool that tracks streaming performance, subscription revenue, content costs, and profitability using visual charts and KPIs.
Why do streaming companies use Power BI dashboards?
Streaming companies use Power BI dashboards to analyze revenue, track operational costs, monitor content performance, and improve decision-making through visual insights.
What data can be tracked in a streaming dashboard?
A streaming dashboard can track:
- Subscription revenue
- Content costs
- Platform performance
- Device usage
- Profit margins
- Monthly revenue trends
How does Power BI help streaming analytics?
Power BI converts complex streaming data into visual insights through interactive charts, KPIs, and filters. As a result, managers can quickly understand business performance.
Who can use a streaming analytics dashboard?
Streaming dashboards can benefit:
- Streaming platform managers
- Media companies
- Content producers
- Data analysts
- Business executives
Visit our YouTube channel to learn step-by-step video tutorials
Watch the step-by-step video tutorial: