Adventure tourism has become one of the fastest-growing segments of the global travel industry. Travelers no longer want traditional sightseeing tours only. Instead, they seek thrilling experiences such as trekking, rafting, mountain biking, wildlife safaris, scuba diving, and many other adventure activities.
However, managing adventure tourism operations can become complex. Tour operators must track bookings, customer satisfaction, seasonal demand, safety incidents, pricing, and revenue across multiple destinations and packages. If businesses rely only on manual reports or scattered spreadsheets, they struggle to understand performance trends.
Click to Purchases Adventure Tourism Dashboard in Excel
Therefore, tourism companies need a structured analytics system that brings all important metrics together in one place. This is exactly where the Adventure Tourism Dashboard in Excel becomes extremely valuable.
The Adventure Tourism Dashboard in Excel is a ready-to-use analytical dashboard that helps tourism companies monitor bookings, analyze revenue, evaluate customer ratings, and track safety metrics. Because Excel provides powerful data visualization and pivot-based analysis, businesses can quickly identify trends and make informed decisions.
In this article, you will learn everything about the Adventure Tourism Dashboard in Excel, including its features, benefits, analytical capabilities, best practices, and implementation strategies.
What is an Adventure Tourism Dashboard in Excel?
An Adventure Tourism Dashboard in Excel is a structured reporting tool designed to monitor the performance of adventure tourism operations. It collects data from booking systems, customer feedback, destinations, and tour packages and converts it into meaningful insights through charts, KPI indicators, and interactive filters.
Instead of reviewing long tables of raw data, managers can instantly view performance metrics such as revenue trends, booking completion rates, customer satisfaction scores, and safety incidents.
Because the dashboard uses Excel’s pivot tables and charts, users can easily explore different aspects of the tourism business.
For example, businesses can analyze:
-
Which adventure activities generate the highest revenue
-
Which destinations attract the most bookings
-
Which tour packages receive the best customer ratings
-
Which seasons generate the highest demand
-
Which activities have higher safety incidents
As a result, tourism managers can improve planning, optimize pricing strategies, and enhance customer experiences.
Why Do Adventure Tourism Companies Need a Dashboard?
Adventure tourism businesses handle a large amount of operational data every day. They must track bookings from multiple channels, manage seasonal demand, monitor tour guides, and ensure safety compliance.
However, without a structured dashboard, decision-making becomes difficult.
Here are some common challenges tourism businesses face:
-
Difficulty tracking bookings across seasons
-
Lack of visibility into top performing destinations
-
No clear measurement of customer satisfaction
-
Difficulty monitoring tour package performance
-
Limited insights into safety incidents
-
Lack of centralized reporting
Because of these challenges, tourism managers often spend hours compiling reports.
However, a dashboard in Excel solves these problems by providing centralized reporting and real-time insights.
Key Features of the Adventure Tourism Dashboard in Excel
The Adventure Tourism Dashboard in Excel contains multiple analytical pages that help businesses explore tourism performance from different perspectives.
The dashboard includes five interactive analytical pages along with supporting data sheets.
Page Navigator
Click to Purchases Adventure Tourism Dashboard in Excel
The dashboard includes a Page Navigator located on the left side of the dashboard.
This feature allows users to easily switch between different analytical pages without scrolling through multiple worksheets.
As a result, users can quickly access the required insights.
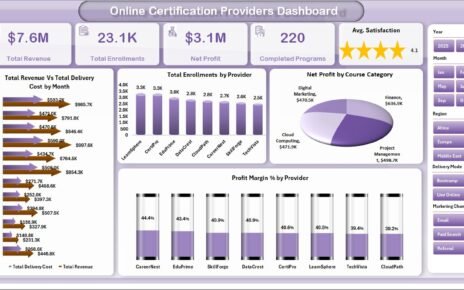
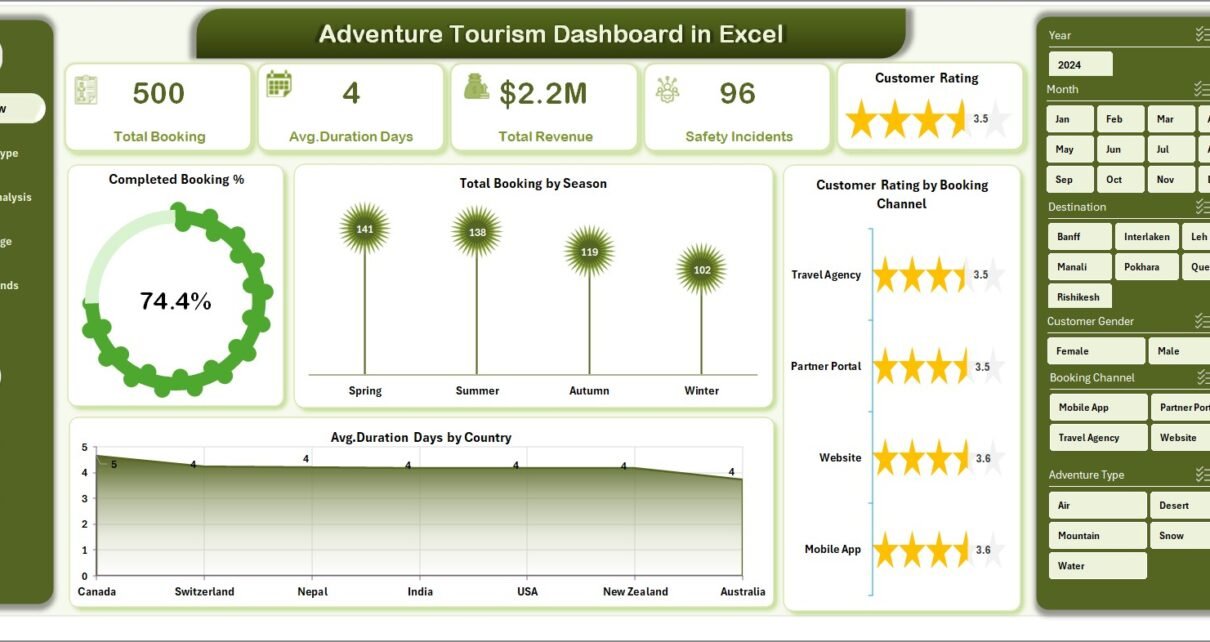
Overview Page
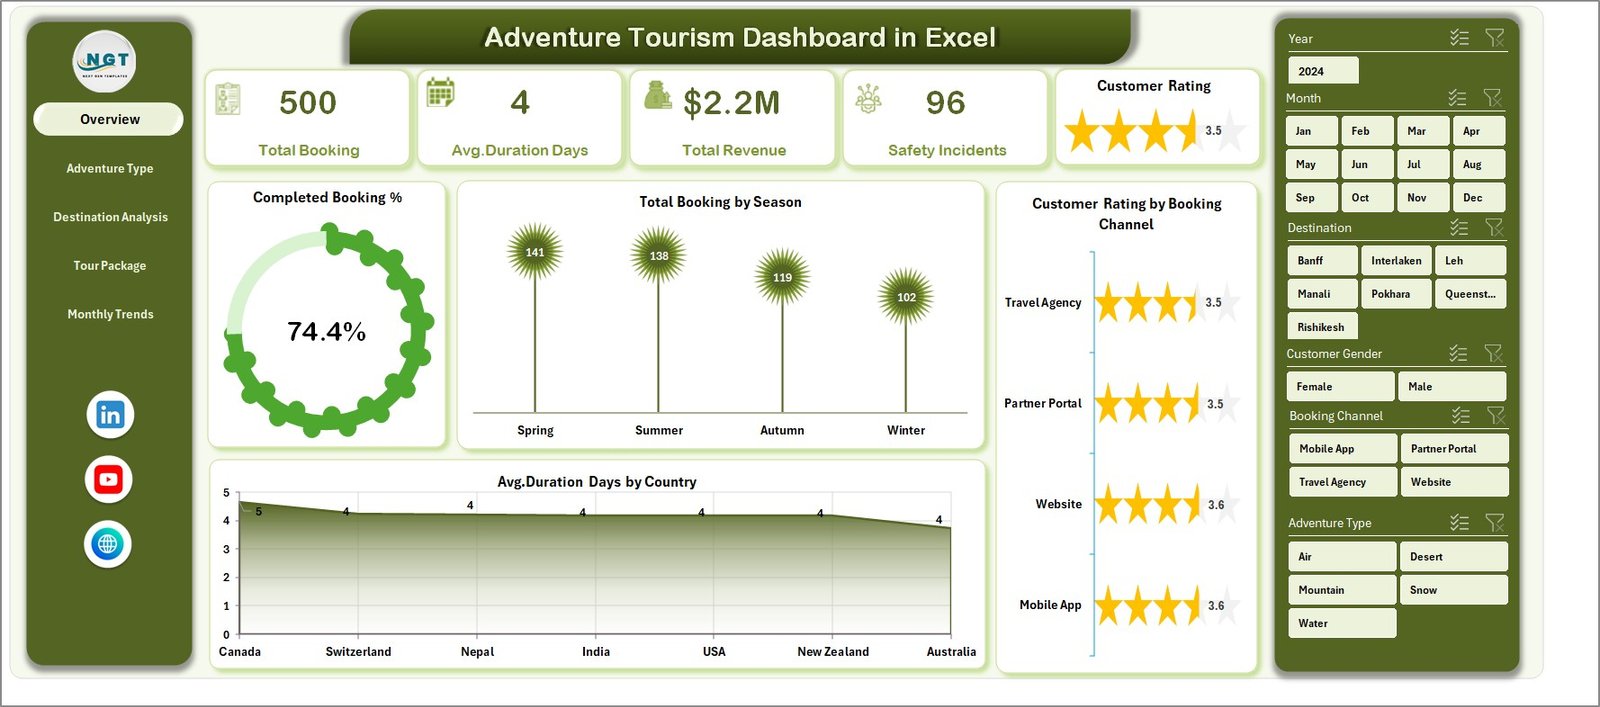
The Overview Page acts as the main dashboard screen where users can see high-level performance indicators of the adventure tourism business.
It provides quick insights into bookings, customer satisfaction, and seasonal trends.
KPI Cards on the Overview Page
The dashboard includes four important KPI cards, such as:
-
Completed Booking %
-
Total Bookings
-
Average Customer Rating
-
Total Revenue
These KPI cards provide a quick snapshot of business performance.
Charts on the Overview Page
The Overview page includes the following analytical charts:
Completed Booking %
This chart shows the percentage of bookings successfully completed compared to total bookings.
Because this metric reflects operational efficiency, tourism managers can easily monitor booking success rates.
Total Booking by Season
Adventure tourism strongly depends on seasonal demand. Therefore, this chart shows booking trends across different seasons.
Businesses can identify peak tourism periods and plan resources accordingly.
Customer Rating by Booking Channel
Tourists often book adventure packages through multiple channels such as websites, travel agents, mobile apps, and online travel platforms.
This chart helps businesses understand which booking channel generates higher customer satisfaction.
Average Duration Days by Country
Adventure tours vary in duration depending on the destination.
This chart shows the average number of days customers spend in adventure trips by country.
As a result, businesses can design better tour packages.
Adventure Type Analysis
Adventure tourism includes multiple activity categories such as trekking, rafting, climbing, skiing, diving, and wildlife adventures.
Therefore, analyzing performance by adventure type becomes essential.
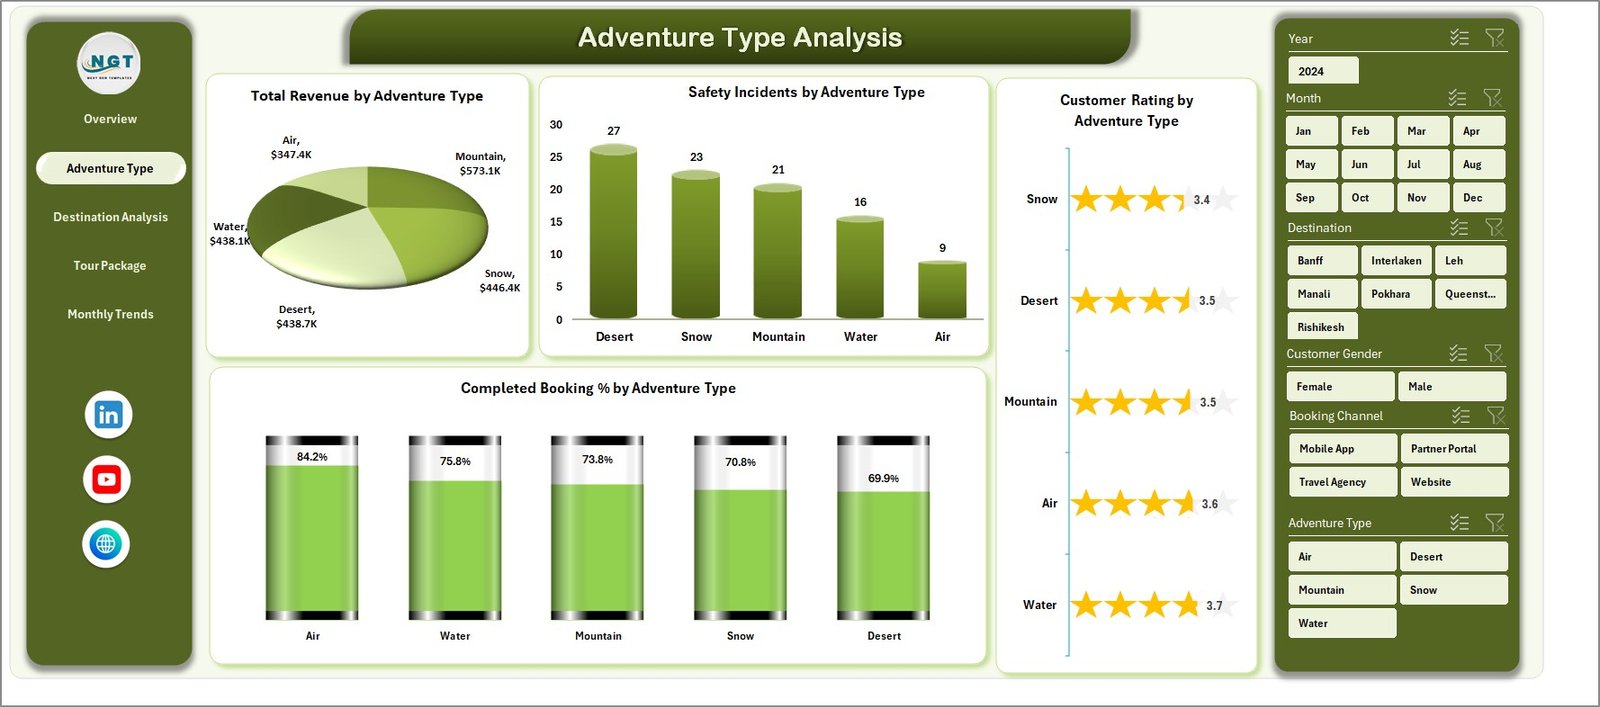
The Adventure Type Analysis page provides insights into how different adventure activities perform.
Charts Included in This Page
Total Revenue by Adventure Type
This chart highlights which adventure activities generate the highest revenue.
Tour operators can easily identify profitable activities.
Safety Incidents by Adventure Type
Adventure tourism involves physical activities. Therefore, safety monitoring becomes extremely important.
This chart helps businesses track safety incidents for each activity.
Customer Rating by Adventure Type
Customer satisfaction plays a crucial role in tourism success.
This chart shows how customers rate different adventure activities.
Click to Purchases Adventure Tourism Dashboard in Excel
Completed Booking % by Adventure Type
This chart helps businesses understand which adventure activities have higher booking completion rates.
Destination Analysis
Tourists travel to different destinations for adventure experiences. Some locations attract more visitors due to natural landscapes, climate, or popularity.
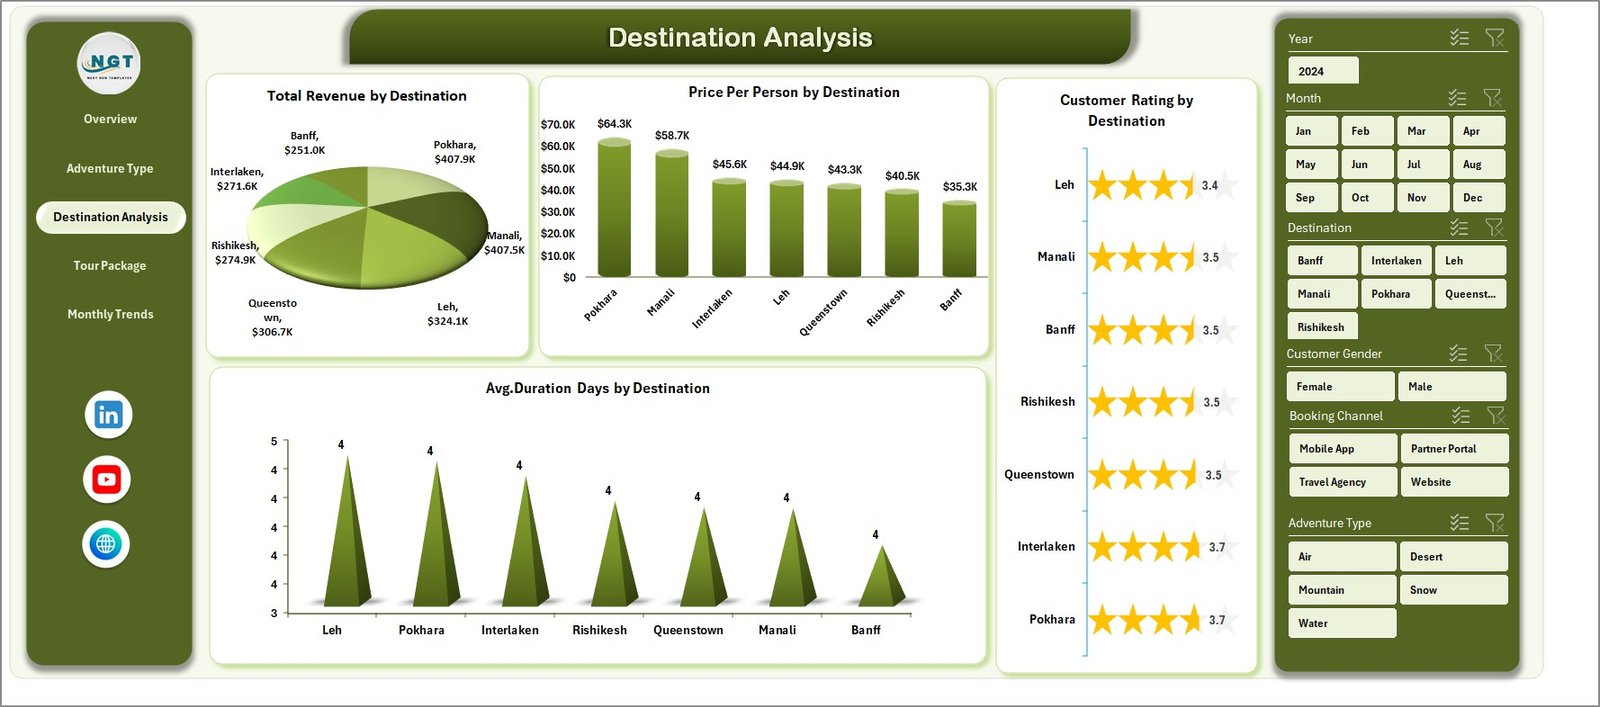
The Destination Analysis page helps tourism businesses understand destination performance.
Charts in Destination Analysis
Total Revenue by Destination
This chart shows which destinations generate the highest tourism revenue.
Managers can use this insight to prioritize marketing efforts.
Price Per Person by Destination
Adventure tourism packages often vary in price depending on the destination.
This chart helps compare pricing trends across destinations.
Customer Rating by Destination
Tourism success depends heavily on customer experience.
This chart shows how customers rate different destinations.
Average Duration Days by Destination
Different destinations require different trip durations.
This chart helps understand how long customers stay at each destination.
Tour Package Analysis
Tour companies offer multiple tour packages that combine activities, accommodations, and guides.
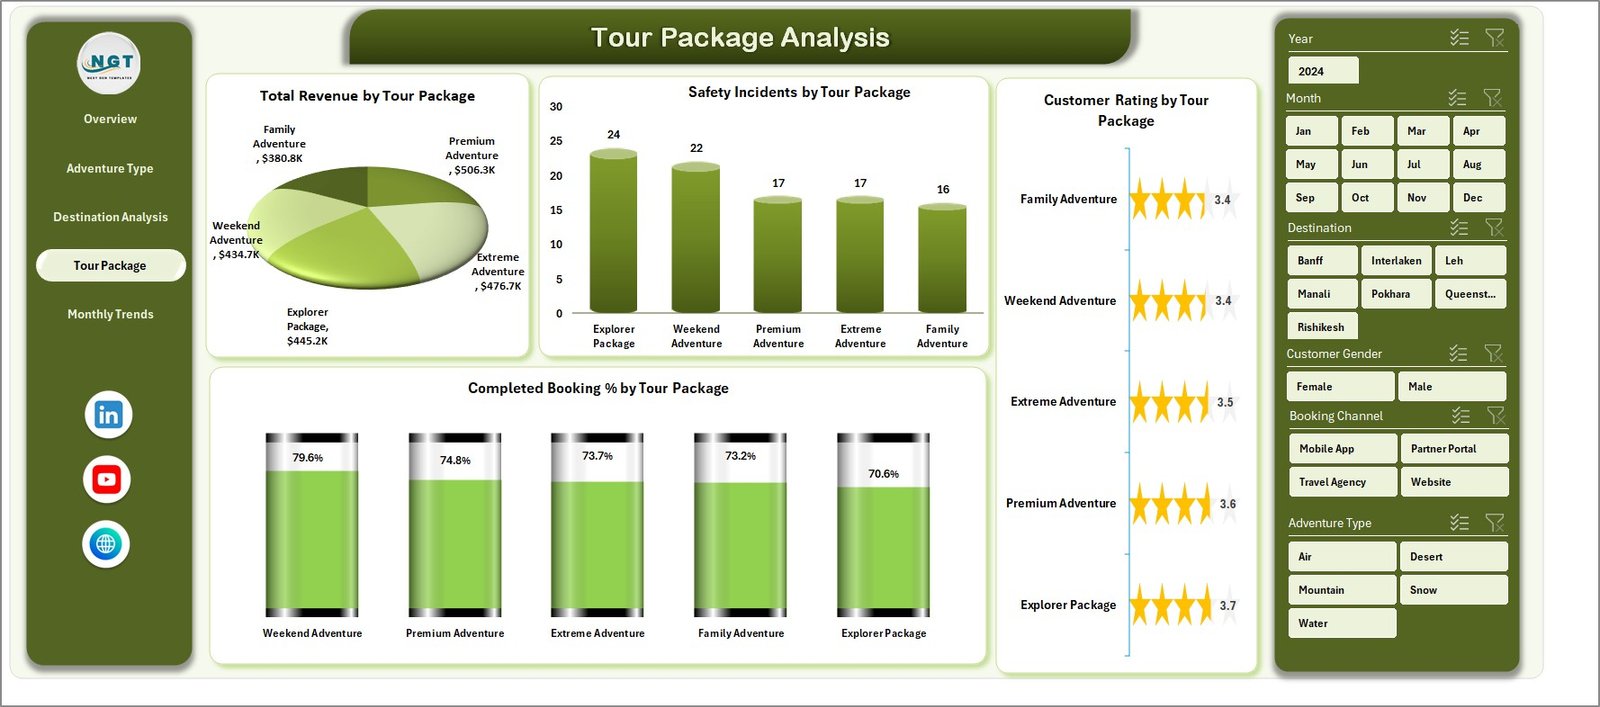
The Tour Package Analysis page evaluates the performance of these packages.
Charts Included
Total Revenue by Tour Package
This chart identifies the highest-earning tour packages.
Tour operators can use this insight to promote successful packages.
Safety Incidents by Tour Package
Safety management becomes critical in adventure tourism.
This chart tracks safety incidents associated with each package.
Customer Rating by Tour Package
Customer feedback helps improve service quality.
This chart shows how customers rate different tour packages.
Completed Booking % by Tour Package
This chart highlights booking completion rates for each package.
Month Analysis
Seasonality plays a major role in tourism. Some months experience higher booking demand than others.
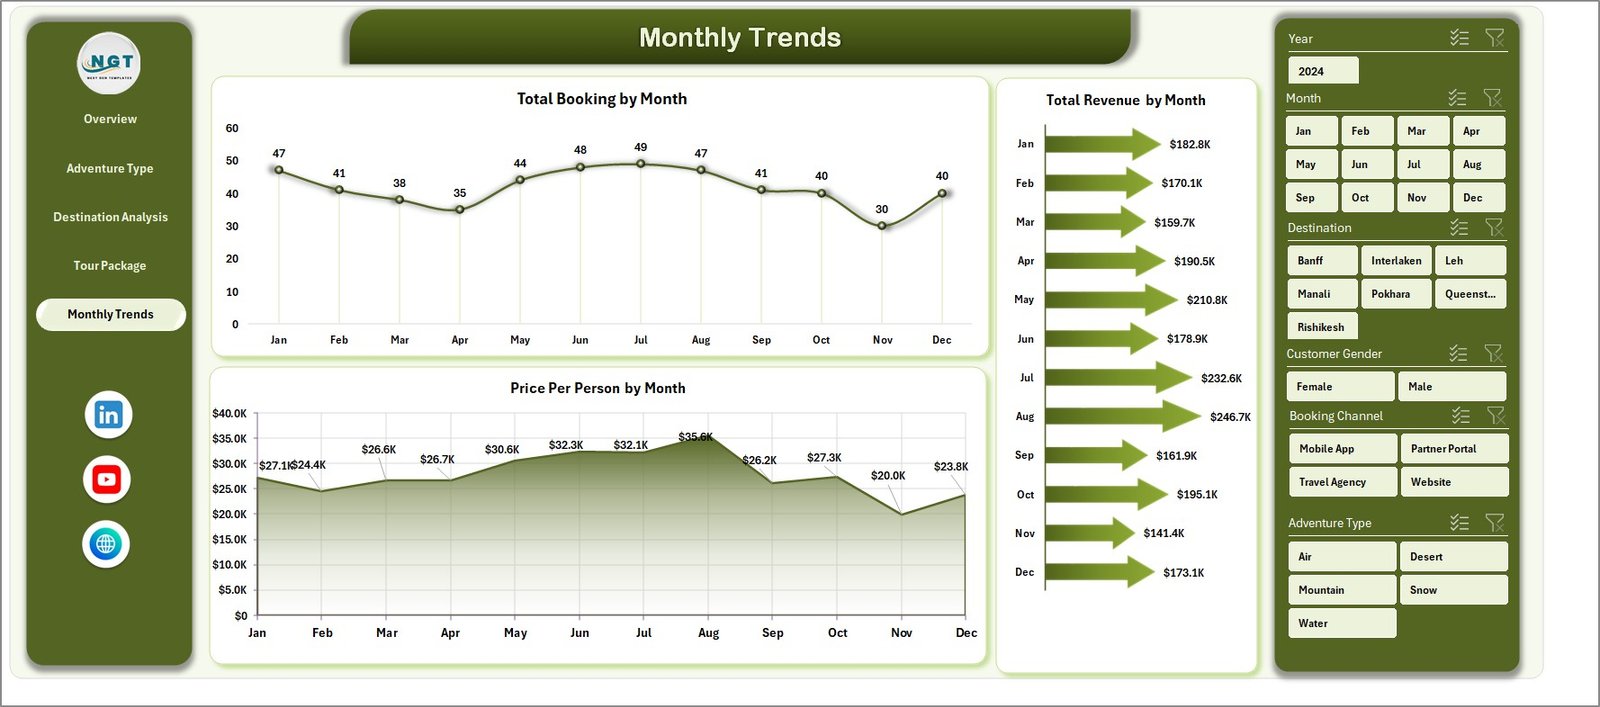
Therefore, the Month Analysis page helps businesses analyze monthly performance.
Charts in Month Analysis
-
Total Revenue by Month
-
Total Bookings by Month
-
Price Per Person by Month
These charts help tourism businesses understand:
-
Monthly demand fluctuations
-
Revenue trends throughout the year
-
Seasonal pricing patterns
As a result, companies can optimize marketing campaigns and pricing strategies.
Support Sheet
Click to Purchases Adventure Tourism Dashboard in Excel
The dashboard also includes a Support Sheet that stores helper calculations, pivot tables, and intermediate formulas.
This sheet supports the visualizations used in the dashboard.
Users normally do not need to modify this sheet unless they want to change formulas or pivot logic.
Data Sheet
The Data Sheet acts as the main data repository of the dashboard.
Users can enter or import data related to:
-
Bookings
-
Tour packages
-
Destinations
-
Customer ratings
-
Revenue
-
Safety incidents
Once users update the data sheet, the dashboard automatically refreshes the charts and KPIs.
Advantages of the Adventure Tourism Dashboard in Excel
The Adventure Tourism Dashboard in Excel offers several advantages for tourism businesses.
Centralized Performance Monitoring
The dashboard collects all important tourism metrics in one place.
Managers no longer need to review multiple reports.
Better Decision Making
Because the dashboard provides visual insights, businesses can make faster and smarter decisions.
Improved Customer Experience
Customer ratings analysis helps businesses identify service gaps.
As a result, companies can improve customer satisfaction.
Revenue Optimization
The dashboard highlights top-performing destinations and packages.
Therefore, businesses can focus on profitable offerings.
Safety Monitoring
Adventure tourism involves physical activities.
Therefore, tracking safety incidents helps businesses improve safety standards.
Time Saving
Instead of manually creating reports, businesses can view automated charts instantly.
Best Practices for the Adventure Tourism Dashboard in Excel
To get the best results from the dashboard, tourism businesses should follow several best practices.
Maintain Accurate Data
Always enter accurate booking and revenue data.
Incorrect data leads to misleading insights.
Update Data Regularly
Businesses should update booking and rating data frequently.
Regular updates ensure the dashboard reflects current performance.
Monitor Customer Feedback
Customer ratings provide valuable insights.
Companies should regularly review feedback and improve services.
Track Safety Metrics Carefully
Safety incidents must be documented properly.
Therefore, companies can improve risk management strategies.
Use Insights for Strategic Planning
Managers should analyze trends and use insights to plan marketing campaigns and tour offerings.
Opportunities for Improvement
Although the Adventure Tourism Dashboard in Excel provides powerful insights, businesses can further enhance it.
Integration with Booking Systems
Companies can integrate the dashboard with booking software for automatic data updates.
Mobile Reporting
Managers can create mobile-friendly dashboards for quick access during field operations.
Predictive Analytics
Businesses can use historical data to forecast tourism demand.
Advanced Visualization
Power BI integration can further enhance data visualization.
Who Can Use the Adventure Tourism Dashboard?
Click to Purchases Adventure Tourism Dashboard in Excel
Many organizations within the tourism industry can benefit from this dashboard.
Tour Operators
Tour operators can monitor bookings, revenue, and customer satisfaction.
Travel Agencies
Travel agencies can track package performance and customer feedback.
Adventure Activity Providers
Companies offering trekking, rafting, climbing, or diving tours can monitor safety and customer experience.
Tourism Management Companies
Large tourism organizations can monitor multiple destinations and packages.
Conclusion
Adventure tourism continues to grow rapidly as travelers seek thrilling experiences and unique destinations. However, managing tourism operations requires careful monitoring of bookings, revenue, safety, and customer satisfaction.
The Adventure Tourism Dashboard in Excel provides a powerful solution for tourism businesses. It organizes complex tourism data into clear visual insights that help managers understand performance trends quickly.
Because the dashboard includes multiple analytical pages such as Overview, Adventure Type Analysis, Destination Analysis, Tour Package Analysis, and Month Analysis, businesses gain a complete view of their tourism operations.
As a result, tourism managers can make smarter decisions, improve customer experiences, increase revenue, and enhance safety management.
Frequently Asked Questions (FAQs)
What is an Adventure Tourism Dashboard in Excel?
An Adventure Tourism Dashboard in Excel is a data visualization tool that helps tourism businesses monitor bookings, revenue, customer satisfaction, and safety metrics.
Why should tourism companies use dashboards?
Dashboards provide centralized reporting and visual insights. Therefore, managers can quickly understand performance trends and make better decisions.
What type of data is used in the dashboard?
The dashboard uses data related to bookings, destinations, tour packages, customer ratings, revenue, and safety incidents.
Can beginners use this dashboard?
Yes. Because the dashboard uses Excel pivot tables and charts, beginners can easily update data and view insights.
Can the dashboard be customized?
Yes. Businesses can customize charts, KPIs, and filters based on their specific tourism operations.
How often should the dashboard be updated?
Companies should update the dashboard regularly, preferably daily or weekly, depending on booking volume.
Visit our YouTube channel to learn step-by-step video tutorials