Introduction
The Executive Coaching KPI Dashboard is a powerful, ready-to-use template designed specifically for tracking and managing outsourced accounting KPIs. This dashboard helps executives and managers monitor key performance indicators (KPIs) effectively, offering a comprehensive view of performance metrics in real-time. By integrating actionable insights, trend analysis, and easy data input, this dashboard empowers strategic decision-making and continuous improvement.
Click to Purchases Executive Coaching KPI Dashboard in Excel
Key Features of Executive Coaching KPI Dashboard
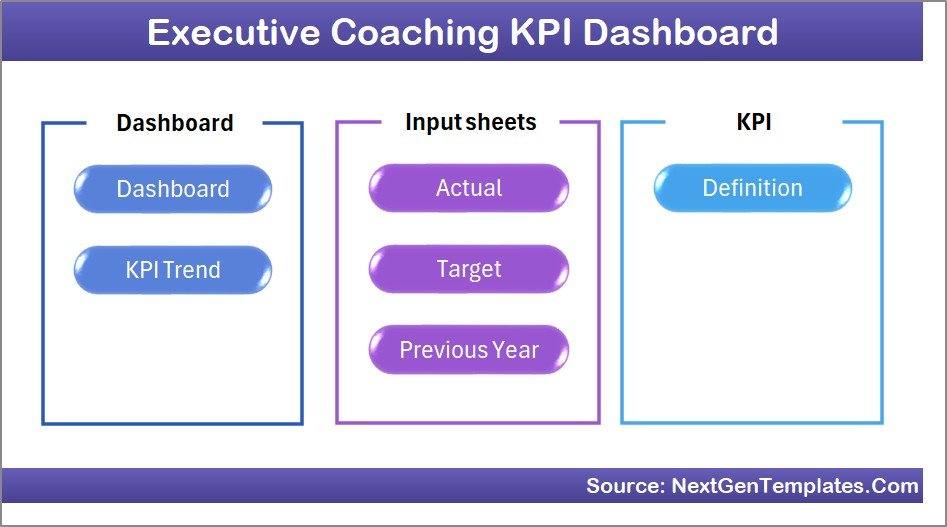
- Seven interactive worksheets designed to cover all aspects of KPI monitoring.
- Dynamic month selection to view monthly and year-to-date (YTD) results.
- Visualization of actuals, targets, previous year data, and comparative performance with conditional formatting.
- KPI trend tracking with insightful charts showing MTD and YTD patterns.
- Easy data entry sheets for Actual, Target, and Previous Year numbers.
- Comprehensive KPI definitions with formulas and performance types.
- Navigation buttons on the Home sheet for quick access to other sections.
Dashboard Pages Explanation
1. Home Sheet
The Home sheet serves as the central index of the dashboard. It features six intuitive buttons, each linking directly to a corresponding worksheet for fast navigation. This layout ensures users can easily access the relevant sections without hassle.
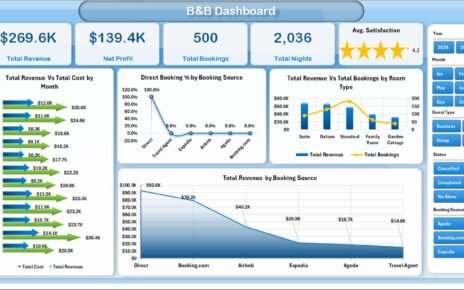
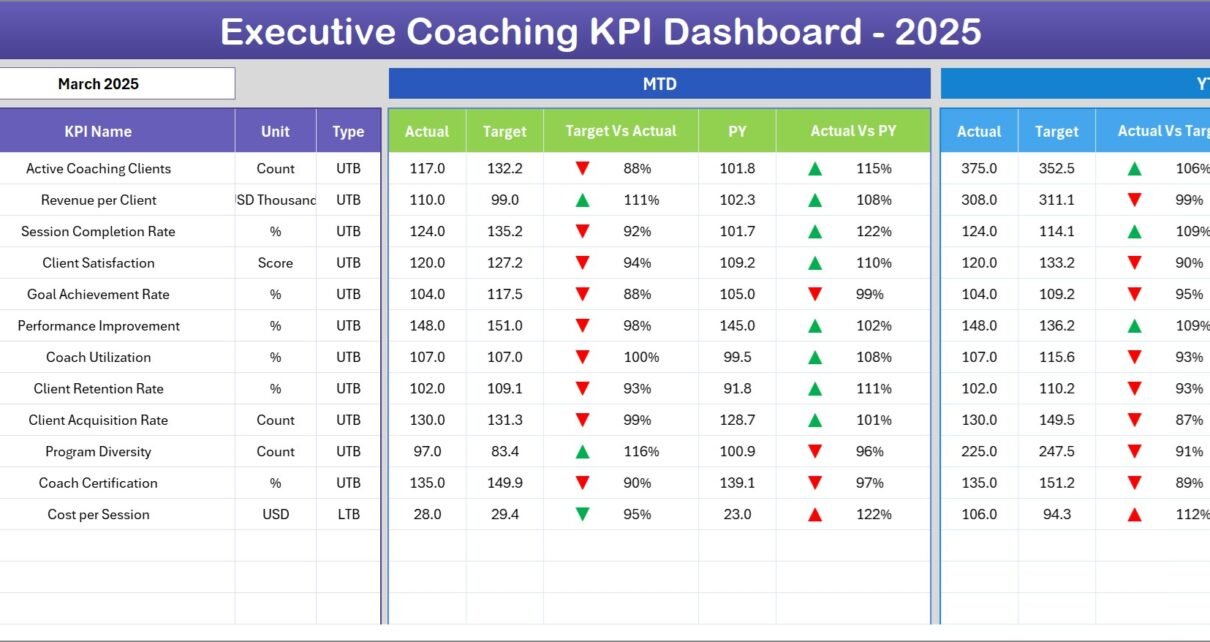
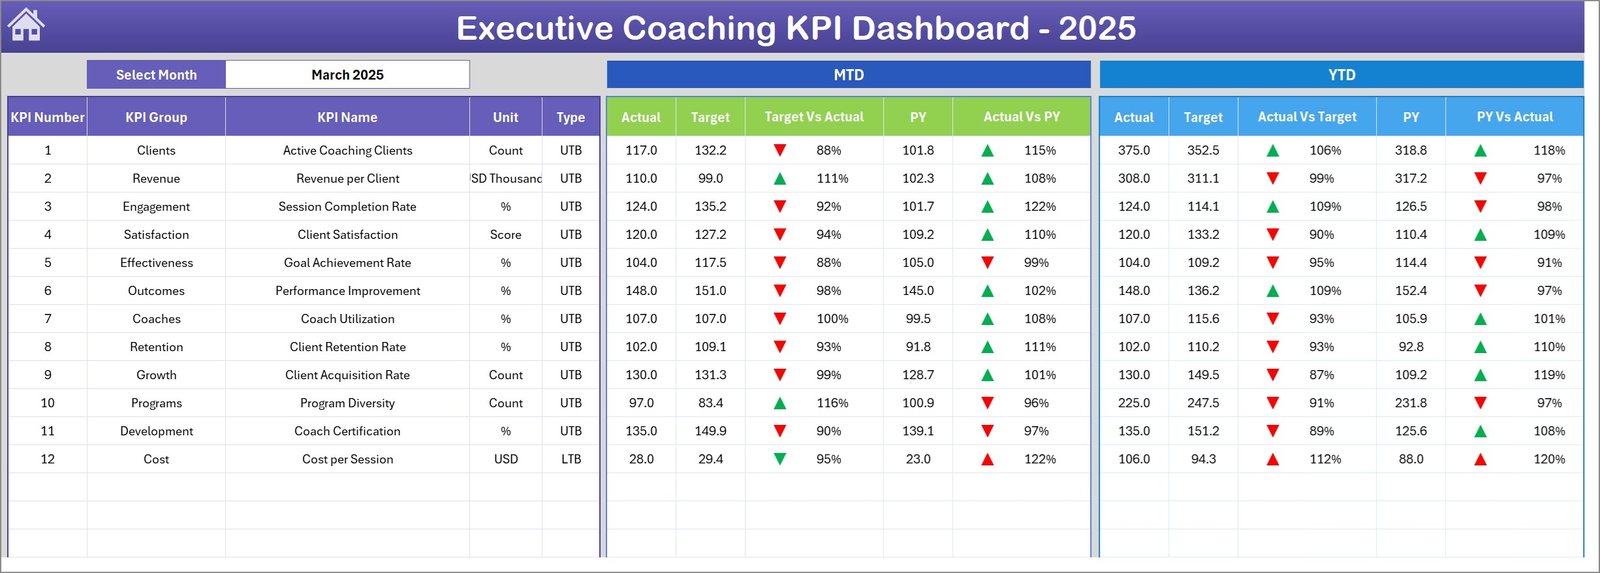
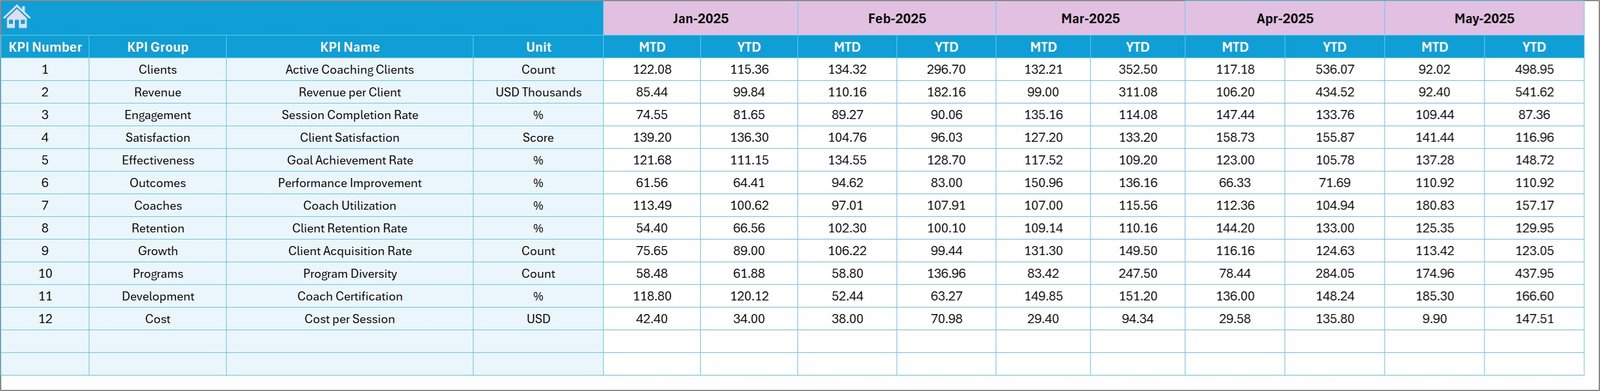
2. Dashboard Sheet
This is the heart of the KPI Dashboard, displaying all KPIs’ data at a glance. Users can select the month using a drop-down menu at cell D3, instantly updating the dashboard numbers.
- Shows Month-To-Date (MTD) Actual, Target, Previous Year values.
- Provides Target vs Actual and Previous Year (PY) vs Actual comparisons.
- Includes Year-To-Date (YTD) Actual, Target, PY values along with comparative conditional formatting using up/down arrows for quick performance identification.
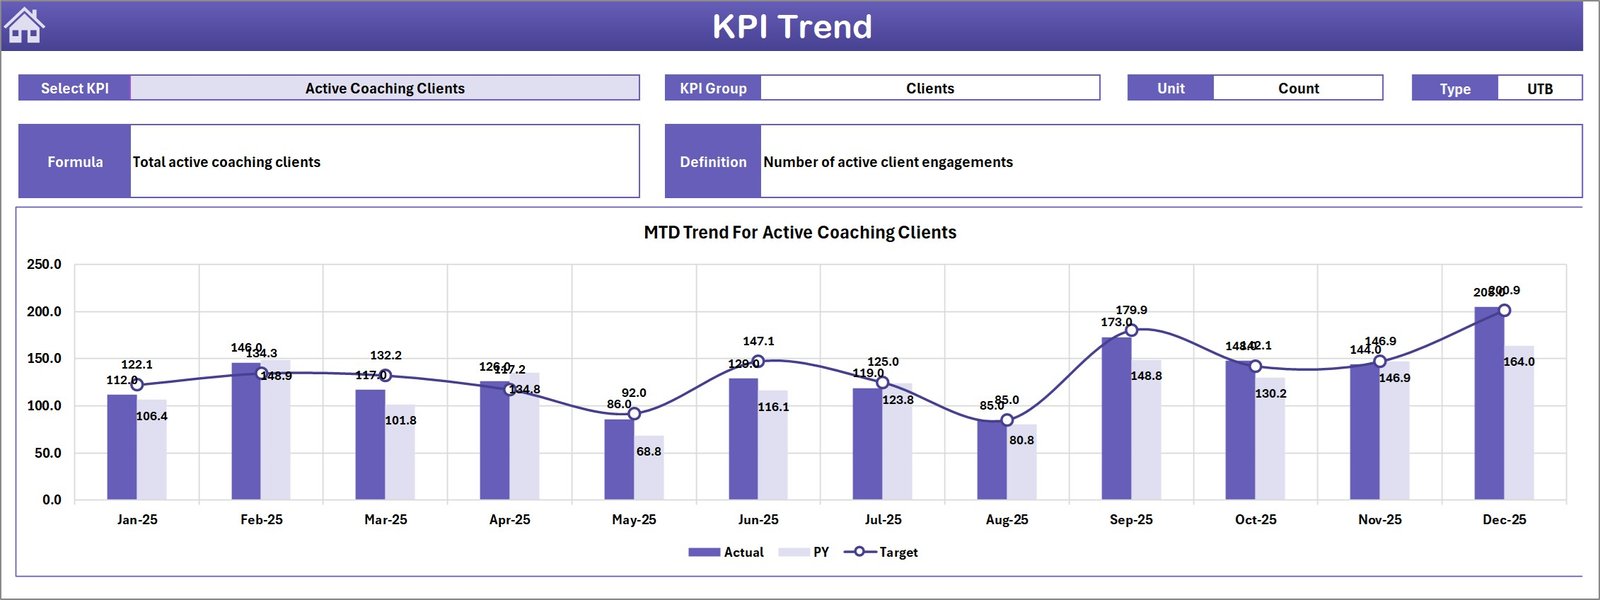
3. KPI Trend Sheet
This sheet allows KPI-specific deep dives. Users can select any KPI from a drop-down located at cell C3 to view detailed information and trends.
- Displays KPI group, unit, formula, and categorization (Lower The Better or Upper The Better).
- Visual trend charts for MTD and YTD actuals, targets, and previous year metrics help identify performance patterns.
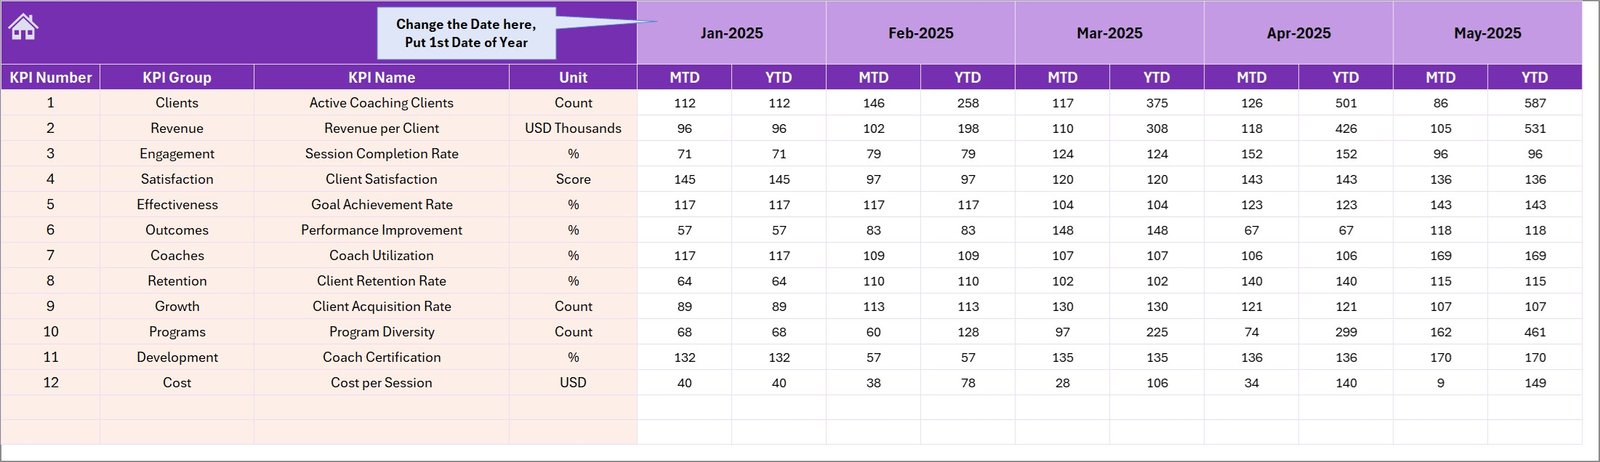
4. Actual Numbers Input Sheet
This is where users input actual performance data for the Year-To-Date (YTD) and Month-To-Date (MTD) values. The month can be adjusted from cell E1 by entering the first month of the year.
5. Target Number Input Sheet
This sheet is dedicated to entering the target numbers for each KPI on both MTD and YTD bases. Maintaining accurate target inputs ensures meaningful variance analysis and performance tracking.
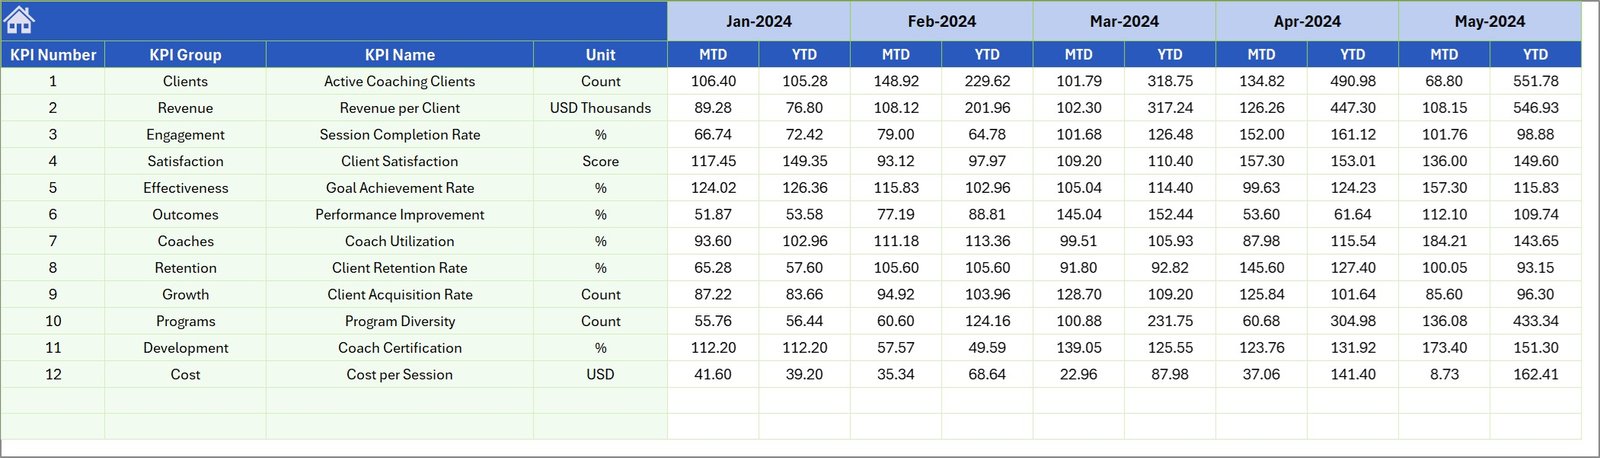
6. Previous Year Number Input Sheet
Users enter the previous year’s data here, mirroring the input format for the current year. This enables year-over-year comparisons and trend analysis essential for strategic insights.
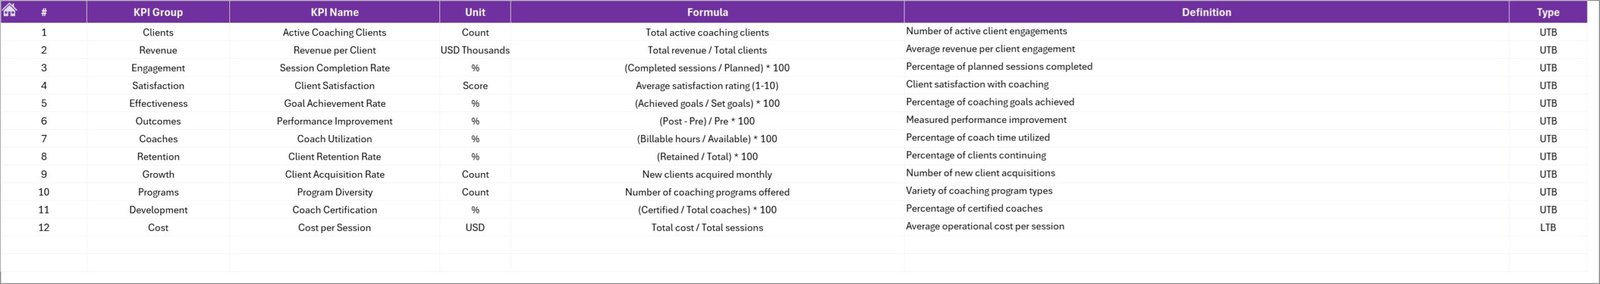
7. KPI Definition Sheet
This reference sheet holds comprehensive details for each KPI, including:
- KPI Name
- KPI Group
- Unit of Measurement
- Calculation Formula
- KPI Definition
- KPI Type: LTB (Lower The Better) or UTB (Upper The Better)
This sheet serves as a vital guide to understand how each KPI impacts overall performance.
Advantages of Executive Coaching KPI Dashboard
- Time Saving: Ready-to-use format with intuitive navigation saves hours of manual reporting.
- Accuracy: Centralized data input reduces errors and improves data integrity.
- Insightful Visuals: Conditional formatting and trend charts make performance easy to analyze.
- Flexibility: Users can tailor the dashboard by selecting different months and KPIs.
- Comprehensive Tracking: Multiple sheets cover actuals, targets, past data, and KPI definitions, providing a full performance picture.
Opportunities for Improvement
- Integrate automated data linking from accounting systems to reduce manual input.
- Add advanced alert mechanisms such as email notifications for KPI deviations.
- Incorporate benchmarking data against industry standards for better context.
- Enhance mobile responsiveness and access for remote stakeholders.
Best Practices
- Regularly update actual and target data to maintain dashboard reliability.
- Review KPI definitions periodically to ensure alignment with business objectives.
- Use the trend analysis sheet to identify performance drivers and bottlenecks.
- Train stakeholders in navigating and interpreting dashboard elements effectively.
- Leverage dashboard insights in executive coaching sessions to drive accountability.
FAQs
Can I customize this KPI Dashboard for my organization?
Yes, the template is designed to be adaptable. You can modify KPIs, formulas, and data inputs according to your organization’s requirements.
Is the dashboard compatible with Microsoft Excel?
Absolutely. It is built specifically for Microsoft Excel with features like drop-downs, conditional formatting, and charts.
How do I update the month selection to view different data?
Simply select the desired month from the drop-down menu located at cell D3 on the Dashboard sheet to refresh all KPI numbers accordingly.
Can this dashboard handle multiple years for trends?
Currently, it focuses on the current year and previous year data but can be expanded to include multiple years with additional customization.
Click to Purchases Executive Coaching KPI Dashboard in Excel
Conclusion
The Executive Coaching KPI Dashboard is an essential tool for outsourced accounting professionals, executives, and coaches looking to streamline performance tracking and decision-making. It offers an intuitive interface, comprehensive data coverage, and insightful visuals to monitor KPIs effectively. By implementing this dashboard, organizations can drive better accountability, identify improvement areas early, and align performance metrics with strategic goals.
For further learning and visual walkthroughs, visit our YouTube channel to watch the demo.
For more advanced Excel capabilities and best practices, visit the official Microsoft Excel Help & Learning page.