Corruption remains one of the biggest challenges faced by governments, regulatory agencies, and investigative organizations around the world. Fraud, bribery, misuse of public funds, and unethical practices can severely damage financial systems and public trust.
Therefore, organizations must track corruption cases, monitor investigations, and measure financial recovery efficiently.
However, when investigators store corruption data across multiple spreadsheets, analyzing performance becomes difficult. Decision-makers cannot easily track the number of cases, financial impact, recovery amounts, or investigation efficiency.
To solve this problem, we created the Anti-Corruption Units Dashboard in Excel — a powerful and ready-to-use analytics solution that helps agencies monitor corruption cases, analyze investigation performance, and track financial recovery using interactive Excel dashboards.
Moreover, this dashboard transforms complex investigation data into simple visual insights. As a result, investigators, compliance teams, and policy makers can quickly identify corruption patterns and improve transparency.
In this article, we will explore the Anti-Corruption Units Dashboard in Excel, its structure, features, advantages, best practices, and frequently asked questions.
Click to buy Anti-Corruption Units Dashboard in Excel
What Is an Anti-Corruption Units Dashboard in Excel?
An Anti-Corruption Units Dashboard in Excel is a data visualization and monitoring tool designed to help organizations track corruption cases, analyze investigation performance, and measure financial recovery.
Instead of reviewing long investigation reports, decision-makers can instantly view:
- Total corruption cases
- Financial impact caused by corruption
- Amount of funds recovered
- Resolution rate of cases
- Investigation performance by team
- Regional corruption trends
Because Excel dashboards combine charts, KPIs, and interactive filters, users can easily monitor corruption activities across departments, regions, and time periods.
As a result, investigative agencies can make faster and more informed decisions.
Why Do Organizations Need an Anti-Corruption Dashboard?
Many investigative departments collect large volumes of corruption data. However, raw data alone cannot provide meaningful insights.
Therefore, organizations need a centralized dashboard that can:
- Track corruption cases across regions
- Monitor investigation progress
- Measure financial recovery
- Identify high-risk corruption categories
- Evaluate investigator performance
Consequently, leaders can strengthen anti-corruption strategies and allocate resources more effectively.
Key Features of the Anti-Corruption Units Dashboard in Excel
This ready-to-use Excel dashboard contains multiple analytical sheet tabs designed to monitor corruption cases from different perspectives.
The dashboard includes the following sheets:
- Overview
- Corruption Analysis
- Regional Trends
- Investigation Performance
- Monthly Trends
Each sheet provides valuable insights for anti-corruption units.
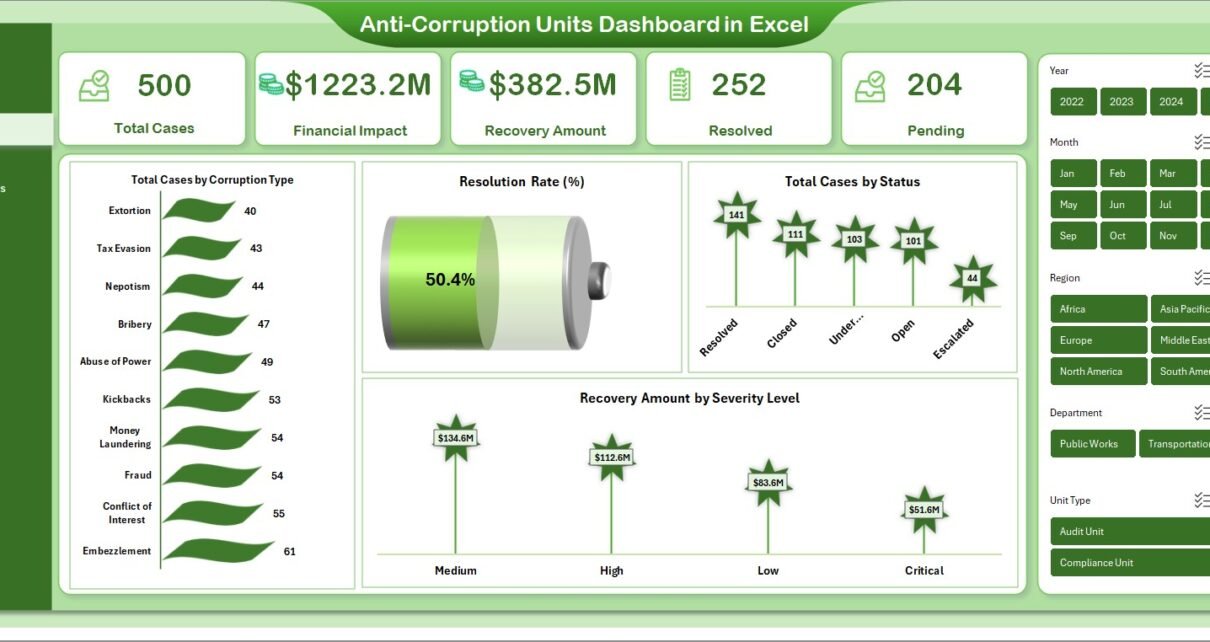
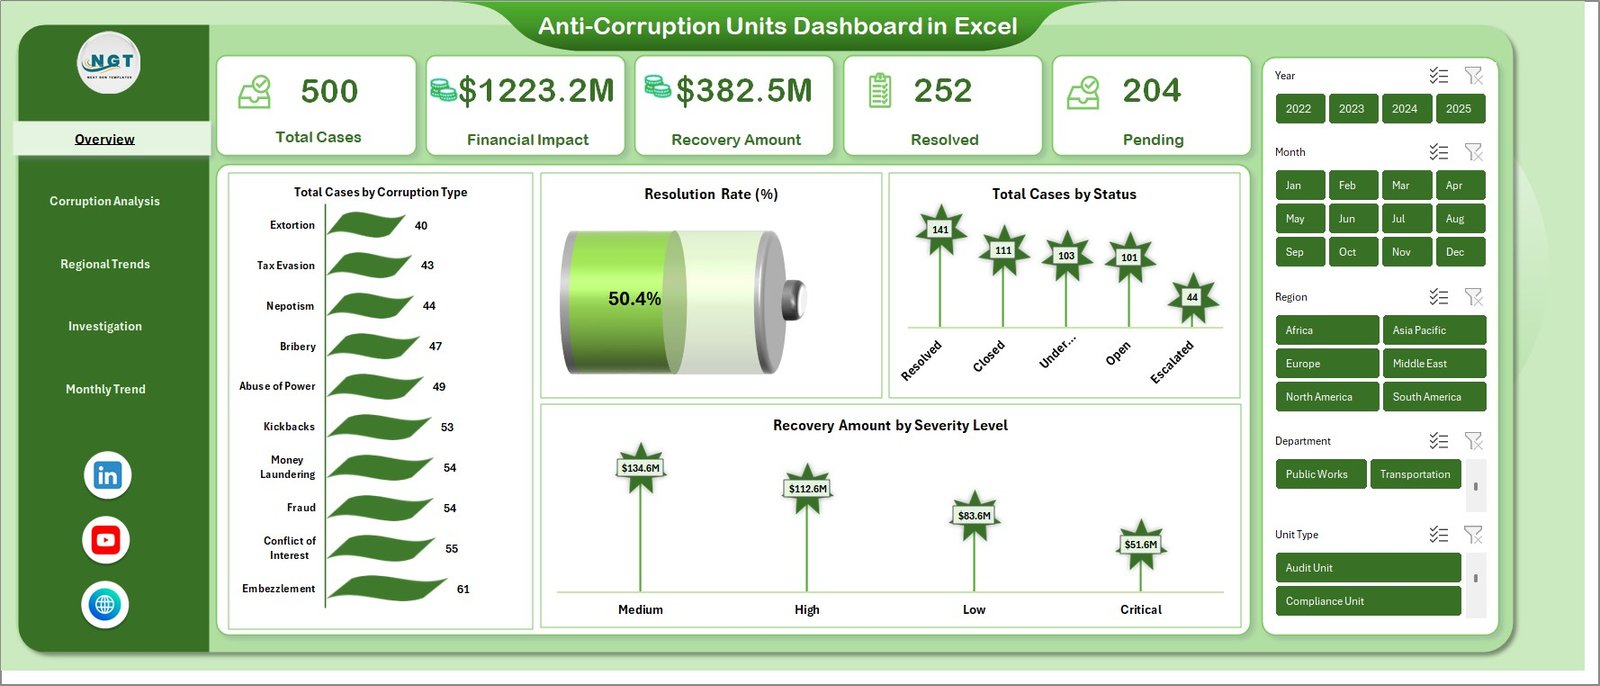
Overview Sheet Tab
The Overview sheet acts as the main control center of the dashboard. It provides a high-level summary of corruption investigations and financial impact.
Key KPI Metrics
The overview page displays the following key indicators:
- Total Cases – Total corruption cases registered
- Financial Impact – Total financial loss caused by corruption
- Recovery Amount – Total funds recovered through investigations
- Resolved Cases – Cases successfully closed
- Pending Cases – Investigations still in progress
These KPIs allow investigators to quickly understand the current anti-corruption status.
Key Charts in Overview
The overview page also includes several analytical charts:
- Total Cases by Corruption Type
- Resolution Rate (%)
- Total Cases by Status
- Recovery Amount by Severity Level
Because these charts update automatically, users can easily monitor corruption patterns and case progress.
Click to buy Anti-Corruption Units Dashboard in Excel
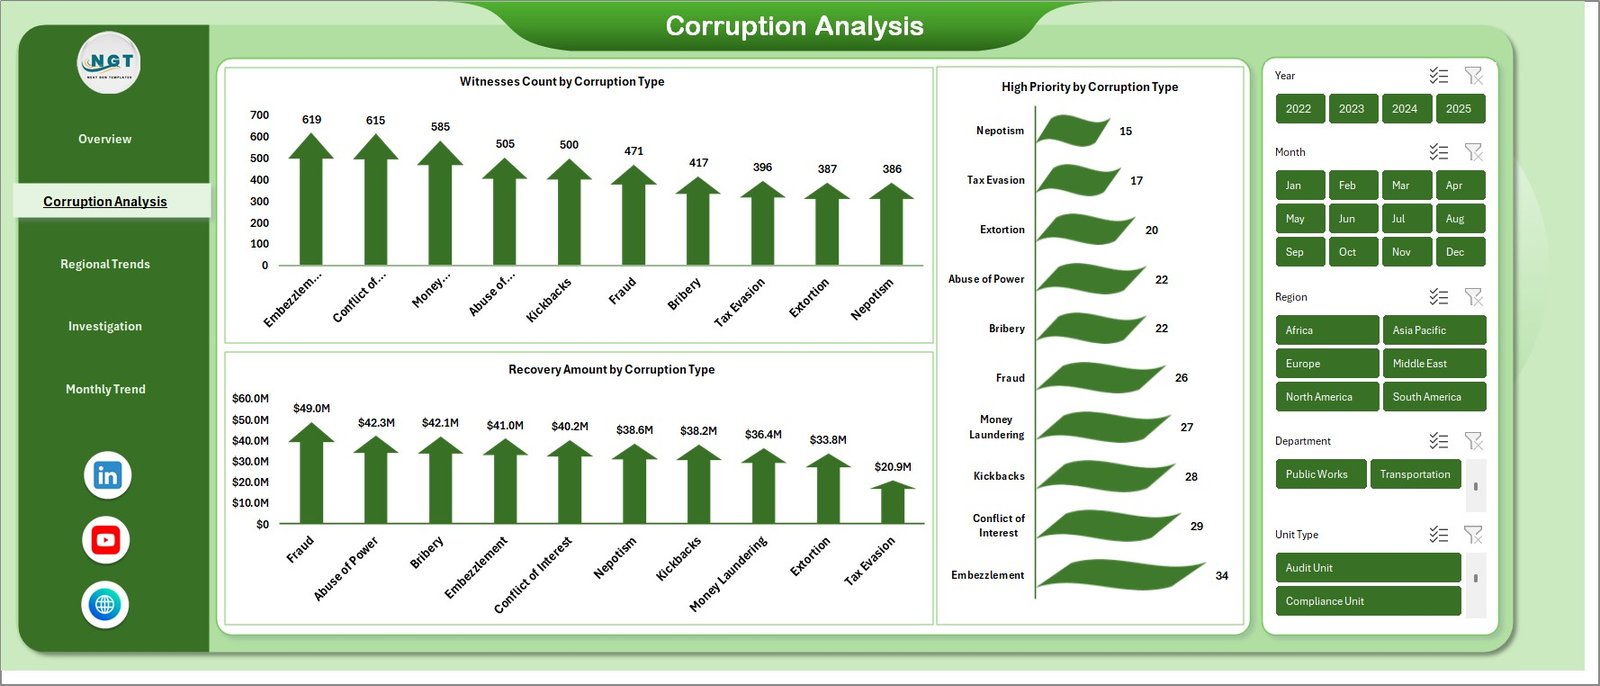
Corruption Analysis Sheet
The Corruption Analysis sheet focuses on different types of corruption cases and their investigation details.
Key Insights Provided
This sheet contains the following analytical charts:
- Witnesses Count by Corruption Type
- High Priority Cases by Corruption Type
- Recovery Amount by Corruption Type
Therefore, investigators can easily identify which corruption categories cause the most damage and require immediate attention.
Click to buy Anti-Corruption Units Dashboard in Excel
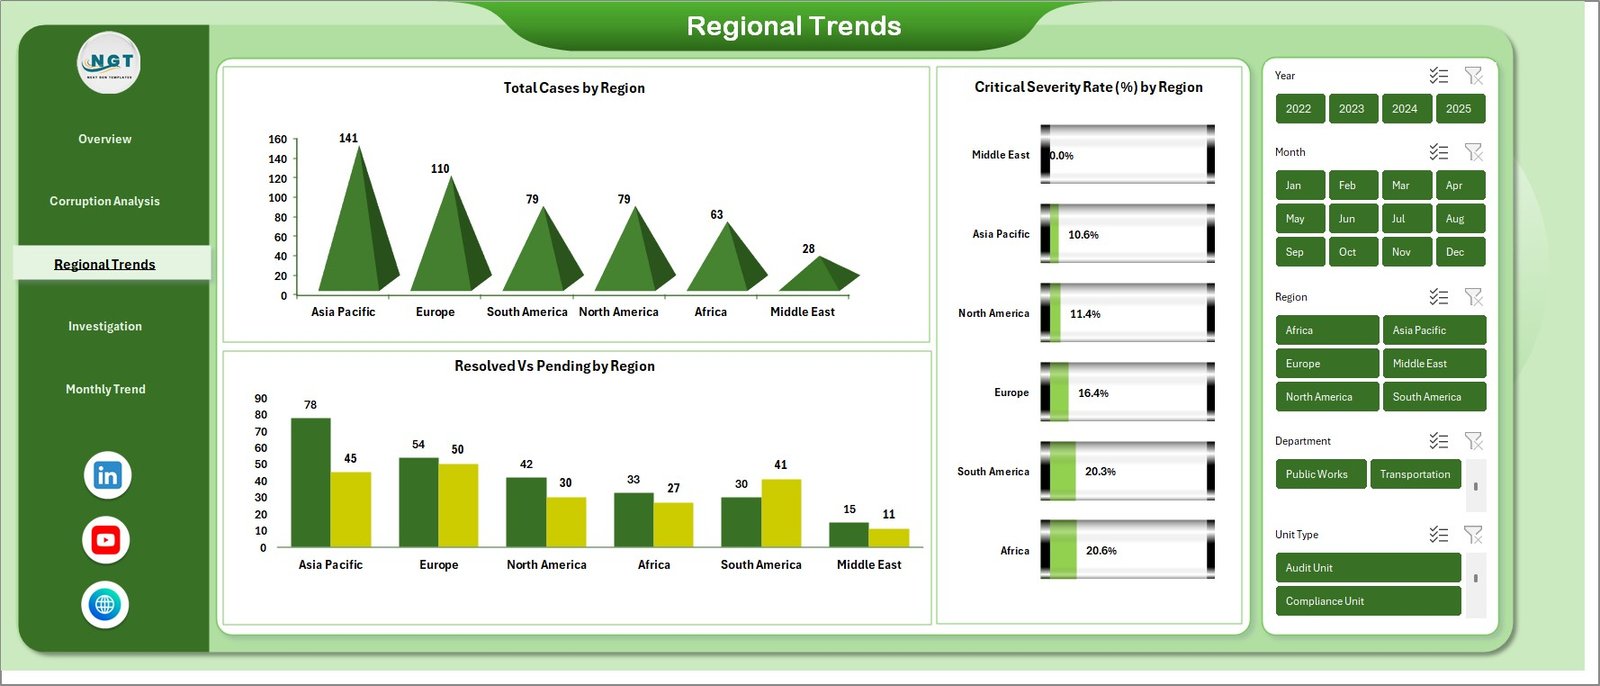
Regional Trends Sheet
Corruption patterns often vary across regions. Therefore, this sheet analyzes corruption activity geographically.
Key Charts in Regional Trends
- Total Cases by Region
- Resolved vs Pending Cases by Region
- Critical Severity Rate (%) by Region
As a result, decision-makers can quickly identify high-risk regions and allocate investigation resources accordingly.
Click to buy Anti-Corruption Units Dashboard in Excel
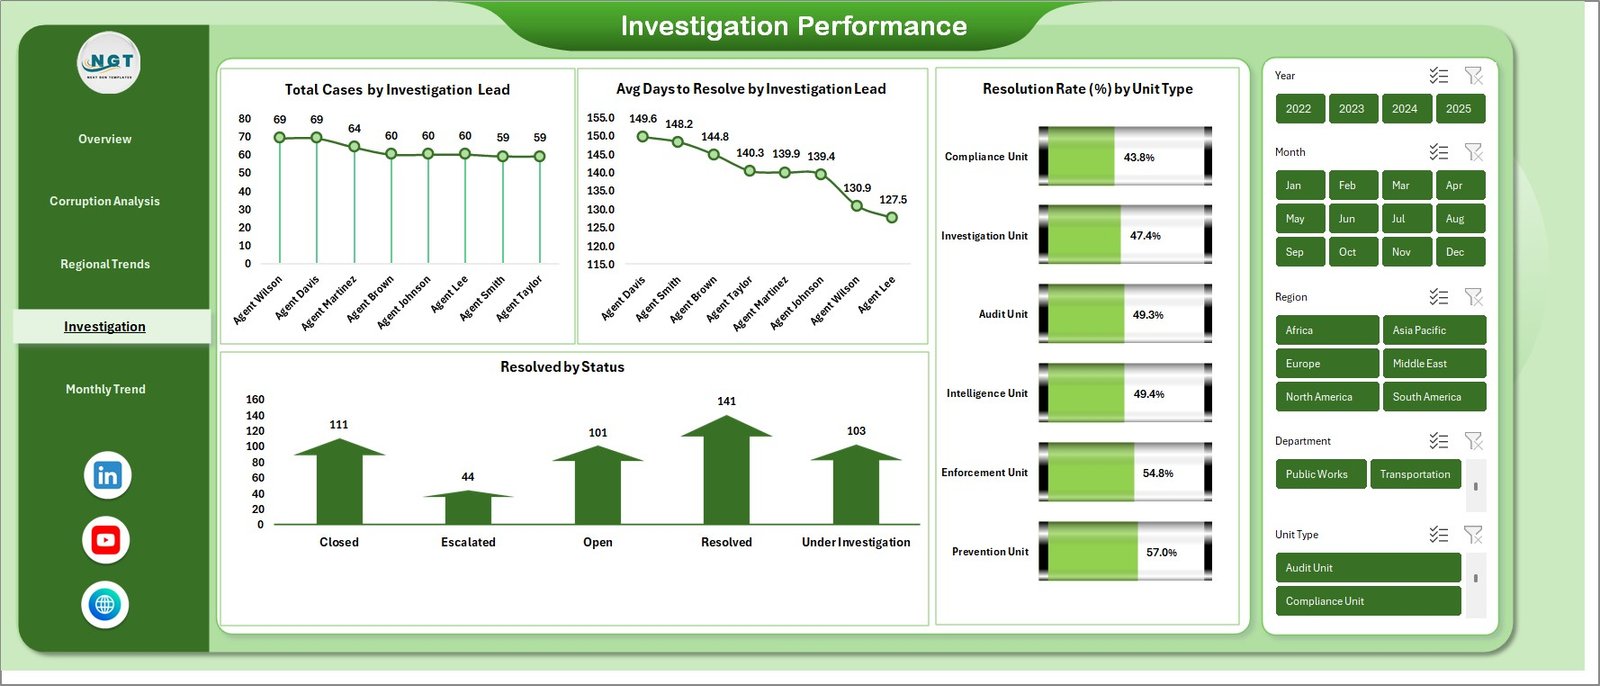
Investigation Performance Sheet
The Investigation Performance sheet evaluates the effectiveness of investigators and units handling corruption cases.
Key Metrics in This Sheet
- Total Cases by Investigation Lead
- Average Days to Resolve Cases
- Resolved Cases by Status
- Resolution Rate (%) by Unit Type
Because these metrics measure investigation efficiency, organizations can improve team performance and accountability.
Click to buy Anti-Corruption Units Dashboard in Excel
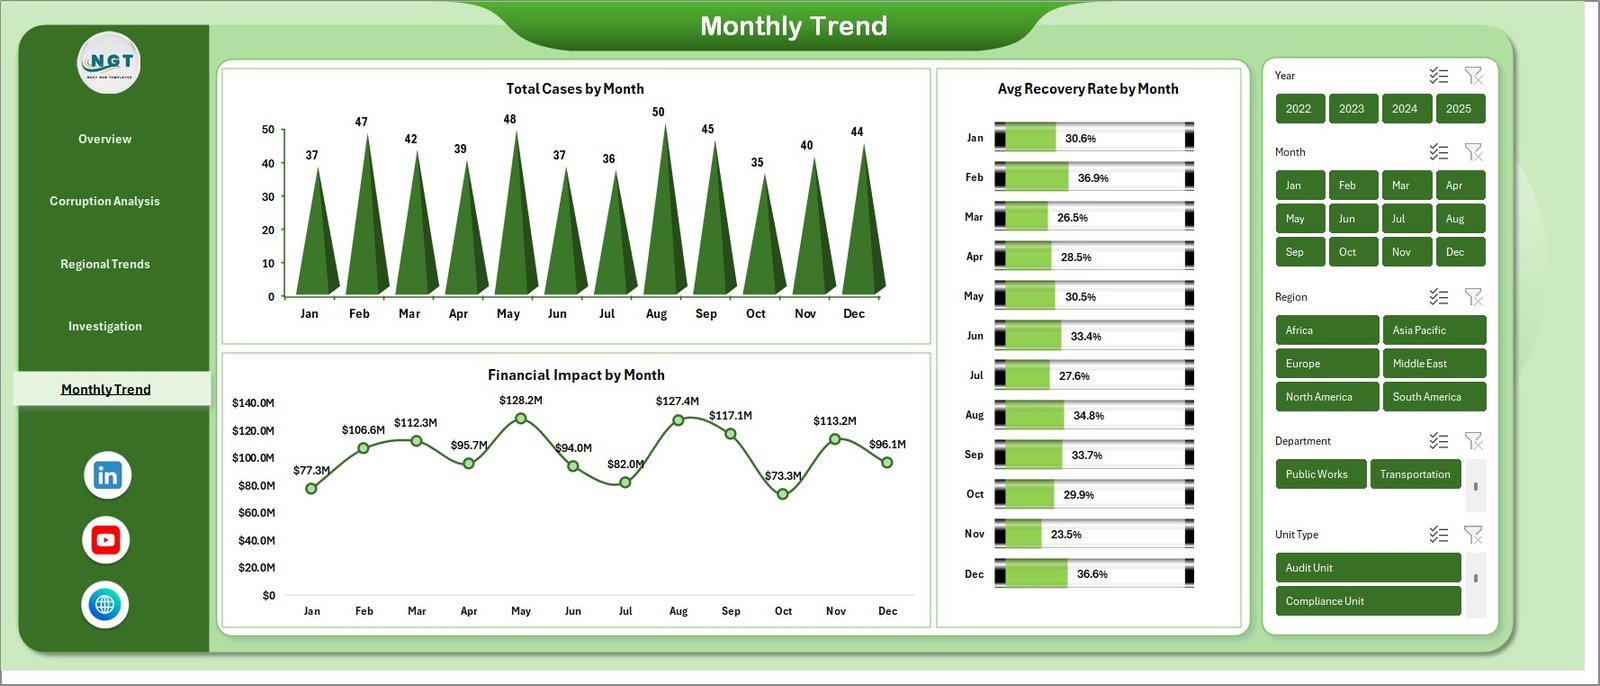
Monthly Trends Sheet
Monitoring corruption data over time helps agencies detect patterns and evaluate the effectiveness of anti-corruption strategies.
Charts Included in Monthly Trends
- Total Cases by Month
- Financial Impact by Month
- Average Recovery Rate by Month
Click to buy Anti-Corruption Units Dashboard in Excel
Therefore, investigators can track whether corruption activities increase or decrease during specific time periods.
Advantages of the Anti-Corruption Units Dashboard in Excel
Organizations gain many benefits when they use a structured anti-corruption dashboard.
- Improves Transparency
The dashboard clearly shows corruption cases, financial losses, and recovery amounts. Therefore, organizations can promote transparency and accountability.
- Enhances Decision Making
Interactive charts allow leaders to quickly analyze investigation data. Consequently, they can make faster and more accurate decisions.
- Monitors Investigation Performance
Managers can track investigator productivity, resolution time, and case outcomes.
- Identifies High-Risk Corruption Areas
The dashboard highlights corruption trends by type and region. Therefore, agencies can focus on high-risk areas.
- Tracks Financial Recovery
The dashboard shows recovered funds and financial losses. As a result, organizations can measure investigation success.
Best Practices for Using the Anti-Corruption Units Dashboard in Excel
To get the best results from this dashboard, organizations should follow several best practices.
Maintain Accurate Data
Always record investigation data carefully. Accurate data ensures reliable analysis.
Update the Dashboard Regularly
Update case records frequently so the dashboard reflects the latest investigation progress.
Use Standard Corruption Categories
Define clear corruption types such as bribery, fraud, embezzlement, and procurement manipulation.
Monitor High-Priority Cases
Track critical cases closely and allocate investigation resources accordingly.
Review Performance Metrics
Regularly analyze investigator performance metrics to improve investigation efficiency.
How Does This Dashboard Improve Anti-Corruption Management?
The Anti-Corruption Units Dashboard in Excel provides a centralized system for monitoring corruption investigations.
Because investigators can view all key metrics in one place, they can:
- Track corruption trends
- Improve case resolution efficiency
- Monitor financial recovery
- Identify corruption hotspots
- Strengthen governance and accountability
Therefore, organizations can build a more effective anti-corruption framework.
Conclusion
Corruption investigations involve large volumes of complex data. Without proper analytics tools, organizations struggle to monitor cases, track financial losses, and measure investigation performance.
The Anti-Corruption Units Dashboard in Excel simplifies this process by transforming raw investigation data into interactive visual insights.
Because the dashboard tracks corruption cases, financial impact, regional patterns, and investigator performance, decision-makers can quickly identify problems and take action.
As a result, organizations can strengthen transparency, improve investigation efficiency, and recover financial losses more effectively.
Frequently Asked Questions (FAQs)
What is an Anti-Corruption Units Dashboard in Excel?
It is an Excel-based dashboard that tracks corruption cases, financial losses, recovery amounts, and investigation performance using charts and KPI indicators.
Who can use this dashboard?
Many organizations can benefit from this dashboard, including:
- Government anti-corruption agencies
- Compliance departments
- Financial regulators
- Internal audit teams
- Investigation units
What metrics does the dashboard track?
The dashboard tracks several key metrics, including:
- Total corruption cases
- Financial impact
- Recovery amount
- Resolution rate
- Investigation performance
- Regional corruption trends
Can users customize the dashboard?
Yes. Because the dashboard runs in Excel, users can easily customize charts, filters, and categories based on their investigation requirements.
How often should users update the dashboard?
Organizations should update the dashboard regularly, preferably weekly or monthly, so that investigation data remains accurate and useful for decision-making.
Click to buy Anti-Corruption Units Dashboard in Excel
Visit our YouTube channel to learn step-by-step video tutorials
Watch the step-by-step video tutorial: