The short-term rental industry has grown rapidly in recent years. Platforms like Airbnb, Vrbo, and Booking.com allow property owners to rent homes, apartments, and vacation properties to travelers across the world. As a result, property managers, hosts, and rental businesses generate large amounts of booking data every day.
However, managing this data without proper analytics becomes difficult. Hosts must track bookings, analyze revenue, monitor guest ratings, evaluate host performance, and understand seasonal booking trends. When businesses store this information across multiple spreadsheets, decision-makers struggle to gain clear insights.
Click to Purchases Airbnb-style Rentals Dashboard in Power BI
Therefore, data visualization tools like Power BI play an important role in rental business analytics.
The Airbnb-style Rentals Dashboard in Power BI provides a powerful and interactive solution that allows rental managers to track bookings, analyze revenue trends, evaluate host performance, and monitor property profitability in one centralized dashboard.
Moreover, this dashboard transforms complex rental datasets into simple visual insights. As a result, property owners and analysts can quickly identify profitable locations, understand guest behavior, and improve revenue strategies.
In this comprehensive guide, we will explore the Airbnb-style Rentals Dashboard in Power BI, including its features, structure, advantages, and best practices.
What Is an Airbnb-style Rentals Dashboard in Power BI?
An Airbnb-style Rentals Dashboard in Power BI is a data visualization and business intelligence tool designed to analyze short-term rental performance.
This dashboard collects booking and property data and transforms it into interactive charts, KPIs, and visual reports.
Using this dashboard, rental managers can monitor:
-
Booking performance
-
Revenue trends
-
Host productivity
-
Property type profitability
-
Seasonal demand patterns
-
Guest ratings and feedback
Because Power BI connects multiple data sources, users can analyze thousands of booking records quickly. Consequently, managers can make faster and more accurate business decisions.
Why Do Rental Businesses Need an Airbnb Analytics Dashboard?
Short-term rental businesses operate in a highly competitive environment. Property owners must constantly adjust pricing strategies, improve guest experience, and monitor booking performance.
Without a structured analytics system, businesses face several challenges.
For example:
-
Difficulty tracking booking performance
-
Lack of visibility into revenue trends
-
Poor understanding of guest behavior
-
Inefficient property management
-
Limited insights into seasonal demand
However, when businesses implement a Power BI dashboard, they convert raw data into actionable insights.
Therefore, organizations can improve occupancy rates, increase profitability, and optimize property management strategies.
Click to Purchases Airbnb-style Rentals Dashboard in Power BI
Key Features of the Airbnb-style Rentals Dashboard in Power BI
The Airbnb-style Rentals Dashboard in Power BI contains multiple analytical pages designed to provide a complete view of rental performance.
This dashboard includes five interactive pages, each focusing on a different aspect of rental analytics.
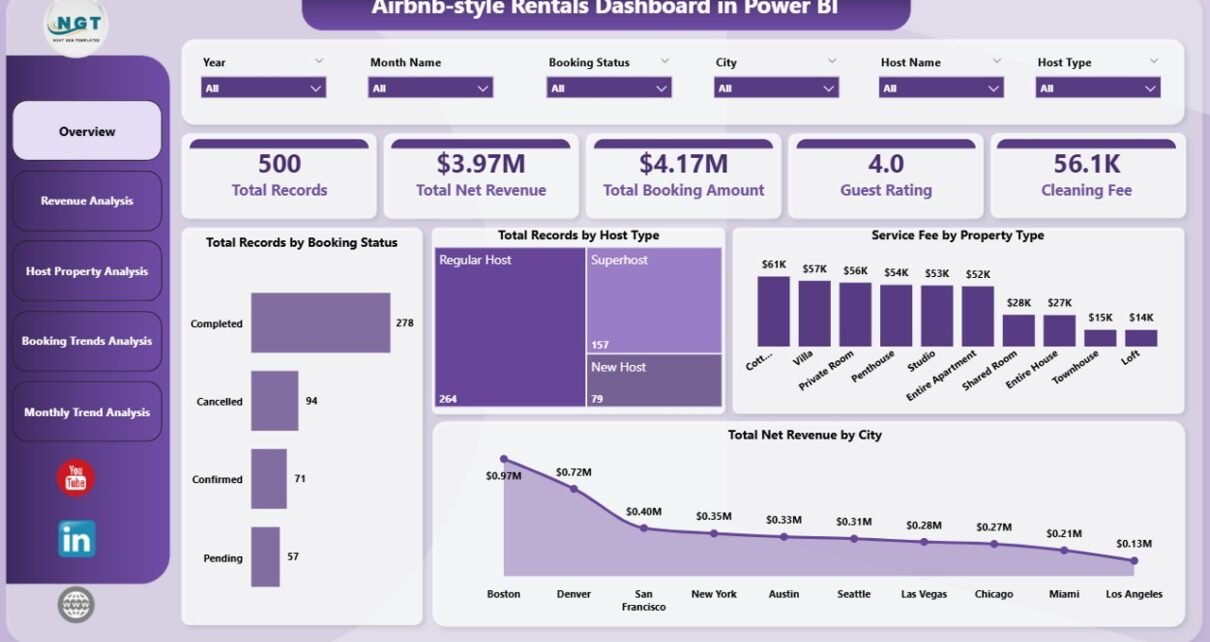
1. Overview Page – What Is the Overall Rental Performance?
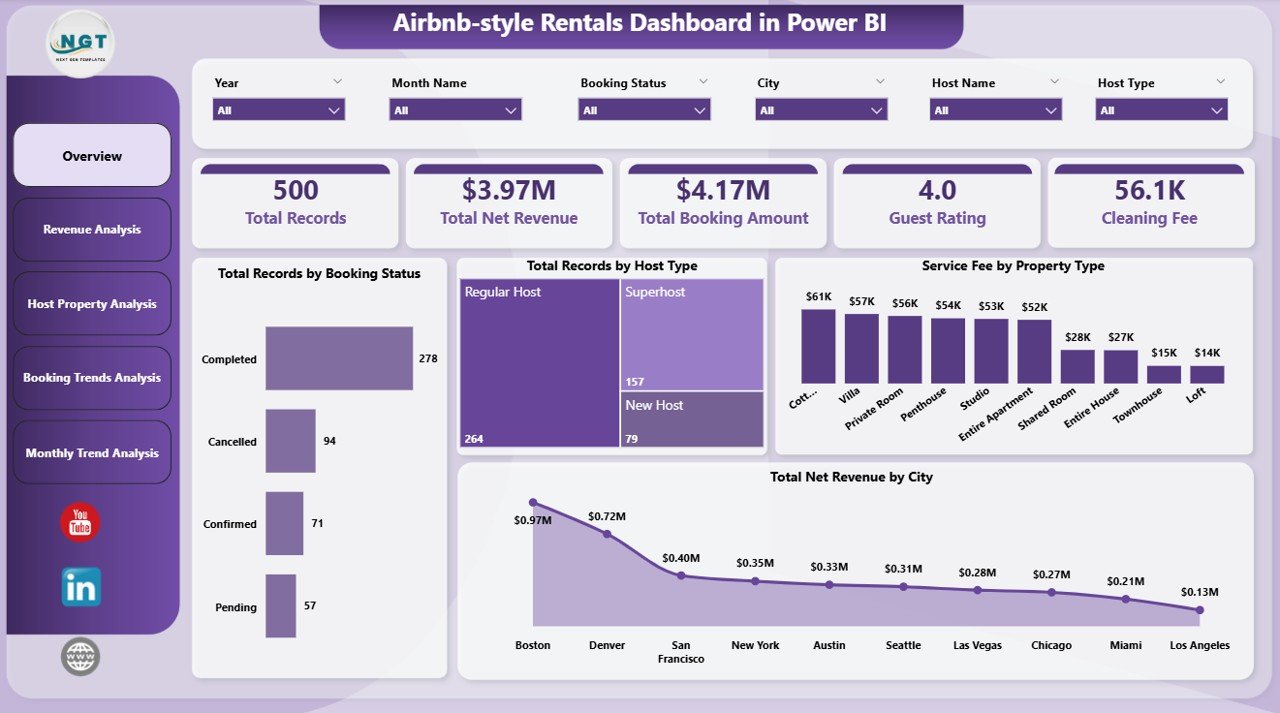
The Overview Page acts as the main summary dashboard. It provides a quick snapshot of key business metrics.
Users can instantly understand booking performance and revenue distribution across cities and property types.
Key KPI Cards
This page includes the following important metrics:
-
Total Records by Booking Status
-
Total Records by Host Type
-
Service Fee by Property Type
-
Total Net Revenue by City
-
Additional key booking indicators
Key Charts
The overview page also includes visual charts that highlight major trends:
-
Booking distribution by status
-
Host type analysis
-
Service fee breakdown by property type
-
Revenue distribution by city
Because these charts update dynamically, users can filter data using slicers and instantly view insights.
2. Revenue Analysis – How Does Revenue Vary Across Bookings?
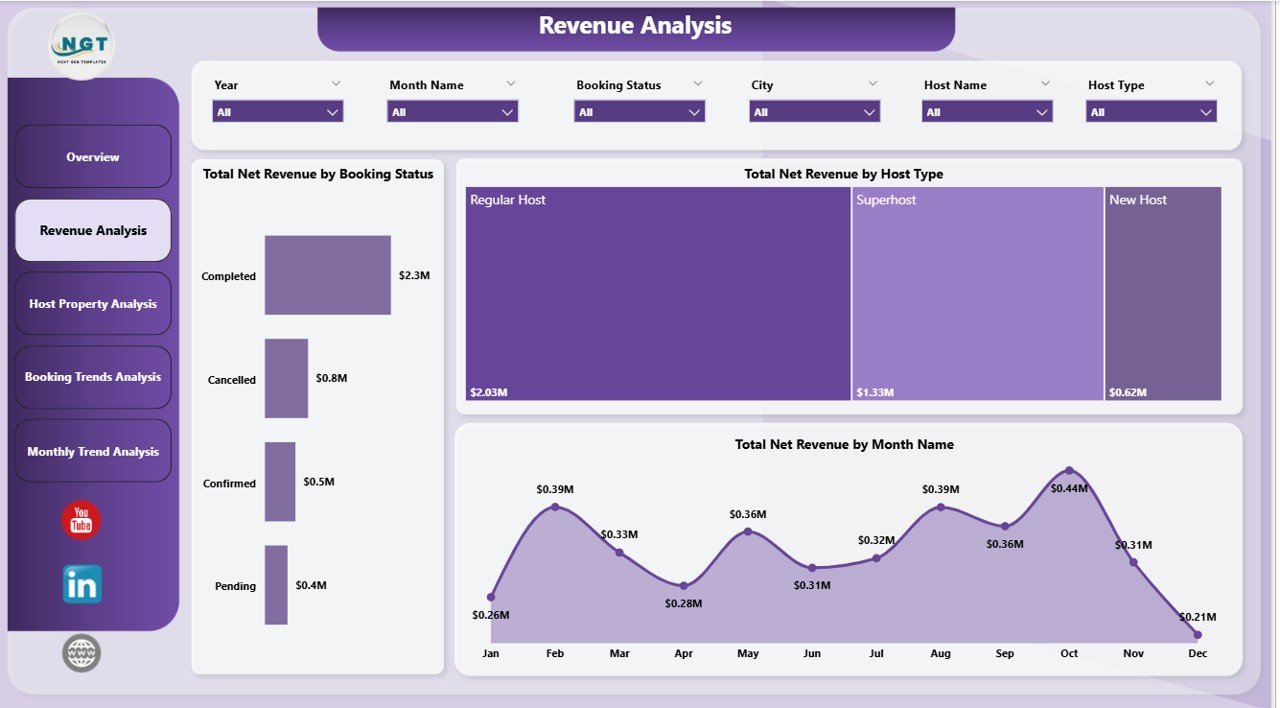
The Revenue Analysis Page focuses on rental income and revenue patterns.
Managers use this page to analyze how different booking categories contribute to overall revenue.
Key Charts in Revenue Analysis
-
Total Net Revenue by Booking Status
-
Total Net Revenue by Host Type
-
Total Net Revenue by Month Name
Insights Provided
This page helps businesses understand:
-
Which booking statuses generate the highest revenue
-
How host types impact revenue generation
-
Seasonal revenue fluctuations
Therefore, managers can identify profitable months and adjust pricing strategies accordingly.
3. Host Property Analysis – Which Hosts and Properties Perform Best?
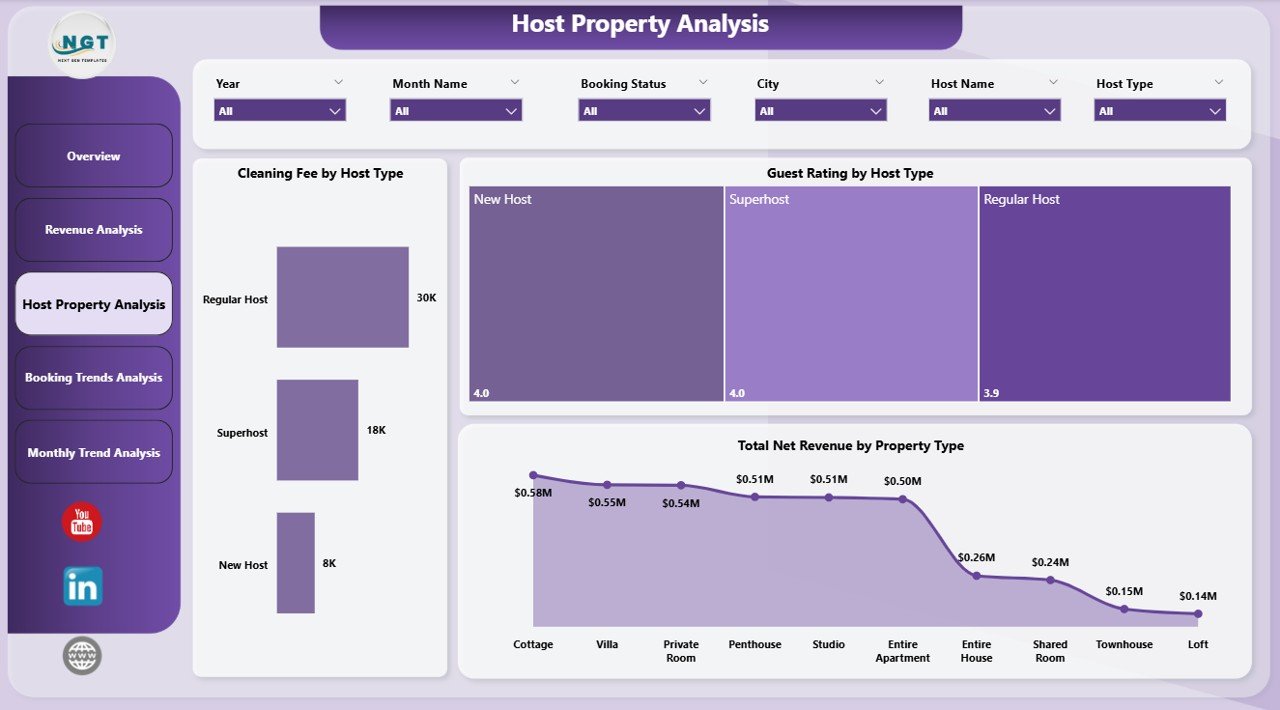
Hosts play a crucial role in short-term rental platforms. Therefore, analyzing host performance becomes essential.
The Host Property Analysis Page evaluates both host productivity and property performance.
Key Charts in Host Property Analysis
-
Total Net Revenue by Host Type
-
Guest Rating by Host Type
-
Total Net Revenue by Property Type
Insights Provided
This page answers important business questions such as:
-
Which host type generates the highest revenue?
-
Which properties receive the best guest ratings?
-
Which property categories produce the most profit?
Because this page combines financial and customer feedback data, managers can identify high-performing hosts and properties.
4. Booking Trends Analysis – What Are the Booking Behavior Patterns?
Click to Purchases Airbnb-style Rentals Dashboard in Power BI
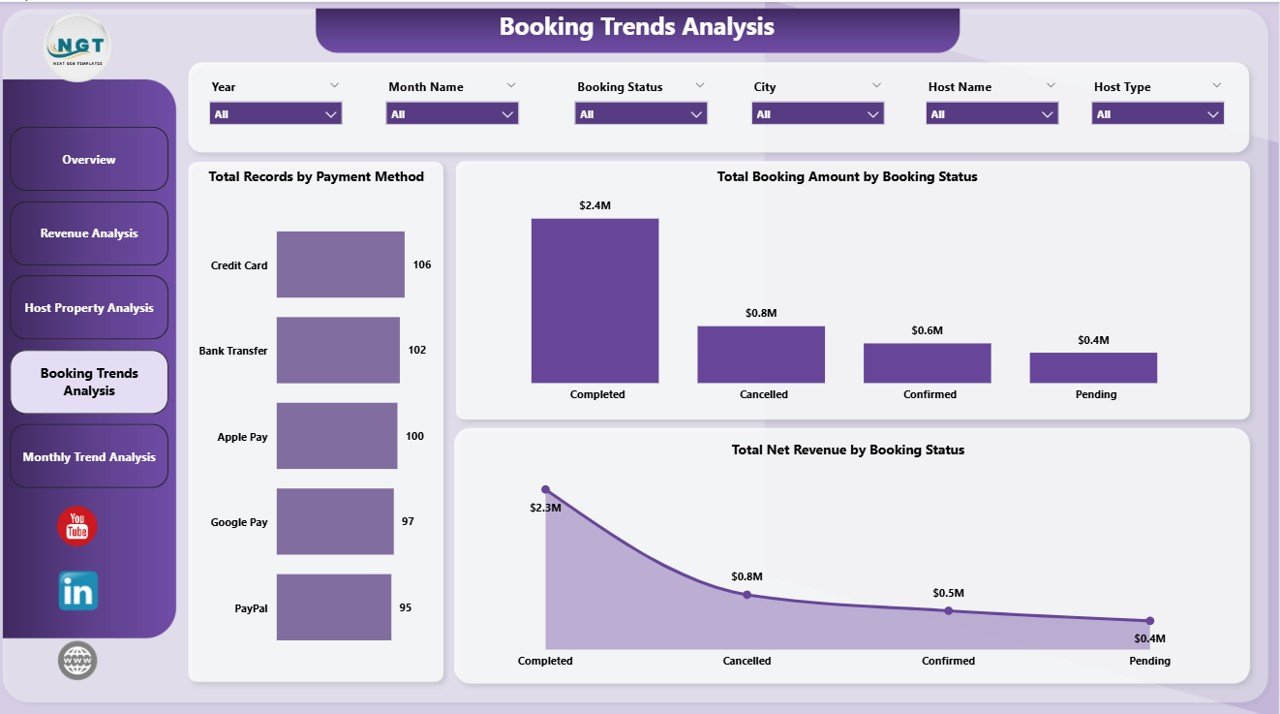
Understanding booking patterns helps rental businesses optimize marketing and pricing strategies.
The Booking Trends Analysis Page provides deep insights into booking behavior.
Key Charts in Booking Trends Analysis
-
Total Net Revenue by Payment Method
-
Total Booking Amount by Booking Status
-
Total Net Revenue by Booking Status
Insights Provided
This page reveals:
-
Which payment methods customers prefer
-
Booking completion vs cancellation patterns
-
Revenue contribution by booking status
Therefore, businesses can improve payment systems and reduce cancellation rates.
5. Month Analysis – How Does Performance Change Throughout the Year?
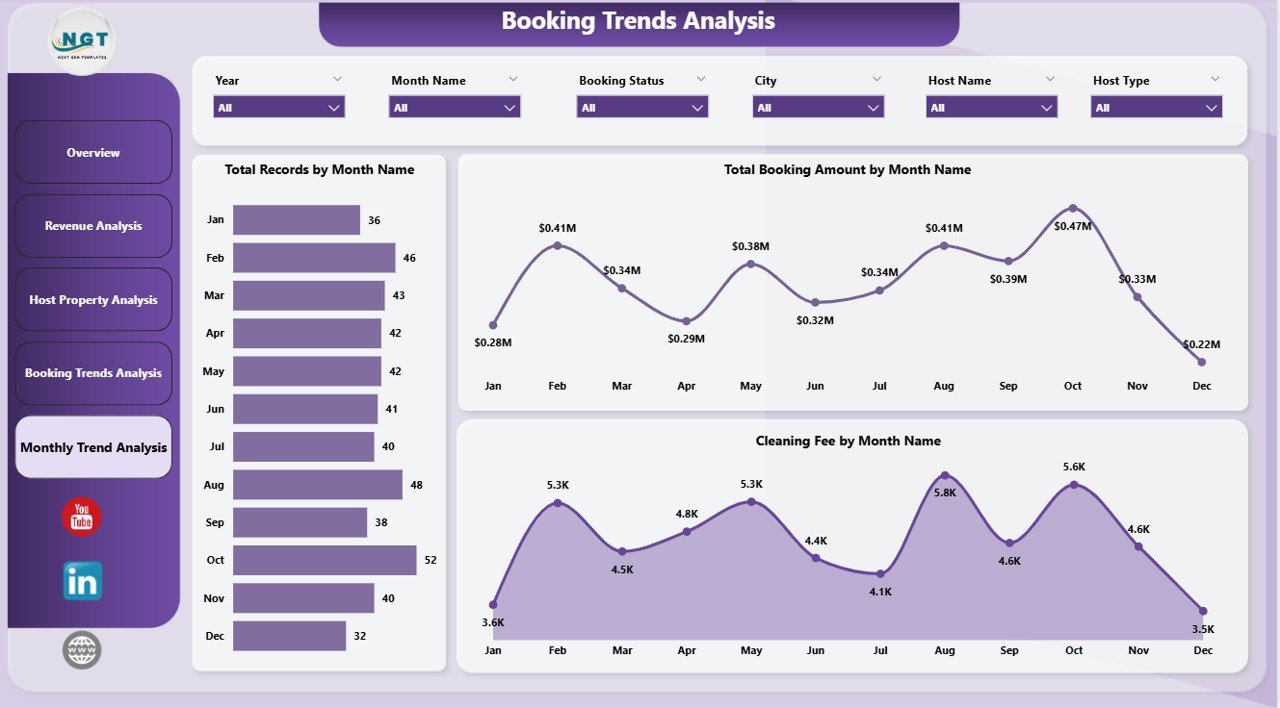
Seasonality plays a major role in the rental industry.
The Month Analysis Page allows managers to monitor monthly trends.
Key Charts in Month Analysis
-
Total Net Revenue by Month
-
Total Booking Amount by Month
-
Cleaning Fee by Month
Insights Provided
This page helps businesses:
-
Identify peak travel months
-
Analyze monthly revenue performance
-
Understand cleaning cost trends
As a result, property managers can adjust staffing and pricing strategies based on demand.
Advantages of Airbnb-style Rentals Dashboard in Power BI
Implementing this dashboard provides several benefits for property managers and rental businesses.
1. Better Revenue Monitoring
The dashboard provides clear insights into rental income across cities, hosts, and property types.
Therefore, businesses can quickly identify profitable markets.
2. Improved Decision-Making
Managers can use real-time analytics to make faster and smarter decisions.
For example, they can adjust pricing, manage inventory, or optimize host assignments.
3. Clear Booking Insights
The dashboard tracks booking status, payment methods, and reservation patterns.
As a result, businesses understand customer behavior better.
4. Host Performance Evaluation
Managers can analyze host productivity and guest ratings.
Consequently, companies can reward high-performing hosts and improve service quality.
5. Better Seasonal Planning
The month analysis page helps businesses identify seasonal demand patterns.
Therefore, companies can prepare marketing campaigns and pricing strategies accordingly.
How Does Power BI Improve Rental Business Analytics?
Power BI provides powerful data analysis capabilities that help rental businesses transform raw booking data into visual insights.
Key Power BI benefits include:
-
Interactive dashboards
-
Real-time data updates
-
Advanced filtering and slicers
-
Custom visualizations
-
Integration with multiple data sources
Because of these features, Power BI allows organizations to analyze thousands of booking records efficiently.
Best Practices for the Airbnb-style Rentals Dashboard in Power BI
Click to Purchases Airbnb-style Rentals Dashboard in Power BI
To get the best results from your dashboard, businesses should follow several best practices.
1. Maintain Accurate Data
Ensure that booking, revenue, and host data remain clean and updated.
Clean data improves the accuracy of dashboard insights.
2. Use Consistent Data Sources
Use a single reliable data source whenever possible.
Consistent data improves reporting reliability.
3. Update Data Regularly
Frequent data updates help businesses monitor performance trends quickly.
Therefore, managers can react faster to market changes.
4. Use Clear Visualizations
Choose charts that clearly communicate insights.
Avoid overcrowded visuals that make interpretation difficult.
5. Monitor Key Performance Indicators
Focus on important metrics such as:
-
Occupancy rate
-
Revenue per property
-
Guest ratings
-
Booking conversion rates
Tracking these KPIs helps managers measure business performance effectively.
How Can Businesses Use This Dashboard to Increase Profit?
Rental businesses can use the dashboard insights to improve revenue strategies.
For example:
-
Adjust pricing during high-demand seasons
-
Focus marketing on profitable cities
-
Improve property quality based on guest feedback
-
Encourage high-performing hosts
-
Reduce cancellations through better booking policies
As a result, businesses can increase occupancy rates and overall profitability.
Conclusion
The Airbnb-style Rentals Dashboard in Power BI provides a powerful analytics solution for short-term rental businesses.
This dashboard transforms complex booking data into clear visual insights that help managers monitor performance, analyze revenue trends, evaluate host productivity, and identify seasonal demand patterns.
Because Power BI supports interactive visuals and real-time analysis, businesses can quickly make data-driven decisions.
Consequently, property owners, rental managers, and hospitality companies can improve operational efficiency, enhance customer satisfaction, and increase profitability.
Organizations that adopt advanced analytics dashboards gain a significant competitive advantage in the rapidly growing short-term rental industry.
Frequently Asked Questions (FAQs)
1. What is an Airbnb-style Rentals Dashboard?
An Airbnb-style Rentals Dashboard is a Power BI analytics tool that helps rental businesses monitor bookings, revenue, host performance, and property analytics through interactive visualizations.
2. Why should rental businesses use Power BI dashboards?
Power BI dashboards help businesses convert raw booking data into visual insights, which improves decision-making and business planning.
3. What metrics should an Airbnb dashboard track?
Important metrics include:
-
Total bookings
-
Revenue by city
-
Guest ratings
-
Property performance
-
Booking status
-
Seasonal trends
4. Can small property managers use this dashboard?
Yes. Small hosts and property managers can also use Power BI dashboards to analyze bookings, track revenue, and optimize property performance.
5. How often should rental analytics dashboards be updated?
Businesses should update the dashboard regularly, preferably daily or weekly, to maintain accurate insights.
Visit our YouTube channel to learn step-by-step video tutorials