The Bakery KPI Scorecard in Excel tracks 15+ bakery-specific KPIs across 4 worksheet tabs, with Month-to-Date and Year-to-Date comparisons, Actual vs Target values, and traffic-light conditional formatting. Over 65% of independent bakeries still rely on manual tracking methods for production yield, ingredient waste, and revenue metrics according to industry surveys — this template replaces scattered spreadsheets with a single structured scorecard that auto-calculates performance status the moment you enter your data.
Whether you run a neighborhood bread shop or manage operations for a multi-location artisan bakery chain, tracking KPIs consistently is what separates bakeries that grow from those that plateau. The Bakery KPI Scorecard in Excel gives you a ready-made framework to define, measure, and visualize every metric that matters — from dough yield and customer satisfaction to labor cost percentage and order accuracy — without paying monthly SaaS fees or learning new software.
Key Features of the Bakery KPI Scorecard in Excel
The Bakery KPI Scorecard in Excel includes 4 worksheet tabs covering scorecard display, trend analysis, data input, and KPI definitions. It tracks unlimited KPIs with MTD and YTD calculations, color-coded performance indicators, and trend charts comparing Actual, Target, and Prior Year values. Every formula is pre-built — you only need to enter your numbers.
The scorecard uses dropdown filters for Month, MTD, and YTD views, letting you switch time periods with one click. Conditional formatting applies green, amber, and red highlights automatically based on whether actual performance meets, approaches, or misses the target. The KPI Trend sheet provides line charts for any selected KPI, plotting Actual vs Target vs Prior Year across months for quick visual analysis.
Unlike generic KPI Dashboard Templates, this scorecard is designed specifically for bakery operations. You define your own KPI groups (Production, Quality, Revenue, Cost, Customer Service) and the scorecard organizes them automatically. No VBA macros are needed, so it works on Excel for Mac, Windows, and Excel Online.
Scorecard Sheets Explanation
1. Scorecard Sheet
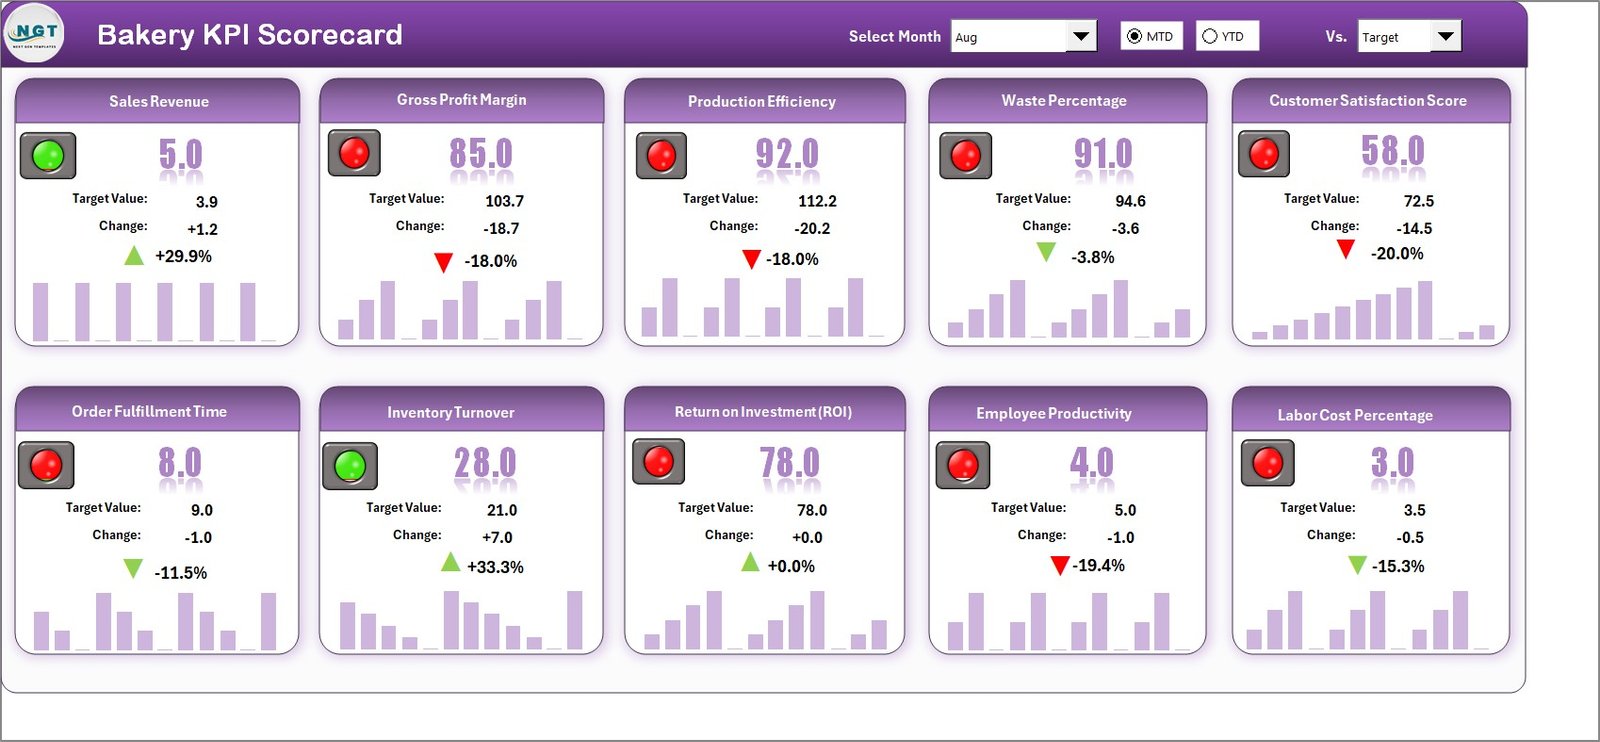
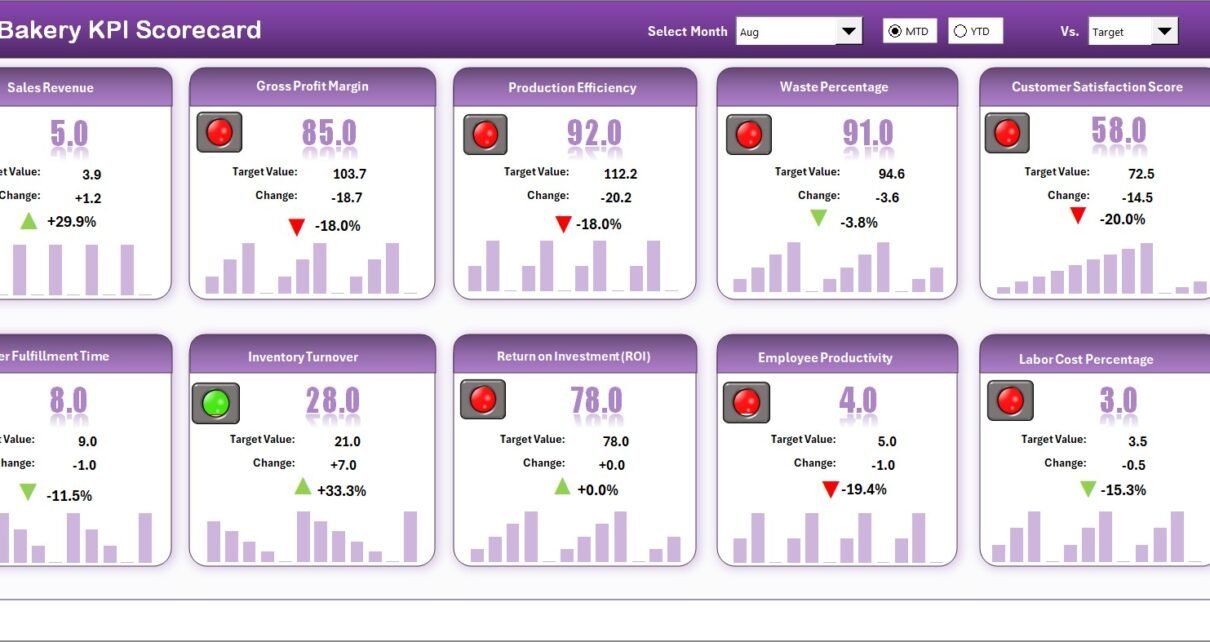
Bakery KPI Scorecard in Excel
The Scorecard sheet is the main interface where you view all KPI performance at a glance. Key features include:
- Dropdown Menus — Select the month, MTD (Month-to-Date), or YTD (Year-to-Date) for performance analysis.
- Actual vs Target Values — Compare actual performance against targets for each KPI across every time period.
- Visual Indicators — Color-coded conditional formatting highlights performance status instantly using green, amber, and red.
- KPI Overview — Display all relevant KPI information including MTD and YTD comparisons in a single consolidated view.
2. KPI Trend Sheet
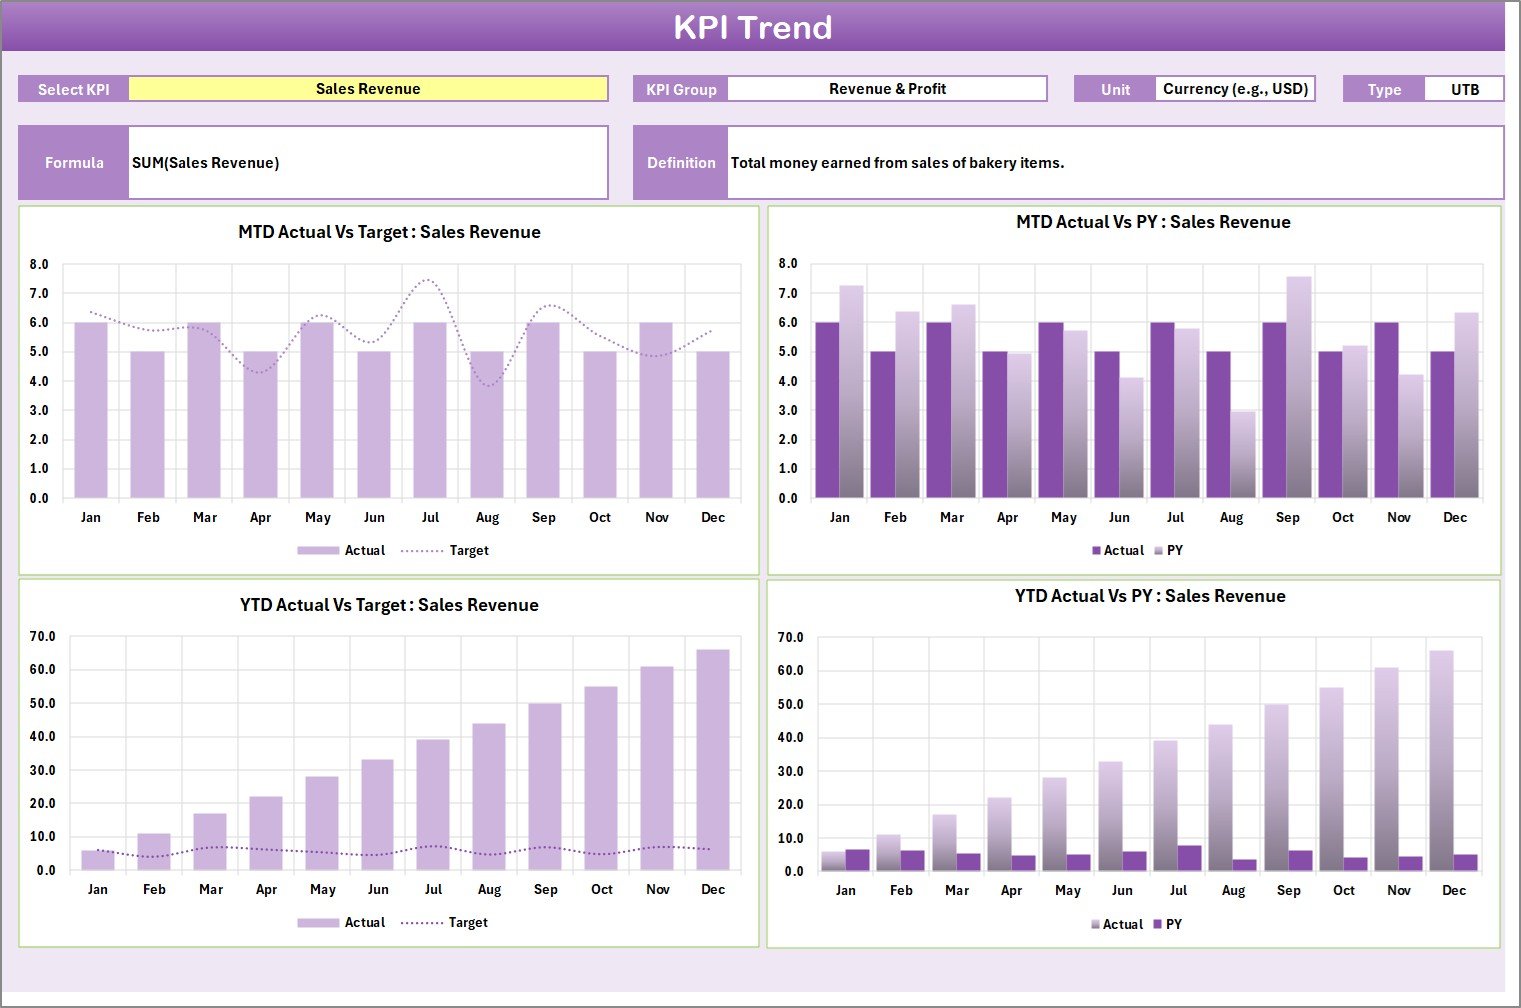
KPI Trend Sheet
Select any KPI name from the dropdown available on cell C3. The sheet displays the KPI Group, Unit of KPI, Type of KPI (Lower the Better or Upper the Better), Formula, and Definition. The MTD and YTD trend charts show Actual, Target, and Prior Year (PY) numbers plotted across months, making it easy to spot seasonal patterns and performance trajectories.
3. Input Data Sheet
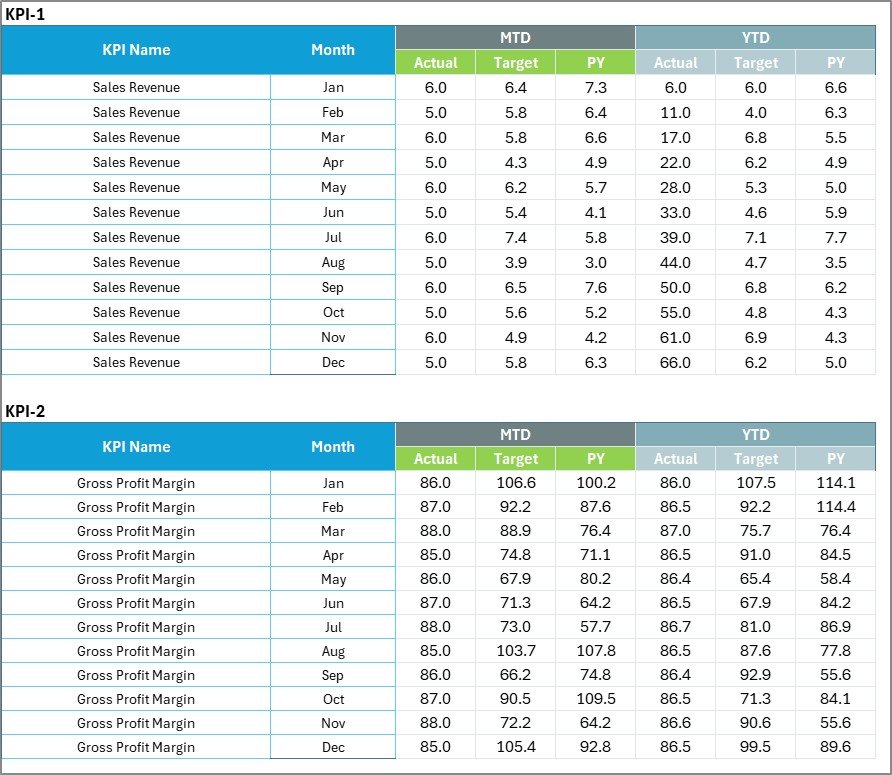
Input Data Sheet
The Input Data sheet is where you enter all KPI data. Record actual values, targets, and prior year metrics for each KPI on a monthly basis. The sheet is structured for easy data entry — simply fill in your numbers and the scorecard recalculates everything automatically. Update data as new results become available to keep the scorecard current throughout the year.
4. KPI Definition Sheet
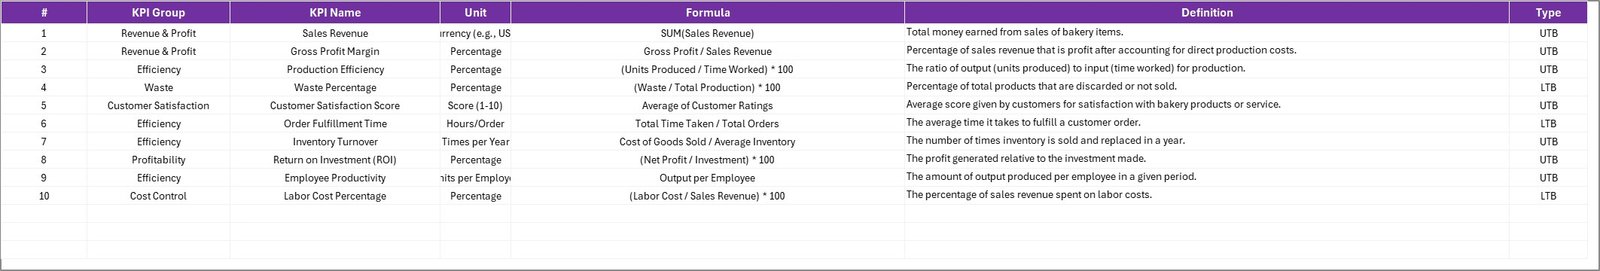
KPI Definition Sheet
In this sheet tab, enter the KPI Name, KPI Group, Unit, Formula, and KPI Definition. This is the control center of the entire scorecard — every metric you define here drives the scorecard display, trend charts, and input data structure. You can add bakery-specific KPIs like Dough Yield Rate, Ingredient Waste %, Customer Return Rate, Average Transaction Value, Production Efficiency, and Labour Cost Ratio.
Bakery KPI Scorecard in Excel vs. Google Sheets Scorecard vs. Toast POS Analytics — Feature Comparison
| Feature | Bakery KPI Scorecard in Excel | Google Sheets Scorecard | Toast POS Analytics |
|---|---|---|---|
| Cost | $12.99 one-time | $8.99–$9.99 one-time | $69–$165/month |
| Platform | Microsoft Excel (desktop) | Google Sheets (browser) | Cloud SaaS |
| Setup Time | Under 10 minutes | Under 10 minutes | 2–4 weeks onboarding |
| Real-Time Team Collaboration | Via OneDrive/SharePoint | Native real-time | Yes |
| Mobile Access | Excel Mobile app | Any browser | Yes (dedicated app) |
| Customizable KPIs | Unlimited — you define all KPIs | Unlimited | Limited to POS data fields |
| MTD/YTD Trend Charts | Yes — built in | Yes | Basic reporting |
| Year-1 Cost at 5 Users | $12.99 total | $8.99 total | $4,140–$9,900 |
| Offline Access | Full offline | Limited offline | No |
For bakery owners who want structured KPI tracking without monthly SaaS fees or complex POS integrations, the Bakery KPI Scorecard in Excel sits in the sweet spot.
Who Should Use This Template
✅ Perfect for:
- Bakery owners and managers tracking production, revenue, waste, and quality KPIs on a monthly basis
- Food production supervisors who need to compare actual performance against targets with clear visual indicators
- F&B consultants delivering professional KPI performance reports to bakery clients
- Small-to-mid-size bakeries (1–50 employees) that want structured KPI tracking without recurring software costs
❌ Not a fit if:
- You run a large bakery chain (100+ locations) needing real-time POS-integrated analytics across all outlets simultaneously
- Your team requires automated data feeds from IoT oven sensors or production line monitoring equipment
- You do not have Microsoft Excel — consider the Hospitality KPI Scorecard in Google Sheets as a browser-based alternative
Real-World Use Cases
Marco owns a neighborhood bakery in Chicago with 8 employees. He uses the Bakery KPI Scorecard in Excel to track daily bread production yield, ingredient waste percentage, and average revenue per customer. Each month he enters actuals into the Input Data sheet and reviews the traffic-light scorecard to identify which metrics are falling below target — saving him $165/month he was spending on Toast POS analytics he barely utilized.
Priya manages operations for a 3-location artisan bakery chain in London. She customized the KPI Definition sheet with 18 bakery-specific metrics including dough fermentation consistency, order fulfillment rate, and customer return rate. The YTD trend charts help her present quarterly performance reviews to the company owner with clear visuals instead of raw number spreadsheets.
Carlos is an F&B consultant in São Paulo. He uses the template as a client delivery tool — replacing sample KPIs with each bakery client’s specific metrics and branding. The professional scorecard layout impresses clients and saves him 6+ hours per engagement compared to building custom reports from scratch each time.
Advantages of the Bakery KPI Scorecard in Excel
The biggest advantage is zero recurring cost. At $12.99 one-time, the Bakery KPI Scorecard in Excel costs less than a single month of most bakery analytics SaaS tools. You own the file forever and can modify it without restrictions.
The unlimited KPI customization sets it apart from POS-based analytics tools that only track pre-defined data fields. Bakeries have unique metrics — dough hydration consistency, display case turnover rate, special order fulfillment time — and this scorecard adapts to whatever you need to measure.
No internet required — the file works fully offline on any computer with Excel installed. Your bakery performance data stays on your machine, not on a third-party server. And since there are no macros or VBA code, it runs identically on Mac, Windows, and Excel Online.
The template also functions as a professional reporting tool. The color-coded scorecard and trend charts are presentation-ready — print them for team meetings, share via email, or display on a bakery office screen via OneDrive.
Opportunities for Improvement
The scorecard requires manual data entry — there is no automated connection to POS systems like Square, Toast, or Lightspeed. Bakeries processing hundreds of daily transactions may want to export POS summaries to a CSV and paste monthly totals into the Input Data sheet rather than entering individual transactions.
There is no built-in multi-location comparison view. If you operate several bakery branches, you would need to maintain a separate scorecard file per location or consolidate data manually. For multi-location tracking with automated filtering, consider the Restaurant P and L Dashboard in Excel which includes location-level slicers.
The template does not include forecasting or predictive analytics. It tracks historical and current performance but does not project future KPI values. Users who need predictive capability would need to add their own forecast formulas or use a dedicated forecasting tool.
Best Practices
Define KPIs before entering data. Start with the KPI Definition sheet and set up 10–15 core bakery metrics before touching the Input Data sheet. Group KPIs by function (Production, Quality, Revenue, Cost, Customer) for clean scorecard organization.
Update monthly on the same day. Pick a consistent date (e.g., the 1st or last business day) to enter the previous month’s actuals. Consistent timing makes trend analysis meaningful and prevents data gaps.
Set realistic targets. Use your first 2–3 months of actual data to establish baseline targets rather than guessing. Adjust targets quarterly based on seasonal patterns — bakery revenue typically peaks during holidays and weekends.
Use the KPI Trend sheet for reviews. Instead of scrolling through raw numbers, select each KPI in the trend dropdown during monthly or quarterly reviews. The visual comparison of Actual vs Target vs Prior Year tells a clearer story than tables alone.
Back up your file. Save a copy to OneDrive, Google Drive, or an external drive monthly. Rename backup files with the date (e.g., Bakery_KPI_Scorecard_Apr2026.xlsx) so you can recover historical data if needed. Learn more about Excel best practices at Microsoft Excel Support.
Explore Relevant Templates
📌 Food Manufacturing KPI Scorecard in Excel — Track food production KPIs including yield, defect rate, and compliance metrics across manufacturing operations.
📌 Restaurant P and L Dashboard in Excel — Monitor restaurant revenue, food cost, labor cost, and net profit across multiple locations with interactive charts.
📌 Coffee Chains Dashboard in Excel — Analyze coffee chain operations with detailed sales, cost, and store-level performance tracking.
📌 Winery KPI Scorecard in Excel — Track winery production, quality, and revenue KPIs with the same scorecard format and trend analysis.
📌 Distillery KPI Scorecard in Excel — Monitor distillery operations with production efficiency, quality control, and cost KPIs.
📌 Also available: Hospitality KPI Scorecard in Google Sheets for a cloud-based alternative.
Frequently Asked Questions
What KPIs can I track with the Bakery KPI Scorecard in Excel?
The Bakery KPI Scorecard in Excel lets you define and track unlimited bakery KPIs including production yield, ingredient waste, revenue per square foot, customer satisfaction, order accuracy, and labor cost percentage. You control all KPI definitions in the dedicated Definition sheet.
How long does it take to set up the Bakery KPI Scorecard?
Setup takes under 10 minutes. Enter your KPI definitions, input your first month of actual data, and the scorecard auto-calculates Actual vs Target values with color-coded indicators. No formulas to write and no macros to enable.
Can I compare monthly, MTD, and YTD performance?
Yes. The Scorecard sheet includes dropdown menus for Month, MTD, and YTD views. Select any option and all KPI values refresh automatically to show performance for that specific time frame.
Does this template work on Mac?
Yes. The Bakery KPI Scorecard in Excel uses standard formulas and conditional formatting — no VBA macros required. It works on Excel for Mac, Excel for Windows, and Excel Online via OneDrive or SharePoint.
How does this compare to Toast POS or MarketMan analytics?
Toast POS costs $69–$165 per month and MarketMan starts at $239 per month. The Bakery KPI Scorecard in Excel costs $12.99 one-time with lifetime access. While SaaS tools offer POS integration, this scorecard gives you full KPI customization with zero recurring costs.
Can I add more KPIs later?
Yes. Simply add new rows to the KPI Definition sheet and the corresponding Input Data sheet. The scorecard and trend charts expand automatically to include any new metrics you define — no structural changes needed.
Is there a Google Sheets version available?
Yes. Check out the Hospitality KPI Scorecard in Google Sheets for a cloud-based alternative with similar scorecard functionality for bakery and hospitality KPI tracking.
About the Author
Built by PK — Microsoft Certified Professional with 15+ years of Excel, Google Sheets, and Power BI experience. Founder of NextGenTemplates, reaching 300K+ subscribers across YouTube channels. Every template is hand-built and tested before release.
Conclusion
The Bakery KPI Scorecard in Excel gives bakery owners, managers, and F&B consultants a structured way to track production, quality, revenue, and cost KPIs without monthly software subscriptions. With 4 worksheet tabs, MTD/YTD trend charts, and unlimited KPI customization, it replaces manual tracking methods with a professional scorecard that auto-calculates everything the moment you enter your numbers.
👉 Click here to Purchase the Bakery KPI Scorecard in Excel
✅ Instant download · One-time payment · No subscription
🎥 Visit our YouTube channel for step-by-step video tutorials: Youtube.com/@PK-AnExcelExpert
📅 Last updated: April 2026