Economic Development Boards (EDBs) play a crucial role in driving regional growth, attracting investments, supporting industries, and creating employment opportunities. However, managing and measuring the success of economic initiatives can become difficult when organizations rely on scattered spreadsheets and manual reports.
Therefore, organizations increasingly adopt data-driven KPI dashboards to monitor performance and evaluate progress effectively.
One of the most practical solutions is the Economic Development Boards KPI Dashboard in Excel. This ready-to-use dashboard helps economic development agencies, government departments, and policy planners monitor important economic indicators in one centralized system.
Because the dashboard converts raw data into meaningful charts and performance indicators, decision-makers can quickly analyze economic trends, compare targets with actual results, and take corrective actions when necessary.
In this article, you will learn everything about the Economic Development Boards KPI Dashboard in Excel, including its features, structure, advantages, best practices, and frequently asked questions.
Click to buy Economic Development Boards KPI Dashboard in Excel
What Is an Economic Development Boards KPI Dashboard in Excel?
An Economic Development Boards KPI Dashboard in Excel is an interactive reporting tool that helps organizations monitor and evaluate economic development performance using key performance indicators (KPIs).
Economic development boards often track various indicators such as:
- Investment inflow
- Job creation
- Industrial growth
- Infrastructure development
- Export growth
- Business registrations
- Regional economic growth metrics
However, analyzing these indicators manually consumes time and often leads to reporting errors.
Therefore, Excel KPI dashboards simplify the process by transforming raw economic data into visual insights, performance charts, and KPI scorecards.
As a result, policymakers and economic analysts can easily monitor performance trends and evaluate whether development initiatives meet their strategic goals.
Why Do Economic Development Boards Need KPI Dashboards?
Economic development programs involve multiple stakeholders, large datasets, and long-term planning. Consequently, organizations must monitor performance continuously.
A KPI dashboard helps solve several common challenges.
Difficulty Tracking Economic Programs
Economic development boards often manage many initiatives at the same time. Without a centralized dashboard, monitoring each initiative becomes difficult.
However, a KPI dashboard consolidates all performance indicators in one place.
- Slow Reporting Processes
Manual reports take time to prepare and update. In contrast, an automated dashboard refreshes results instantly after data updates.
- Lack of Performance Visibility
Decision-makers often struggle to understand economic performance trends quickly. Visual dashboards solve this problem by presenting information in charts and indicators.
- Data Fragmentation
Economic data usually comes from multiple departments. A KPI dashboard combines this data into a single reporting system.
Therefore, organizations can analyze performance more efficiently.
What Are the Key Features of the Economic Development Boards KPI Dashboard in Excel?
The Economic Development Boards KPI Dashboard in Excel includes several powerful features that help organizations analyze performance effectively.
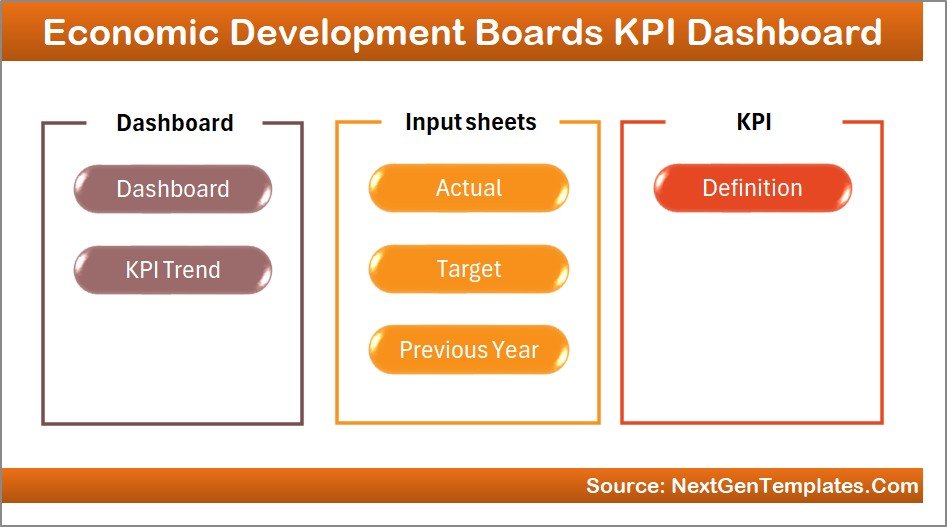
This ready-to-use dashboard contains 7 worksheets, each designed to perform a specific function.
Let’s explore each worksheet in detail.
Summary Page – Easy Navigation Across the Dashboard
The Summary Page works as an index page of the dashboard.
This page includes six navigation buttons that allow users to jump quickly to different sheets in the workbook.
Key Benefits of the Summary Page
- Improves dashboard usability
- Allows quick navigation between reports
- Reduces time spent searching for sheets
Because the dashboard contains multiple worksheets, the summary page acts as a central control panel for the entire reporting system.
Click to buy Economic Development Boards KPI Dashboard in Excel
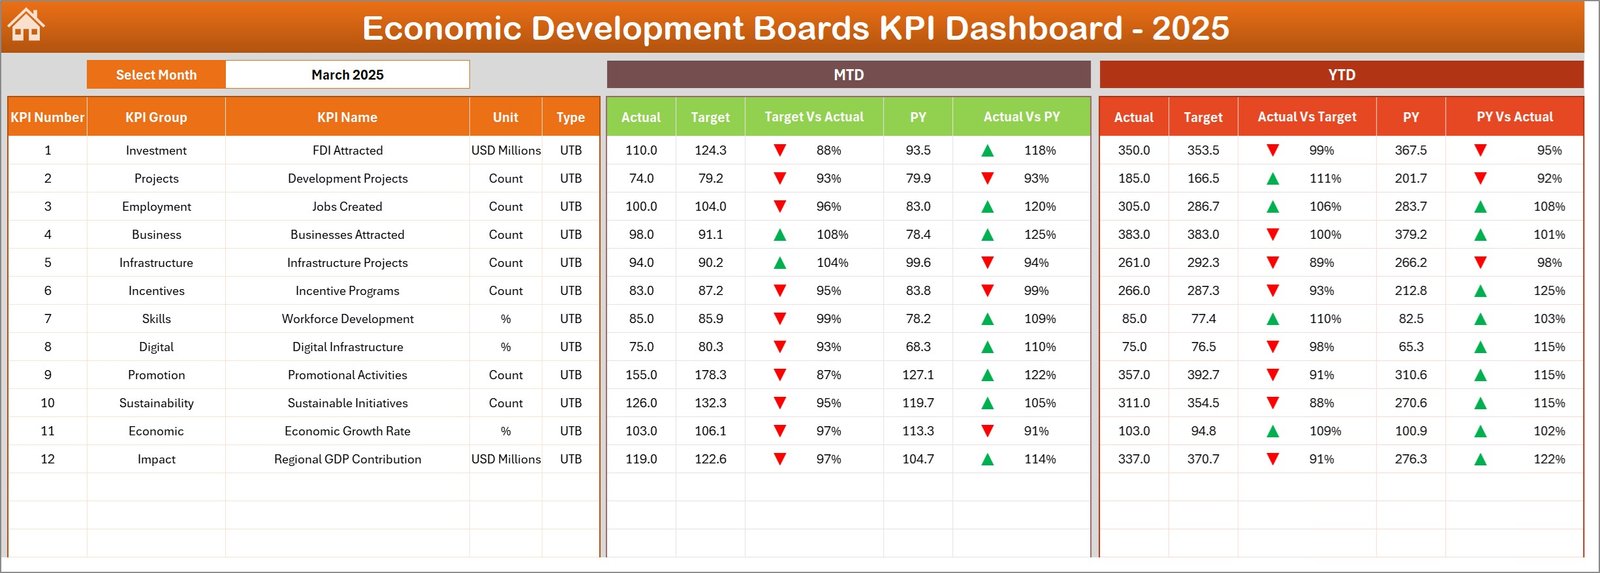
Dashboard Sheet – The Main KPI Monitoring Page
The Dashboard sheet is the core reporting page of the entire workbook.
Here, users can monitor all KPI performance metrics in a visually structured layout.
Key Functionalities of the Dashboard Sheet
- Month selection drop-down in cell D3
- Automatic update of dashboard metrics when the month changes
- Comparison between Actual, Target, and Previous Year data
- Performance indicators using conditional formatting
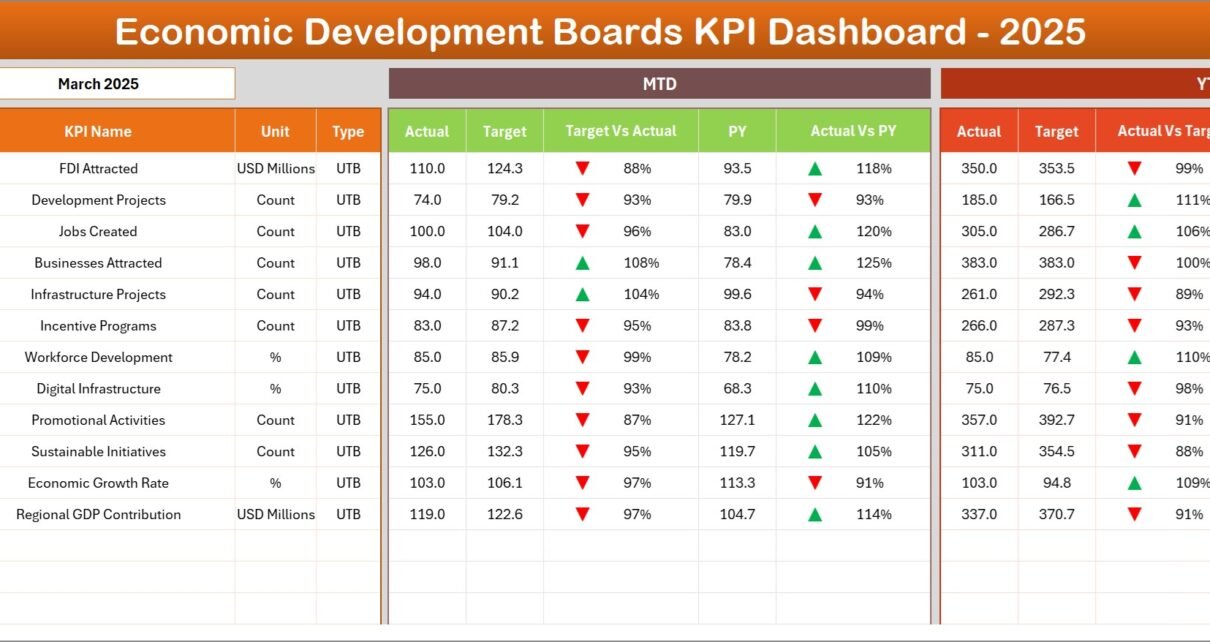
The dashboard displays both MTD (Month-To-Date) and YTD (Year-To-Date) performance metrics.
Metrics Displayed on the Dashboard
The dashboard presents the following KPI comparisons:
MTD Metrics
- MTD Actual
- MTD Target
- MTD Previous Year
- Target vs Actual comparison
- Previous Year vs Actual comparison
YTD Metrics
- YTD Actual
- YTD Target
- YTD Previous Year
- Target vs Actual comparison
- Previous Year vs Actual comparison
Additionally, the dashboard uses conditional formatting arrows to highlight performance trends.
- Up arrows indicate positive growth
- Down arrows highlight performance gaps
Therefore, decision-makers can quickly identify whether performance improves or declines.
Click to buy Economic Development Boards KPI Dashboard in Excel
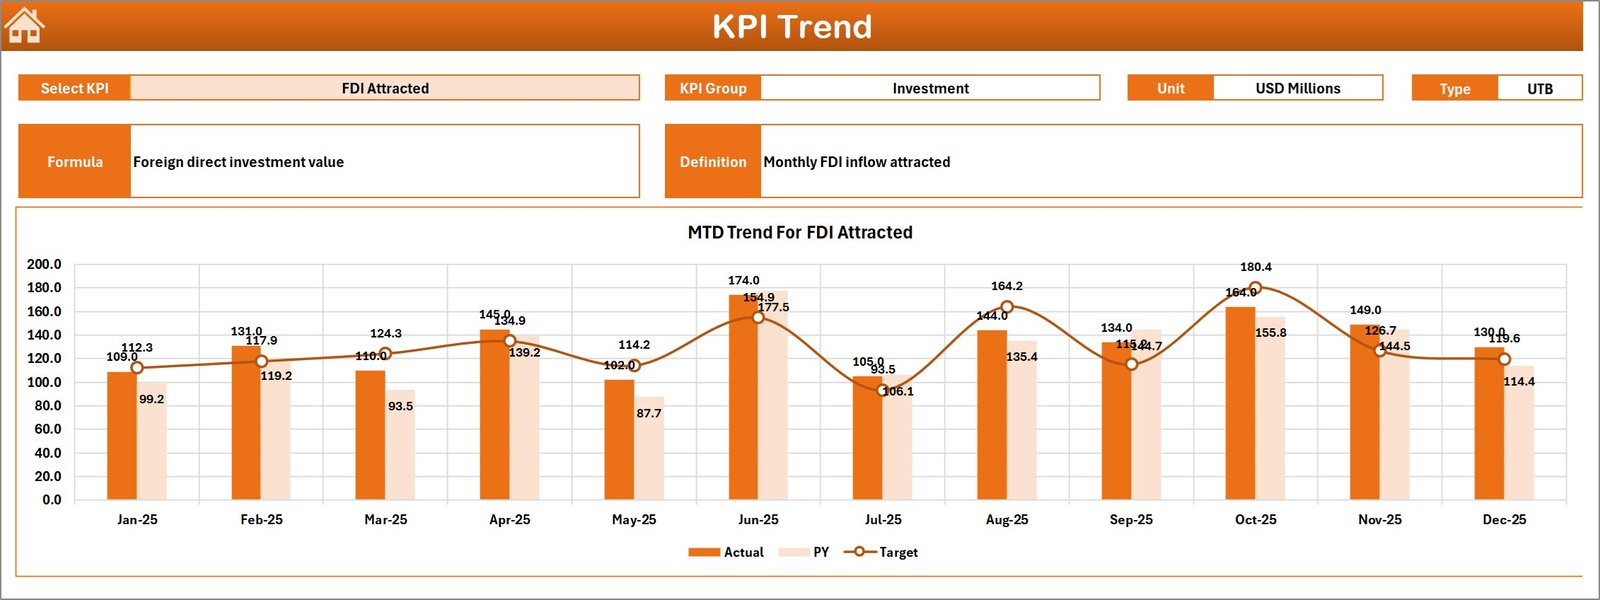
Trend Sheet – Visual Analysis of KPI Performance
The Trend Sheet provides a deeper performance analysis for each KPI.
Users can select a KPI from the drop-down menu available in cell C3.
Once selected, the sheet displays detailed KPI information.
KPI Information Displayed
- KPI Group
- Unit of Measurement
- KPI Type (Lower is Better or Higher is Better)
- KPI Formula
- KPI Definition
In addition, the sheet displays trend charts for both MTD and YTD performance.
Charts Included in the Trend Sheet
- MTD Actual vs Target vs Previous Year trend
- YTD Actual vs Target vs Previous Year trend
These charts help users evaluate how performance evolves over time.
Therefore, organizations can easily identify improvement areas and plan corrective strategies.
Click to buy Economic Development Boards KPI Dashboard in Excel
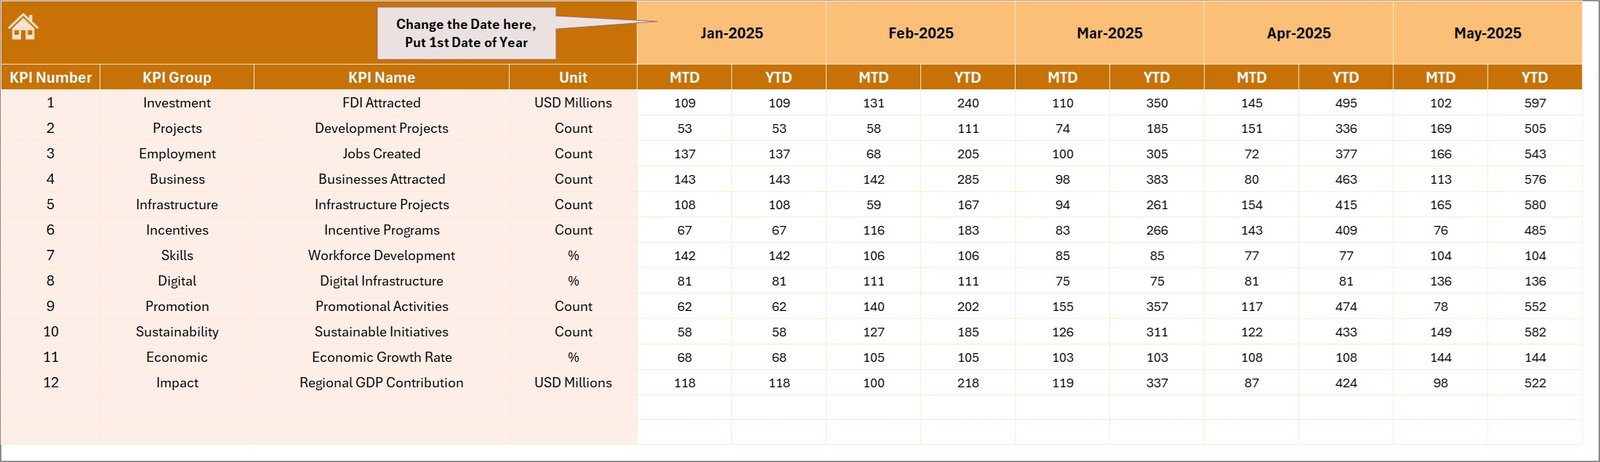
Actual Numbers Input Sheet – Enter Current Year Data
The Actual Numbers Input Sheet allows users to enter the actual KPI data for the current year.
Users can adjust the month from cell E1.
After setting the first month of the year, the sheet automatically aligns the data structure.
Information Entered in This Sheet
- Month-to-Date actual values
- Year-to-Date actual values
- KPI performance numbers for each indicator
Because this sheet stores the core operational data, users must update it regularly.
Once users enter new values, the entire dashboard updates automatically.
Click to buy Economic Development Boards KPI Dashboard in Excel
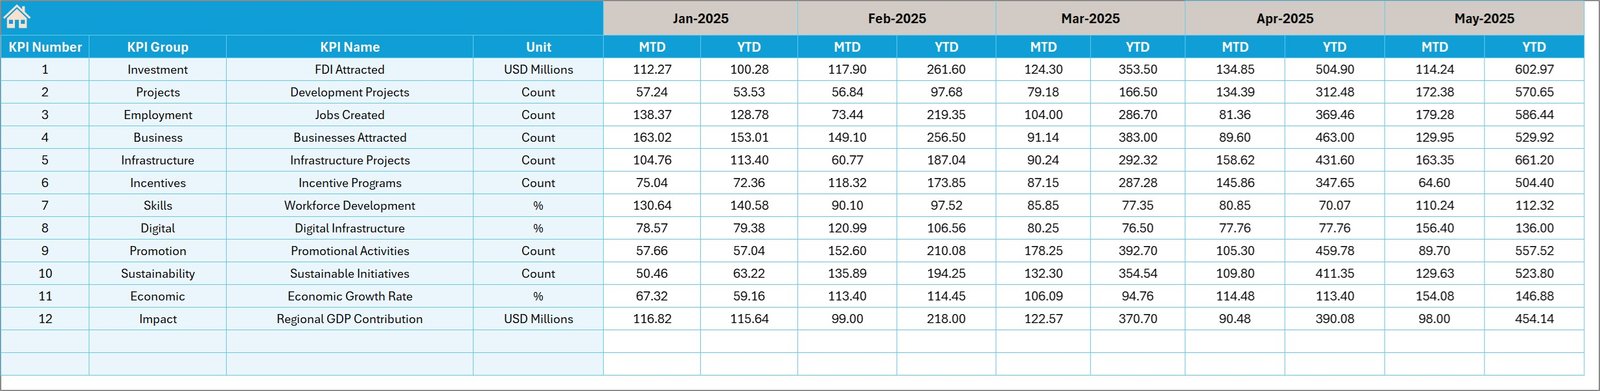
Target Sheet – Define Monthly KPI Targets
The Target Sheet stores KPI targets for each performance indicator.
Organizations define their expected economic development goals here.
Data Entered in the Target Sheet
- Monthly KPI targets
- Year-to-date targets
- Target benchmarks for each KPI
These targets help decision-makers evaluate performance accuracy.
Therefore, the dashboard can highlight whether the organization meets its development goals.
Click to buy Economic Development Boards KPI Dashboard in Excel
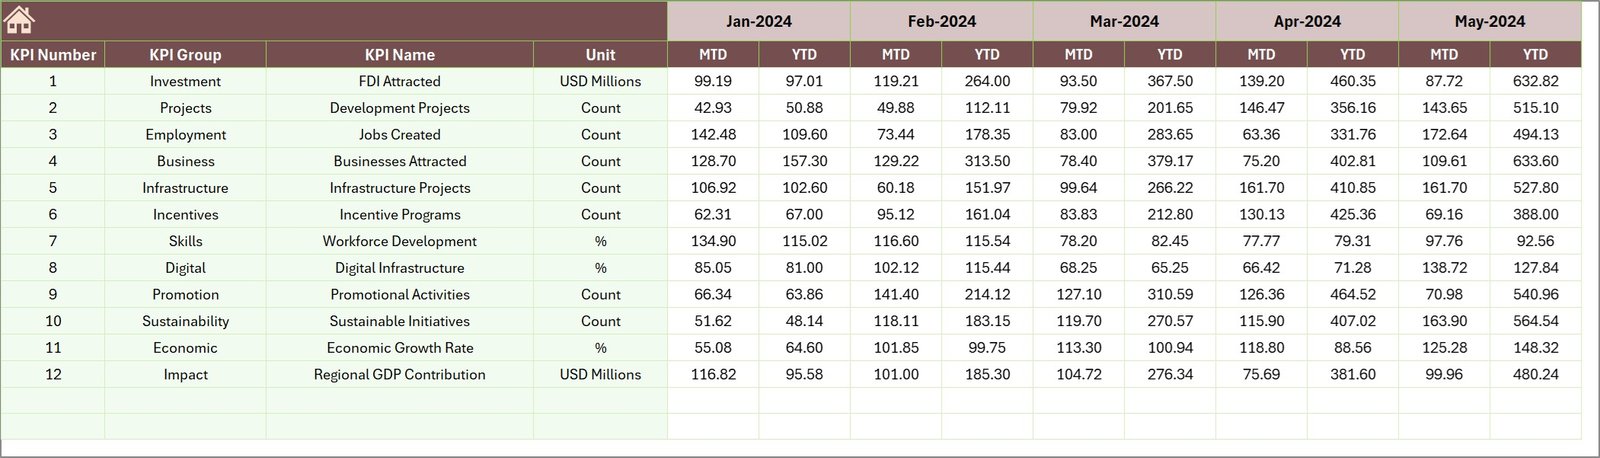
Previous Year Numbers Sheet – Historical Data Comparison
The Previous Year Numbers Sheet stores historical KPI data from the previous year.
Organizations enter data here in the same format used for current year inputs.
Purpose of This Sheet
- Compare current performance with previous year results
- Analyze economic growth trends
- Evaluate long-term performance improvements
Because historical comparisons provide valuable insights, this sheet plays an important role in performance analysis.
Click to buy Economic Development Boards KPI Dashboard in Excel
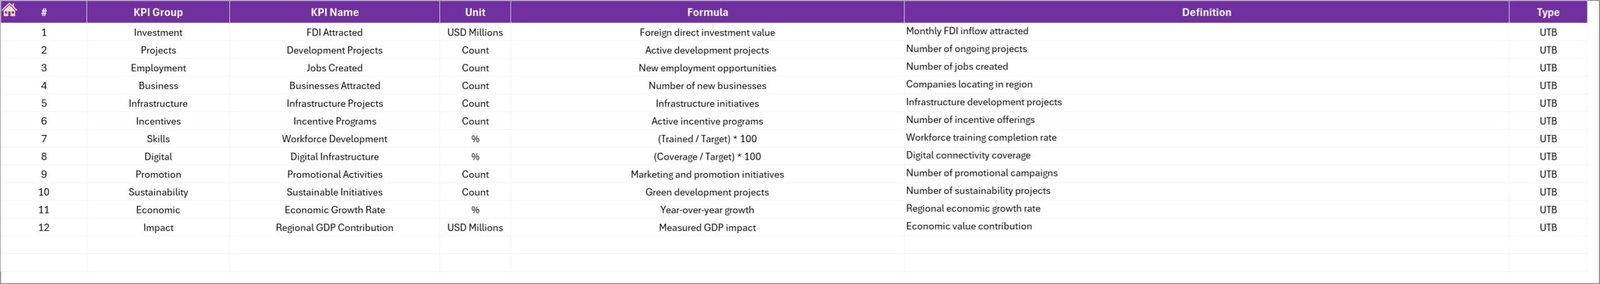
KPI Definition Sheet – Centralized KPI Documentation
The KPI Definition Sheet contains all KPI information used in the dashboard.
Users enter the following details in this sheet:
- KPI Name
- KPI Group
- Unit of Measurement
- KPI Formula
- KPI Definition
This sheet ensures that all stakeholders clearly understand each KPI.
Therefore, it improves reporting accuracy and data consistency.
Click to buy Economic Development Boards KPI Dashboard in Excel
Advantages of the Economic Development Boards KPI Dashboard in Excel
Organizations gain several benefits by using this dashboard.
- Centralized Performance Monitoring
The dashboard consolidates all KPIs in one location. As a result, users can easily monitor economic development performance.
- Faster Decision-Making
Because the dashboard displays real-time insights, leaders can make faster decisions.
- Better Economic Policy Evaluation
Decision-makers can analyze whether development policies achieve expected outcomes.
- Improved Data Transparency
All KPI definitions, targets, and results remain visible to stakeholders.
- Easy Monthly Reporting
Users can generate monthly performance reports quickly.
- Historical Trend Analysis
Organizations can compare current results with previous years.
- Simple Excel-Based Implementation
Since the dashboard runs in Excel, users do not require expensive BI tools.
Best Practices for the Economic Development Boards KPI Dashboard in Excel
Organizations must follow best practices to maximize dashboard effectiveness.
Maintain Accurate Data Inputs
Users must enter correct values in the Actual and Target sheets. Accurate data ensures reliable analysis.
Update Data Regularly
Regular updates keep the dashboard relevant and useful for decision-making.
Define Clear KPI Metrics
Each KPI must have a clear formula and definition. This practice ensures consistent measurement.
Use Meaningful Targets
Targets should reflect realistic economic development goals.
Monitor Performance Trends
Organizations should analyze trend charts regularly to identify improvement opportunities.
Standardize Data Entry
Users should follow consistent data entry formats across all sheets.
Review KPIs Periodically
Economic strategies evolve over time. Therefore, organizations should review KPI relevance regularly.
How Can Economic Development Boards Use This Dashboard Effectively?
Economic development agencies can use this dashboard in many ways.
Investment Promotion Monitoring
Track investment commitments and project implementation performance.
Job Creation Tracking
Monitor employment generation from development programs.
Industrial Growth Analysis
Evaluate growth in industrial sectors across regions.
Infrastructure Development Monitoring
Track the progress of infrastructure initiatives.
Economic Policy Evaluation
Analyze whether policies improve economic performance.
Therefore, the dashboard becomes a powerful tool for economic strategy management.
Conclusion
Economic development organizations must continuously monitor performance to ensure that policies, investments, and development initiatives produce measurable results.
However, manual reporting systems often make performance analysis slow and complicated.
The Economic Development Boards KPI Dashboard in Excel solves this challenge by transforming raw data into clear visual insights.
Because the dashboard integrates KPI monitoring, performance comparisons, and trend analysis in one system, organizations can track economic development initiatives more effectively.
Moreover, the dashboard allows decision-makers to identify performance gaps, evaluate policies, and improve economic planning.
Therefore, implementing a structured KPI dashboard significantly improves transparency, reporting efficiency, and strategic decision-making for economic development boards.
Frequently Asked Questions (FAQs)
What is an Economic Development KPI?
An Economic Development KPI measures the performance of programs designed to improve economic growth, investment, employment, and infrastructure.
Why do economic development boards need KPI dashboards?
KPI dashboards help organizations track performance, evaluate development initiatives, and make informed policy decisions.
Why is Excel useful for KPI dashboards?
Excel provides flexible data analysis tools, charting capabilities, and automation features that allow organizations to build powerful dashboards without advanced software.
Can organizations customize the KPI dashboard?
Yes. Organizations can modify KPIs, targets, and charts according to their economic development goals.
How often should KPI dashboards be updated?
Organizations should update dashboards monthly or whenever new performance data becomes available.
What type of KPIs can economic development boards track?
Economic development boards can track indicators such as:
- Investment inflows
- Job creation
- Industrial output
- Export growth
- Business registrations
- Infrastructure development metrics
Watch the step-by-step video tutorial:
Visit our YouTube channel to learn step-by-step video tutorials
Click to buy Economic Development Boards KPI Dashboard in Excel