In today’s competitive retail environment, aquatic pet stores must manage multiple aspects of their business—from product sales and inventory to customer satisfaction and profitability. However, handling all this data manually can quickly become overwhelming.
Many store owners still rely on scattered spreadsheets. As a result, they struggle to track performance, identify trends, and make informed decisions.
That’s exactly where the Aquatic Pet Stores Dashboard in Excel becomes a powerful solution. 🚀
This ready-to-use dashboard helps you monitor sales, analyze product performance, track customer behavior, and manage store operations—all in one place. Moreover, it transforms complex data into simple visuals, so you can make faster and smarter business decisions.
In this detailed guide, you will learn everything about this dashboard, including its features, structure, advantages, best practices, and FAQs.
Click to Purchases Aquatic Pet Stores Dashboard in Excel
📊 What is an Aquatic Pet Stores Dashboard in Excel?
An Aquatic Pet Stores Dashboard in Excel is an interactive reporting tool that helps you track and analyze store performance using KPIs, charts, and data tables.
Instead of using multiple spreadsheets, you can centralize all your business data into one dashboard. Therefore, you save time, reduce errors, and improve efficiency.
This dashboard helps you track:
-
🛒 Total Transactions
-
💰 Total Sales Amount
-
📦 Cost of Goods
-
📊 Quantity Sold
-
⭐ Customer Satisfaction
-
📍 Regional and Store Performance
Because Excel supports automation and dynamic charts, your dashboard updates instantly when data changes.
🤔 Why Do You Need an Aquatic Pet Store Dashboard?
Managing a retail business without proper analytics can lead to missed opportunities. However, a dashboard simplifies everything.
✅ Key Reasons:
-
It centralizes all store data
-
It improves sales tracking
-
It enhances customer insights
-
It helps control costs
-
It supports better decision-making
As a result, you gain full control over your store operations.
🧩 Key Features of Aquatic Pet Stores Dashboard in Excel
This dashboard includes 5 interactive pages along with a Page Navigator on the left side for easy navigation.
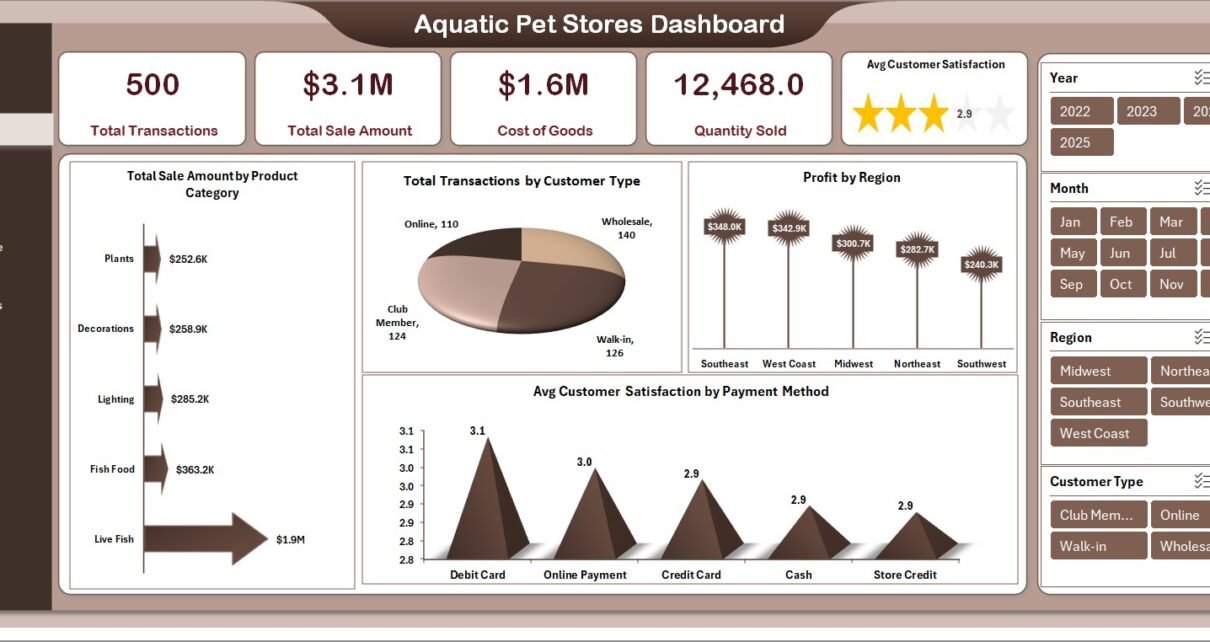
📌 1. Overview Page – Quick Business Snapshot
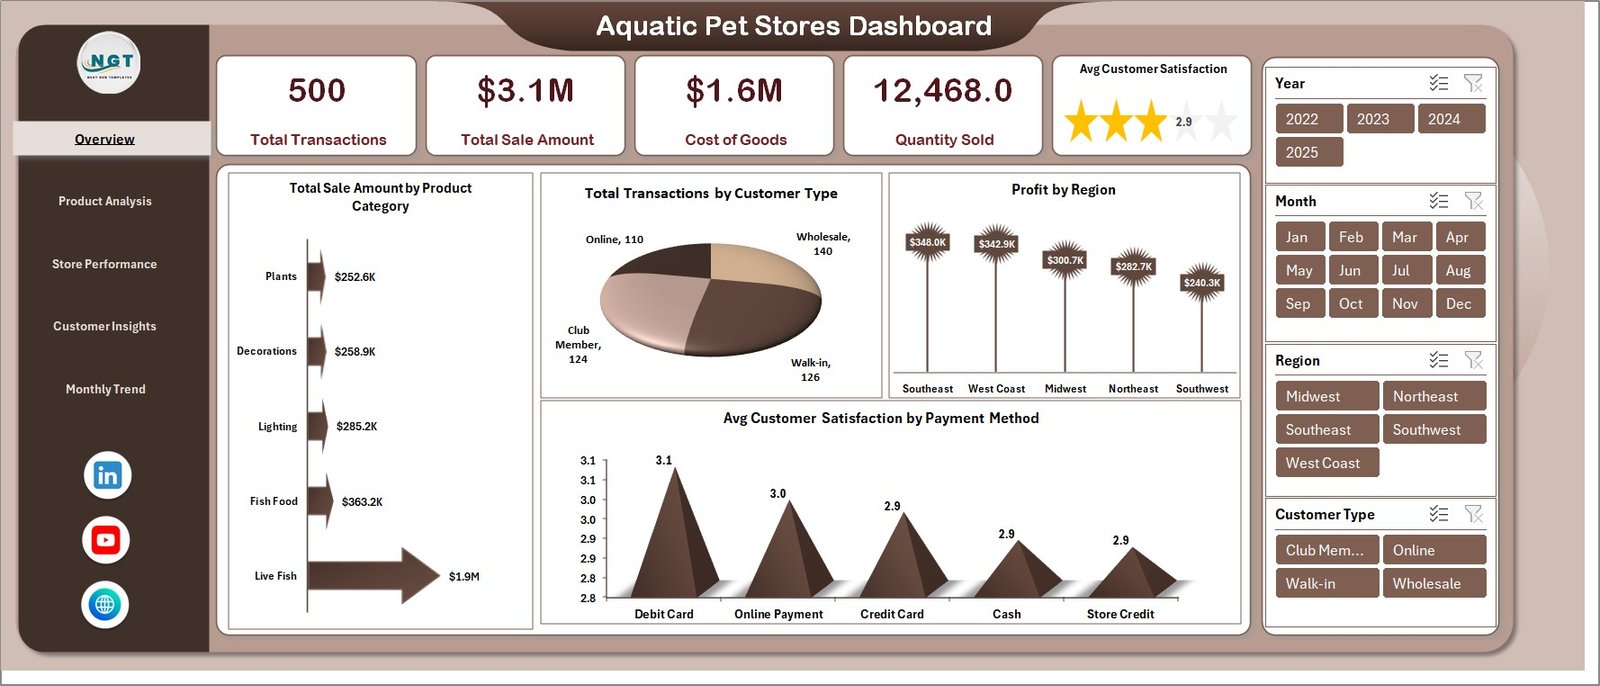
The Overview Page provides a high-level summary of store performance.
🔹 KPI Cards:
-
🛒 Total Transactions
-
💰 Total Sale Amount
-
📦 Cost of Goods
-
📊 Quantity Sold
-
⭐ Avg. Customer Satisfaction
📊 Charts:
-
Total Sale Amount by Product Category
-
Total Transactions by Customer Type
-
Profit by Region
-
Avg. Customer Satisfaction by Payment Method
👉 Therefore, this page gives a complete snapshot of your business.
📦 2. Product Analysis – Which Products Perform Best?
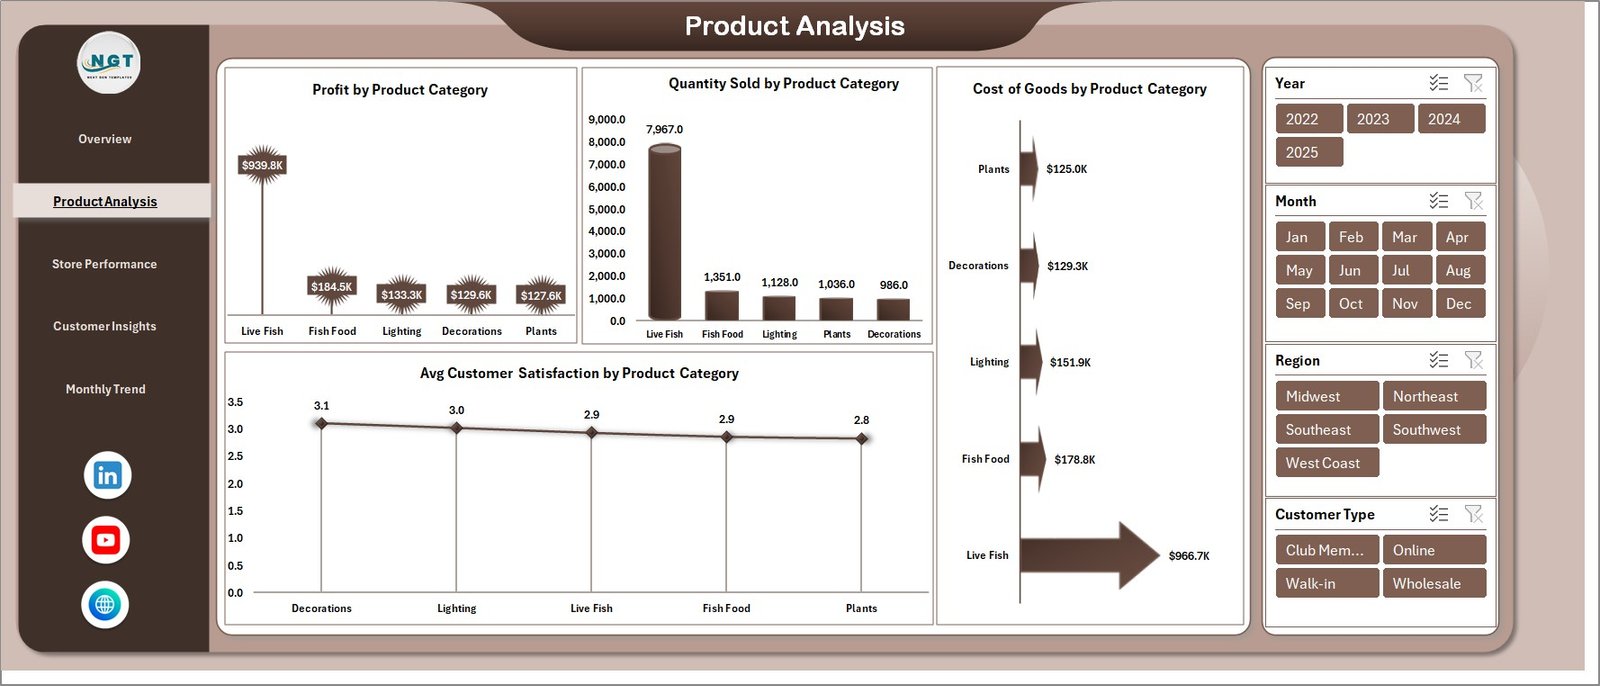
This page focuses on product-level performance.
📊 Charts Included:
-
Profit by Product Category
-
Quantity Sold by Product Category
-
Avg. Customer Satisfaction by Product Category
-
Cost of Goods by Product Category
👉 As a result, you can identify top-performing and low-performing products.
Click to Purchases Aquatic Pet Stores Dashboard in Excel
🏬 3. Store Performance – How Are Your Stores Performing?
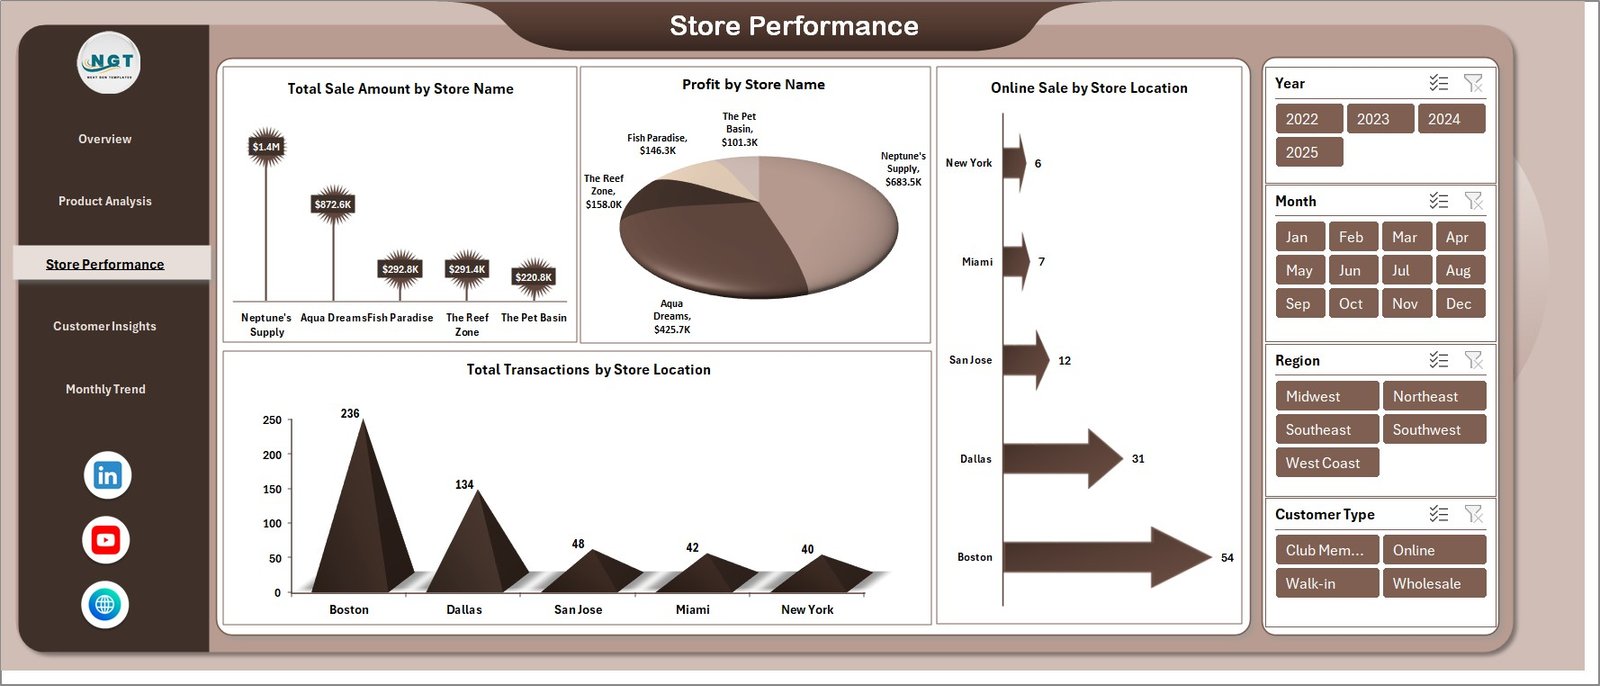
This page helps you evaluate store-level performance.
📊 Charts Included:
-
Total Sale Amount by Store Name
-
Profit by Store Name
-
Online Sale by Store Location
-
Total Transactions by Store Location
👉 Therefore, you can compare store performance and optimize operations.
👥 4. Customer Insights – Understand Your Customers Better
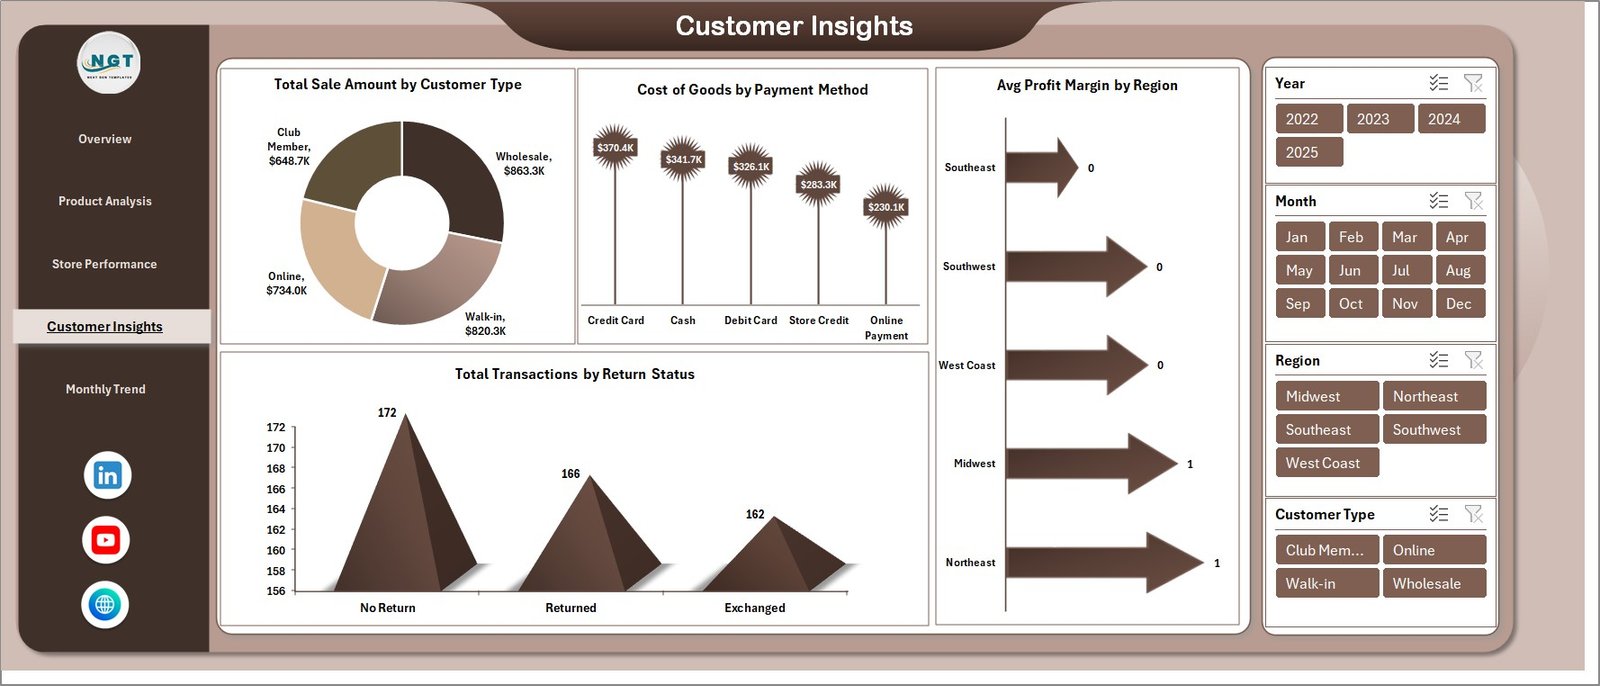
The Customer Insights Page provides deep insights into customer behavior.
📊 Charts Included:
-
Total Sale Amount by Customer Type
-
Cost of Goods by Payment Method
-
Avg. Profit Margin by Region
-
Total Transactions by Return Status
👉 As a result, you can improve customer experience and retention.
📅 5. Monthly Trends – Track Business Growth Over Time
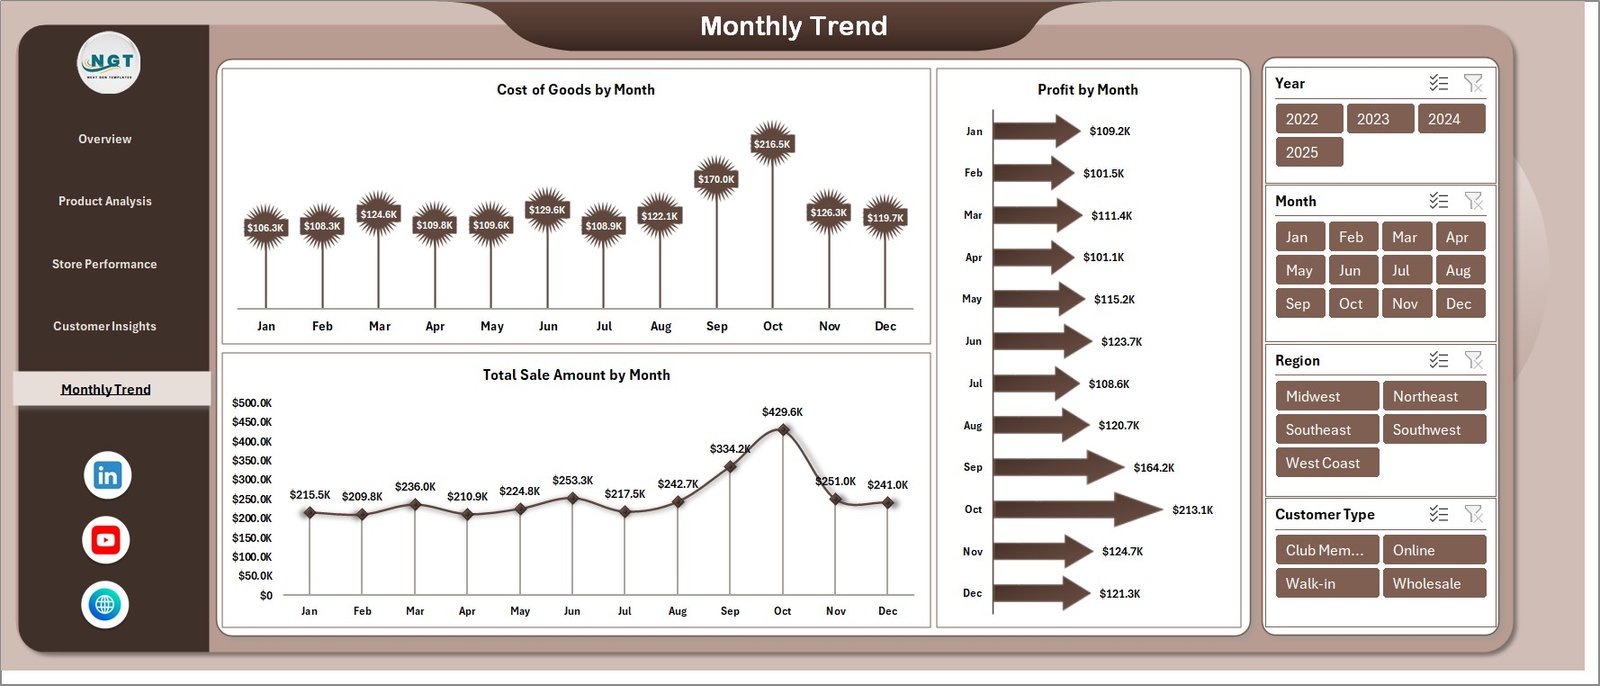
This page helps you monitor trends and performance over time.
📊 Charts Included:
-
Cost of Goods by Month
-
Profit by Month
-
Total Sale Amount by Month
👉 Therefore, you can identify seasonal trends and growth patterns.
🌟 Advantages of Aquatic Pet Stores Dashboard in Excel
Using this dashboard provides several benefits.
💡 Key Advantages:
-
Centralized Data Management
You manage all store data in one place. -
Improved Decision Making
You get clear insights for faster decisions. -
Better Sales Tracking
You monitor revenue and transactions easily. -
Enhanced Customer Insights
You understand customer preferences and behavior. -
Time-Saving Solution
You reduce manual work and errors. -
Easy Customization
You can tailor the dashboard to your needs.
⚙️ How to Use the Aquatic Pet Stores Dashboard?
Using this dashboard is simple and efficient.
📌 Step-by-Step Guide:
-
Enter Data in Data Sheet
Input sales, product, and customer data. -
Update Support Sheet
Maintain categories like product type, region, and store. -
Use Page Navigator
Switch between pages easily. -
Apply Filters (Slicers)
Analyze data by category, store, or region. -
Review KPI Cards
Monitor key business metrics. -
Analyze Charts
Identify trends and insights.
👉 As a result, you can quickly turn data into actionable decisions.
Click to Purchases Aquatic Pet Stores Dashboard in Excel
📊 Best Practices for the Aquatic Pet Stores Dashboard
To maximize performance, follow these best practices:
✅ Best Practices:
-
Keep your data updated regularly
-
Focus on key performance indicators
-
Use filters for detailed analysis
-
Monitor monthly trends consistently
-
Compare store and product performance
-
Keep the dashboard clean and simple
👉 Therefore, you ensure accurate and meaningful insights.
🔍 Opportunities for Improvement in Aquatic Pet Store Analytics
Even with a dashboard, continuous improvement is essential.
💡 Areas to Improve:
-
Optimize product pricing
-
Reduce cost of goods
-
Improve customer satisfaction
-
Increase online sales
-
Minimize product returns
👉 As a result, your business can grow faster and more efficiently.
👥 Who Can Benefit from This Dashboard?
This dashboard is ideal for various users.
🎯 Ideal Users:
-
Pet Store Owners
-
Retail Managers
-
Business Analysts
-
Inventory Managers
-
Franchise Owners
👉 Therefore, anyone managing aquatic pet stores can benefit from this tool.
🔮 Future of Retail Analytics for Pet Stores
Retail analytics continues to evolve. Therefore, dashboards will play a key role.
With advanced tools:
-
You can predict customer behavior
-
You can optimize inventory
-
You can automate reporting
-
You can improve profitability
👉 As a result, data-driven retail management will become the standard.
📝 Conclusion
The Aquatic Pet Stores Dashboard in Excel is a powerful and user-friendly tool that helps you track sales, monitor costs, and analyze customer behavior.
It simplifies complex data and provides actionable insights. Moreover, it improves decision-making and boosts business performance.
If you want to grow your aquatic pet store business and make smarter decisions, this dashboard is the perfect solution. 🚀
Click to Purchases Aquatic Pet Stores Dashboard in Excel
❓ Frequently Asked Questions (FAQs)
1. What is an Aquatic Pet Stores Dashboard in Excel?
It is a tool that helps track sales, profit, customer insights, and store performance.
2. Who can use this dashboard?
Pet store owners, managers, and analysts can use it.
3. Can I customize the dashboard?
Yes, you can modify charts, KPIs, and filters.
4. Does it update automatically?
Yes, the dashboard updates when you input new data.
5. What are the key KPIs in this dashboard?
Total transactions, total sales, cost of goods, quantity sold, and customer satisfaction.
6. Is Excel required to use this dashboard?
Yes, Microsoft Excel is required.
7. How does this dashboard improve decision-making?
It provides clear insights that help you take faster and smarter actions.
Click to Purchases Aquatic Pet Stores Dashboard in Excel
Visit our YouTube channel to learn step-by-step video tutorials