Auction Tech Platforms Dashboard in Excel In today’s digital economy, auction platforms play a major role in connecting buyers and sellers across industries. From online bidding platforms to marketplace auctions, businesses generate massive amounts of data every day. They track listings, bids, sellers, revenue, platform fees, and customer satisfaction. However, when this data stays scattered across multiple spreadsheets, it becomes difficult to analyze and act on it.
As a result, many auction tech platforms struggle to identify trends, improve performance, and maximize revenue.
So, how can you manage all your auction data efficiently and make smarter business decisions?
The answer is the Auction Tech Platforms Dashboard in Excel.
This ready-to-use and fully interactive dashboard helps you track, analyze, and optimize your auction platform performance in one place. Moreover, it transforms raw data into powerful insights using charts, KPIs, and dynamic filters. Therefore, you can quickly understand platform performance, marketplace activity, and customer satisfaction trends.
In this complete guide, you will learn everything about this dashboard, including its features, benefits, usage, best practices, and FAQs.
Click to Purchases Auction Tech Platforms Dashboard in Excel
What Is an Auction Tech Platforms Dashboard in Excel?
An Auction Tech Platforms Dashboard in Excel is an advanced reporting tool designed to track key performance indicators (KPIs) for auction-based platforms.
Instead of relying on multiple reports, you can centralize all your data into one dashboard. As a result, you can:
-
Track Gross Merchandise Value (GMV)
-
Monitor total revenue and platform fees
-
Analyze listings, bids, and seller activity
-
Measure customer satisfaction
-
Identify high-performing platforms and categories
Moreover, Excel makes the dashboard flexible, easy to use, and highly customizable.
Why Do Auction Platforms Need a Dashboard?
Auction businesses operate in a fast-paced environment where data changes constantly. Therefore, manual tracking becomes inefficient.
Without a dashboard:
-
You cannot track GMV and revenue effectively
-
You miss insights into auction performance
-
You struggle to monitor marketplace activity
-
You waste time on manual reporting
However, with this Excel dashboard, you gain complete visibility into your platform performance. Consequently, you can improve efficiency and increase profitability.
Key Features of Auction Tech Platforms Dashboard
This dashboard comes with powerful features that make it highly effective and user-friendly.
📌 Page Navigator
The Page Navigator is located on the left side. It allows you to switch between different analytical pages easily. Therefore, you can explore insights without confusion.
📊 Multi-Page Dashboard Structure
This dashboard includes 5 interactive pages, each designed for a specific analysis.
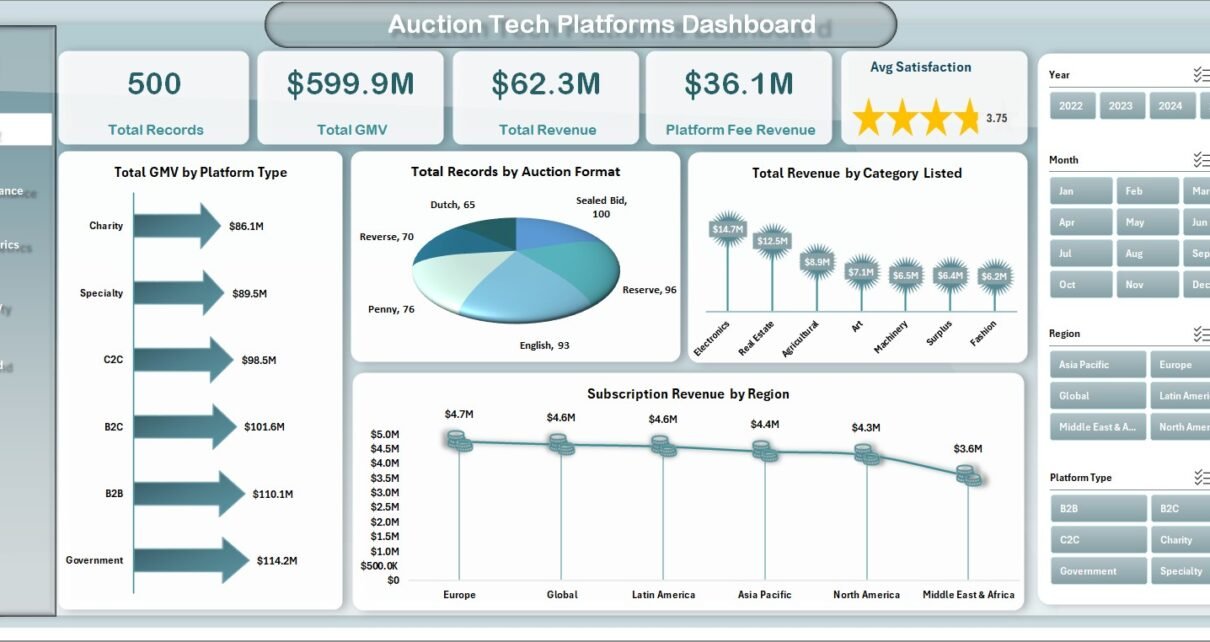
📊 1. Overview Page – Get a Quick Snapshot
The Overview Page provides a complete summary of your platform performance.

KPI Cards Included:
-
Total Records
-
Total GMV
-
Total Revenue
-
Platform Fee Revenue
-
Average Satisfaction
Charts Available:
-
Total GMV by Platform Type
-
Total Records by Auction Format
-
Total Revenue by Category Listed
-
Subscription Revenue by Region
👉 Therefore, you can quickly understand overall performance and key trends.
📊 2. Platform Performance – Which Platform Performs Best?
The Platform Performance Page helps you analyze the performance of different platforms.
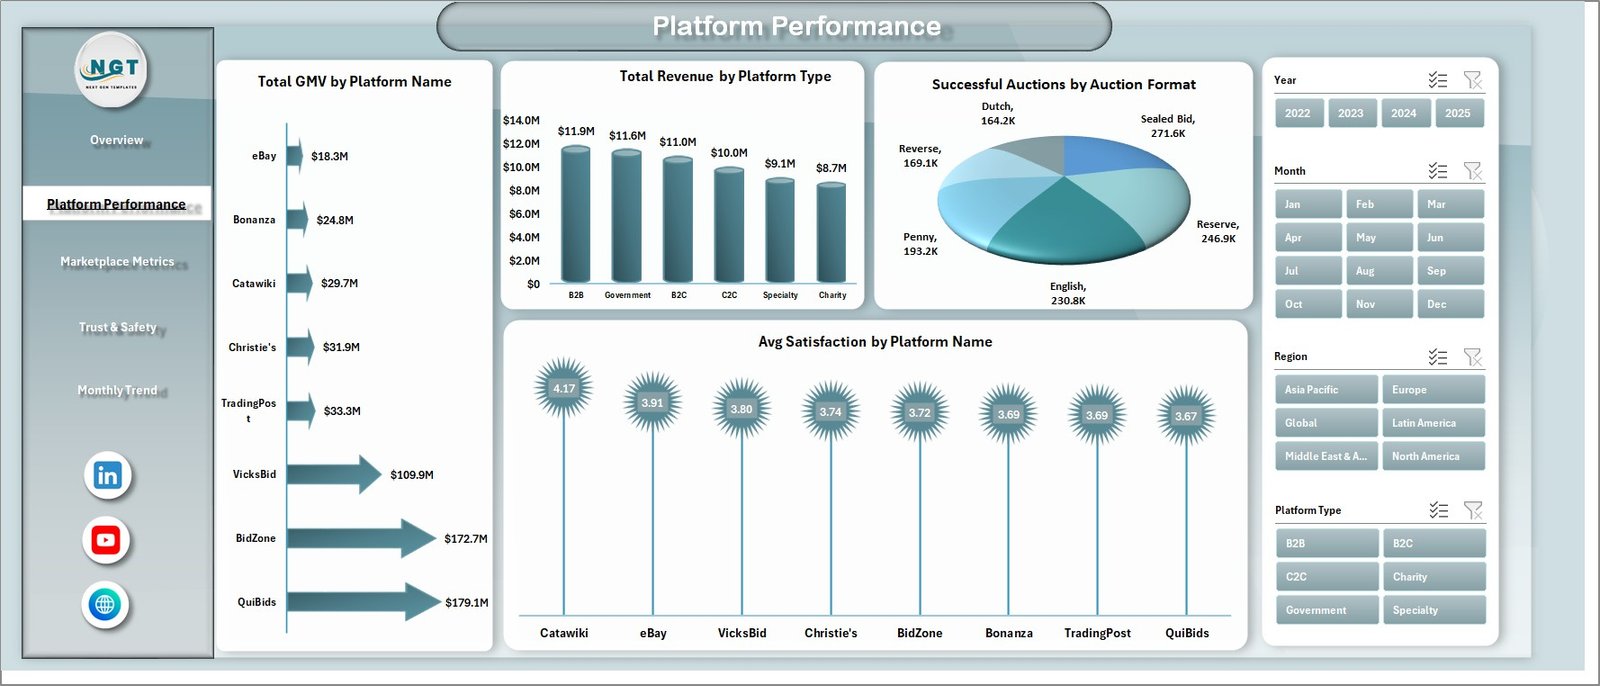
Charts Included:
-
Total GMV by Platform Name
-
Total Revenue by Platform Type
-
Successful Auctions by Auction Format
-
Avg Satisfaction by Platform Name
👉 As a result, you can identify top-performing platforms and improve weaker ones.
📊 3. Marketplace Metrics – Track Marketplace Activity
The Marketplace Metrics Page focuses on listings, bids, and seller activity.
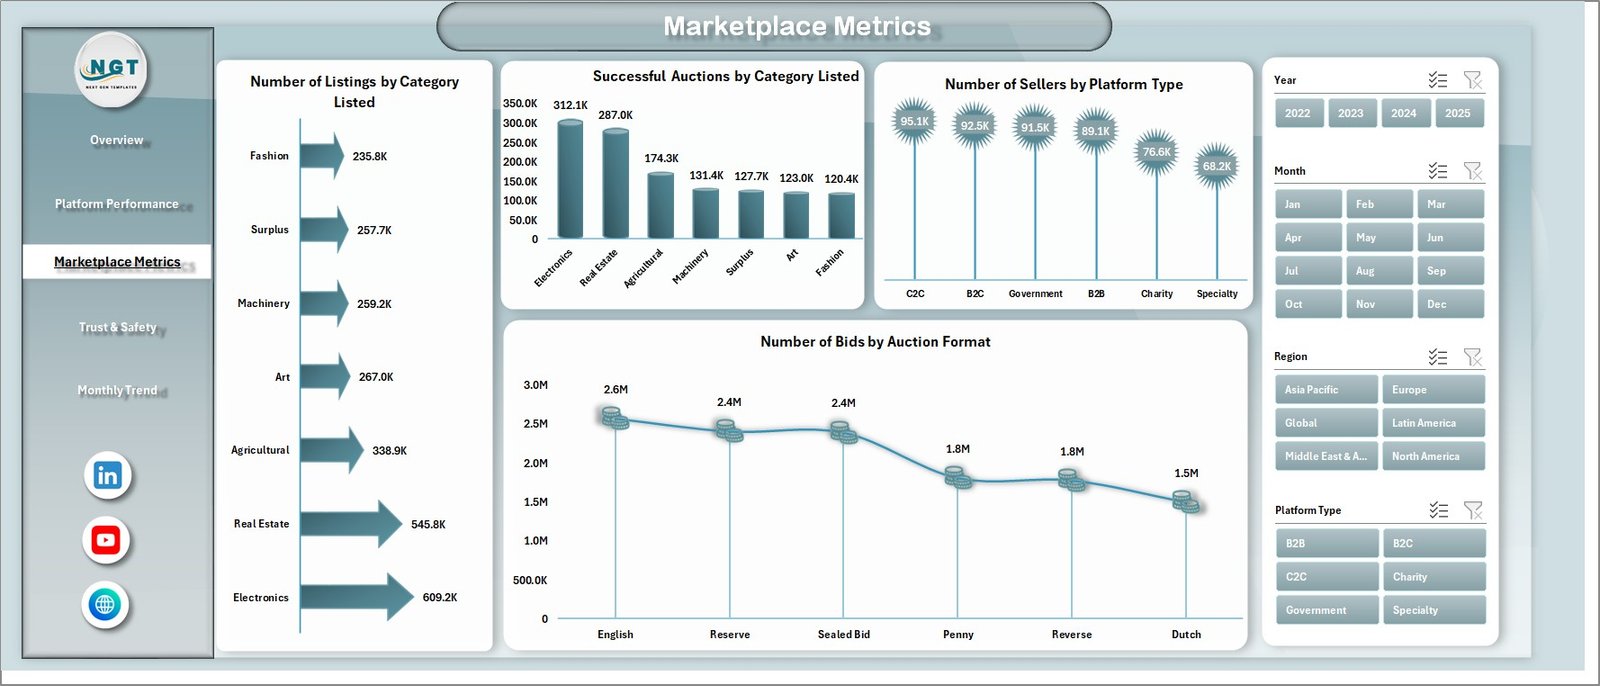
Charts Included:
-
Number of Listings by Category Listed
-
Successful Auctions by Category Listed
-
Number of Sellers by Platform Type
-
Number of Bids by Auction Format
👉 Consequently, you can understand marketplace dynamics and improve engagement.
📊 4. Trust & Safety – Monitor Platform Reliability
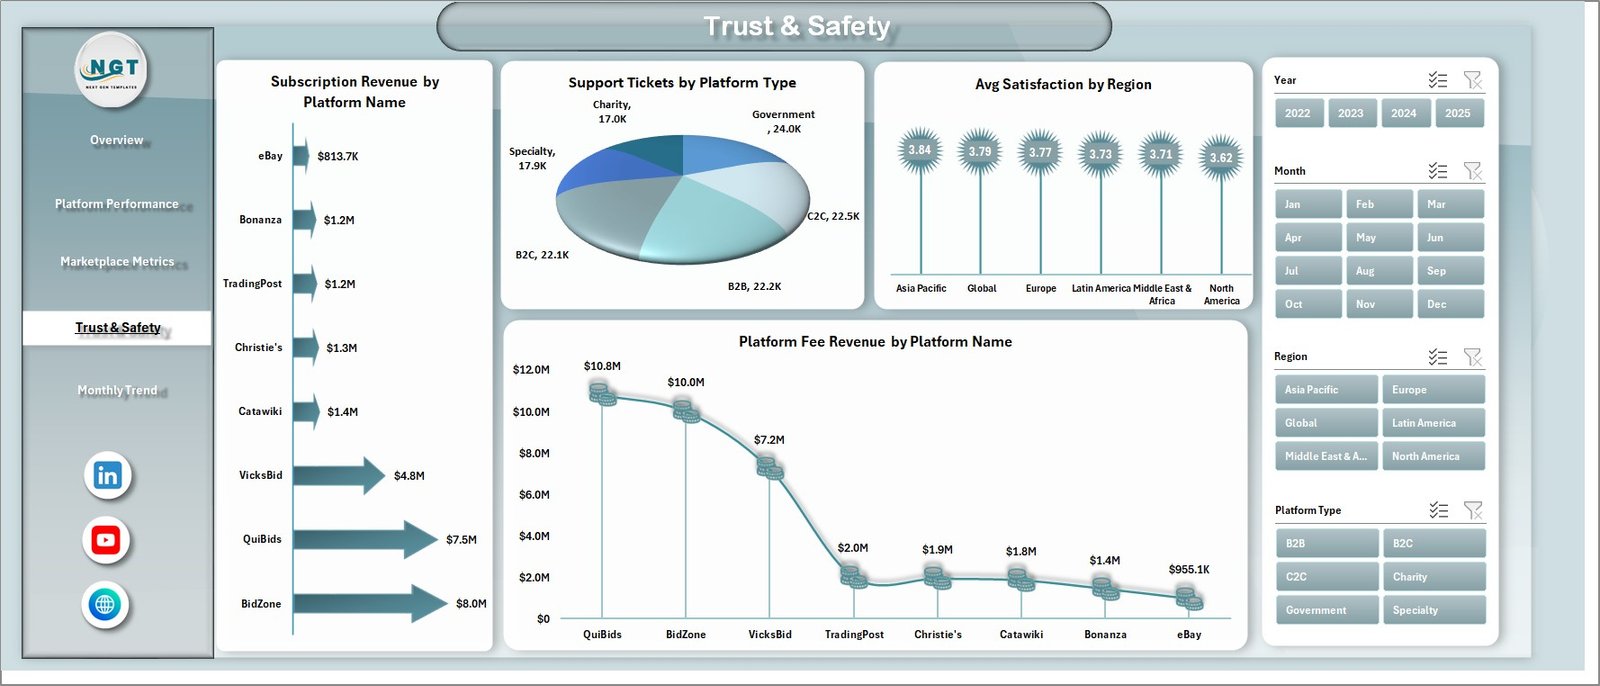
Trust and safety play a critical role in auction platforms. Therefore, this page focuses on reliability and support metrics.
Charts Included:
-
Subscription Revenue by Platform Name
-
Support Tickets by Platform Type
-
Avg Satisfaction by Region
-
Platform Fee Revenue by Platform Name
👉 As a result, you can improve customer trust and platform performance.
📊 5. Monthly Trends – Analyze Growth Over Time
The Monthly Trends Page helps you track performance trends over time.

Charts Included:
-
Total Records by Month
-
Total Revenue by Month
-
Avg Satisfaction by Month
👉 Therefore, you can identify seasonal trends and plan strategies accordingly.
📂 Support Sheet and Data Sheet
Support Sheet
This sheet contains helper data such as dropdown lists and configurations. Therefore, it ensures smooth dashboard functionality.
Data Sheet
This sheet stores all raw data, including:
-
Auction records
-
Platform details
-
Revenue and GMV
-
Seller and buyer activity
-
Satisfaction scores
👉 Once you update this sheet, the dashboard updates automatically.
Advantages of Auction Tech Platforms Dashboard
Using this dashboard provides several benefits.
✅ Better Decision-Making
You get clear insights into platform performance. Therefore, you can make faster decisions.
✅ Improved Revenue Tracking
You can monitor GMV, revenue, and platform fees. As a result, you can focus on profitable areas.
✅ Enhanced Marketplace Insights
You can track listings, bids, and sellers. Consequently, you can improve marketplace activity.
✅ Time-Saving Automation
The dashboard updates automatically. Therefore, you save time and reduce manual work.
✅ Increased Business Growth
You can identify trends and opportunities. As a result, your platform grows faster.
Click to Purchases Auction Tech Platforms Dashboard in Excel
How to Use the Auction Dashboard in Excel?
Using this dashboard is simple and effective.
Step 1: Enter Data
Go to the Data Sheet and input your data.
Step 2: Refresh Dashboard
The dashboard updates automatically after data entry.
Step 3: Apply Filters
Use slicers to analyze specific segments.
Step 4: Analyze Insights
Review charts and KPI cards to understand trends.
Step 5: Take Action
Use insights to improve performance and increase revenue.
Best Practices for the Auction Dashboard
To get the best results, follow these best practices:
🔹 Keep Data Accurate
Always ensure your data is correct and updated.
🔹 Update Regularly
Frequent updates provide better insights.
🔹 Use Filters Smartly
Analyze specific segments for deeper insights.
🔹 Monitor KPIs Consistently
Track key metrics regularly to identify issues early.
🔹 Customize Dashboard
Modify the dashboard according to your business needs.
Who Can Benefit from This Dashboard?
This dashboard is ideal for:
-
Online auction platforms
-
Marketplace businesses
-
E-commerce auction sites
-
B2B trading platforms
-
Digital marketplace operators
👉 In short, any business running auctions can benefit from this dashboard.
How Does This Dashboard Improve Business Growth?
This dashboard helps you grow your business effectively.
-
It highlights high-performing platforms
-
It identifies underperforming categories
-
It improves customer satisfaction
-
It increases revenue opportunities
Therefore, it becomes a powerful tool for scaling your platform.
Common Challenges Without a Dashboard
Without a dashboard, businesses face several issues:
-
Lack of data visibility
-
Slow decision-making
-
Manual reporting errors
-
Difficulty in tracking performance
However, this dashboard solves all these problems efficiently.
Conclusion
The Auction Tech Platforms Dashboard in Excel is a powerful tool that helps you manage and analyze your auction platform data effectively. It simplifies complex data, provides actionable insights, and supports better decision-making.
Moreover, it saves time, improves efficiency, and boosts revenue. Therefore, if you want to take your auction platform to the next level, this dashboard is the perfect solution.
Frequently Asked Questions (FAQs)
❓ What is an Auction Dashboard in Excel?
It is a tool that helps track GMV, revenue, and auction performance using interactive charts and KPIs.
❓ Is this dashboard easy to use?
Yes, it is user-friendly and requires basic Excel knowledge.
❓ Can I customize this dashboard?
Yes, you can modify it according to your business needs.
❓ Do I need advanced Excel skills?
No, basic Excel knowledge is enough to use this dashboard.
❓ How often should I update the data?
You should update data regularly for accurate insights.
❓ Can it track multiple platforms?
Yes, it can track multiple auction platforms easily.
Click to Purchases Auction Tech Platforms Dashboard in Excel
Visit our YouTube channel to learn step-by-step video tutorials