In today’s fast-evolving mobility industry, autonomous vehicles generate massive amounts of data every second. From fuel consumption to maintenance costs and revenue generation, businesses must manage complex datasets to stay competitive. However, when this data remains scattered across systems, it becomes difficult to extract meaningful insights.
So, how can you track vehicle performance, control costs, and improve operational efficiency in real time?
👉 The answer is the Autonomous Vehicles Dashboard in Power BI.
This powerful and interactive dashboard transforms raw fleet data into clear, visual insights. As a result, you can monitor key metrics, identify trends, and make faster, smarter decisions. In this comprehensive guide, you will learn everything about this dashboard, including its features, advantages, best practices, and frequently asked questions.
Click to Purchases Autonomous Vehicles Dashboard in Power BI
📊 What is an Autonomous Vehicles Dashboard in Power BI?
An Autonomous Vehicles Dashboard in Power BI is a dynamic data visualization tool designed to analyze and monitor fleet performance in real time.
Instead of relying on manual reports, this dashboard allows you to:
- 🚗 Track total vehicles and fleet size
- ⚡ Monitor fuel/energy costs
- 🔧 Analyze maintenance expenses
- 💸 Evaluate operating costs
- 💰 Measure revenue generation
Therefore, you can make data-driven decisions and improve overall fleet efficiency.
🚀 Why Do You Need an Autonomous Vehicles Dashboard?
Managing autonomous vehicle data without proper tools can lead to inefficiencies. However, with a Power BI dashboard, you gain full control over your data.
Because:
- You centralize all data in one place
- You reduce manual reporting efforts
- You get real-time insights
- You improve decision-making speed
As a result, your business becomes more efficient and competitive.
📌 Key Features of Autonomous Vehicles Dashboard in Power BI
This dashboard includes 5 powerful analytical pages, each designed to provide deep insights into your fleet operations.
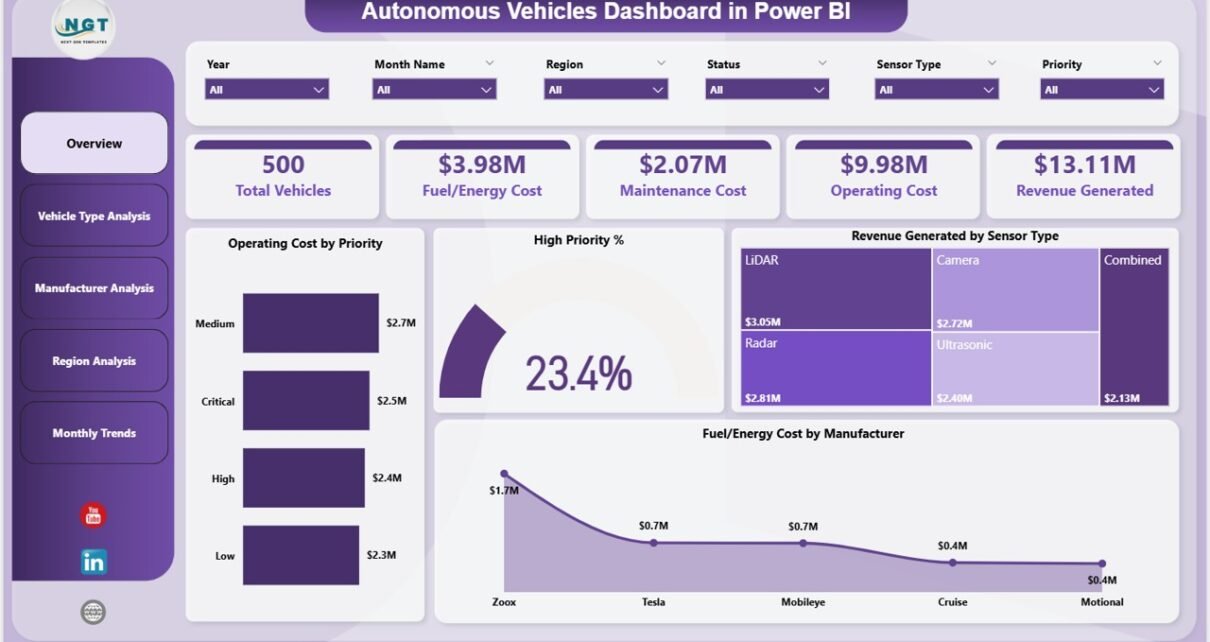
🧭 1. Overview Page – Get a Complete Snapshot
The Overview Page provides a high-level summary of your autonomous vehicle operations.
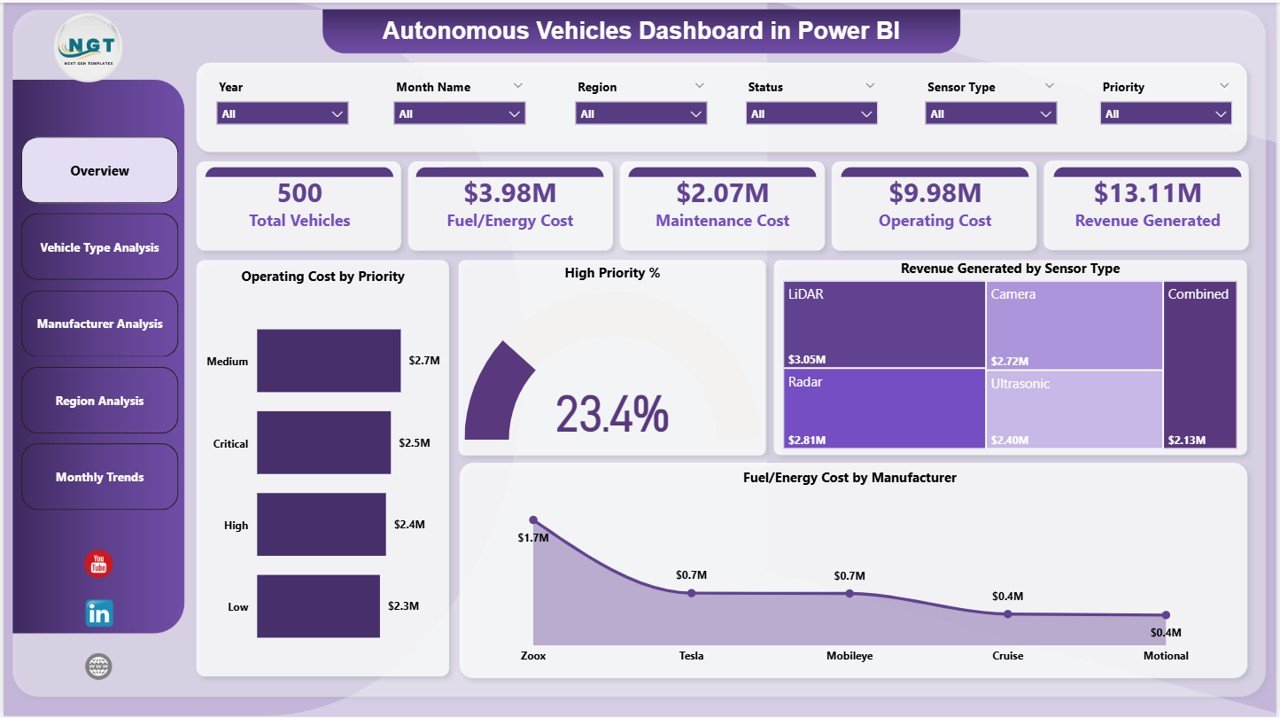
🔢 KPI Cards:
- 🚗 Total Vehicles
- ⚡ Fuel / Energy Cost
- 🔧 Maintenance Cost
- 💸 Operating Cost
- 💰 Revenue Generated
📊 Charts:
- Operating Cost by Priority
- High Priority %
- Revenue Generated by Sensor Type
- Fuel/Energy Cost by Manufacturer
👉 Therefore, this page helps you quickly understand your business performance.
🚘 2. Vehicle Type Analysis – Which Vehicles Perform Best?
The Vehicle Type Analysis Page focuses on analyzing different types of vehicles.
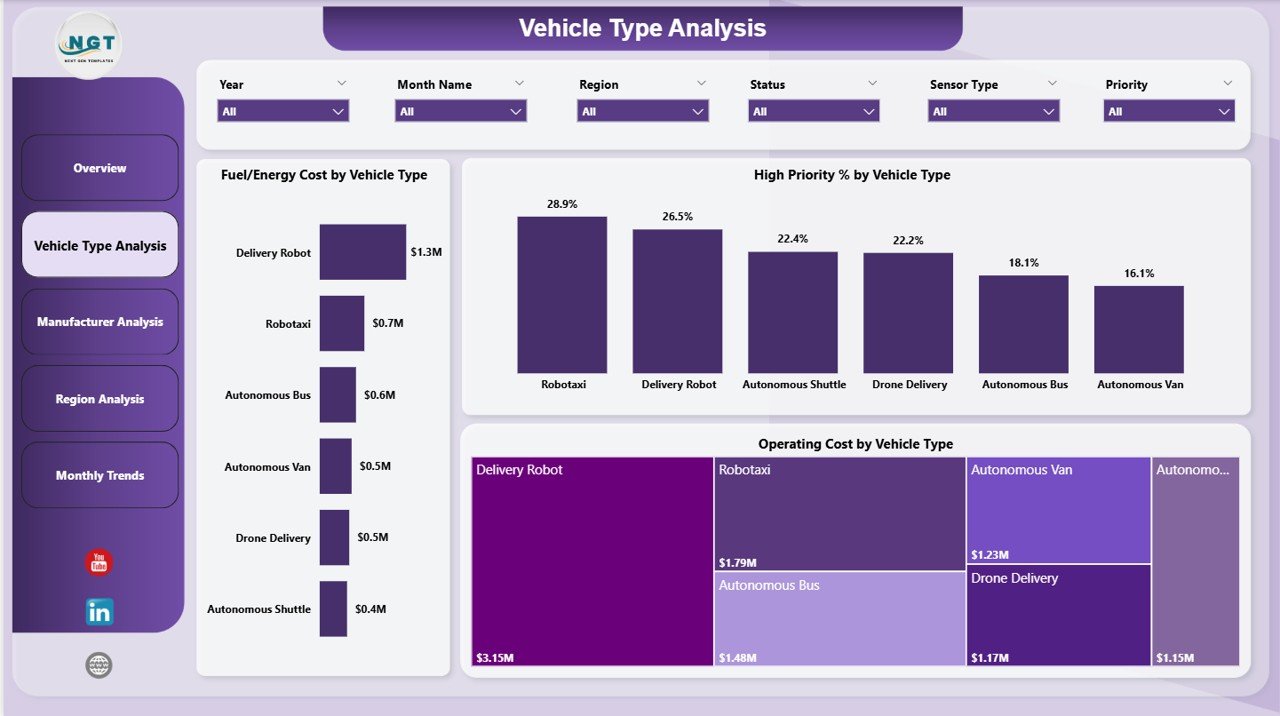
📊 Charts:
- Fuel/Energy Cost by Vehicle Type
- High Priority % by Vehicle Type
- Operating Cost by Vehicle Type
👉 As a result, you can identify which vehicle types are cost-efficient and high-performing.
🏭 3. Manufacturer Analysis – Which Manufacturer is Most Efficient?
The Manufacturer Analysis Page helps you compare performance across manufacturers.
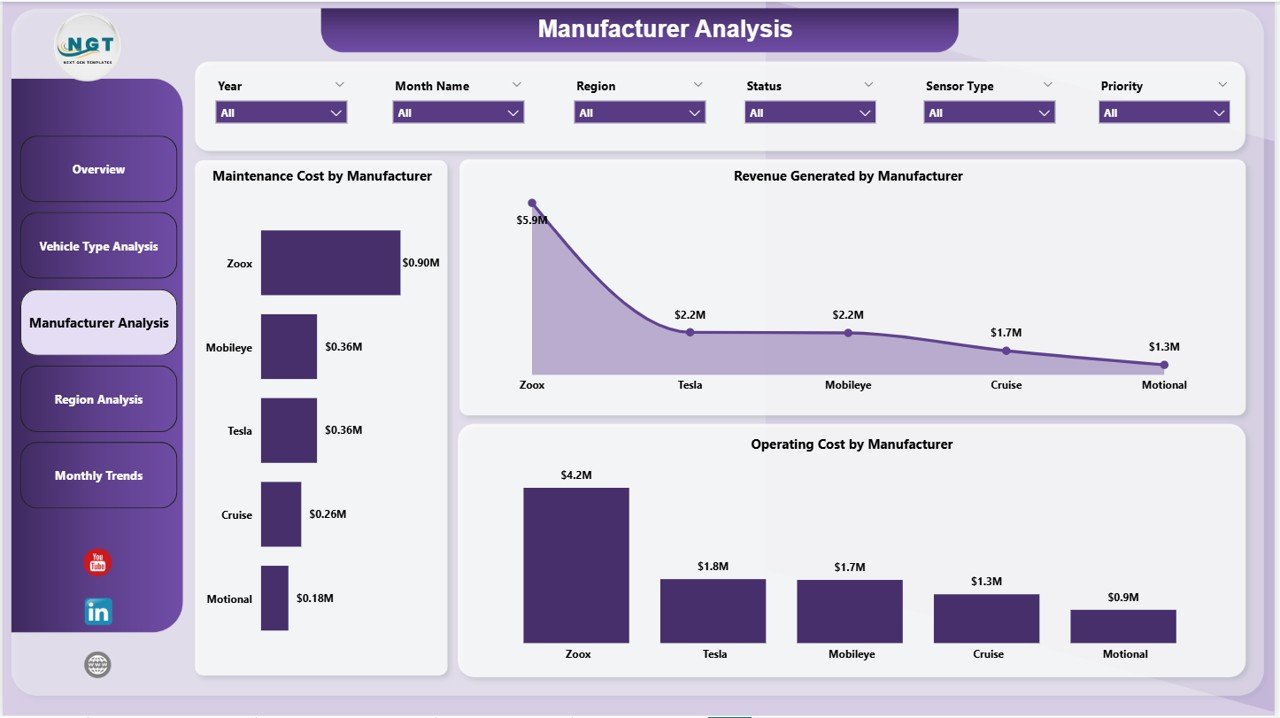
📊 Charts:
- Maintenance Cost by Manufacturer
- Revenue Generated by Manufacturer
- Operating Cost by Manufacturer
👉 Therefore, you can choose the best-performing manufacturers and optimize partnerships.
🌍 4. Region Analysis – Where is Performance Strongest?
The Region Analysis Page provides insights into regional performance.
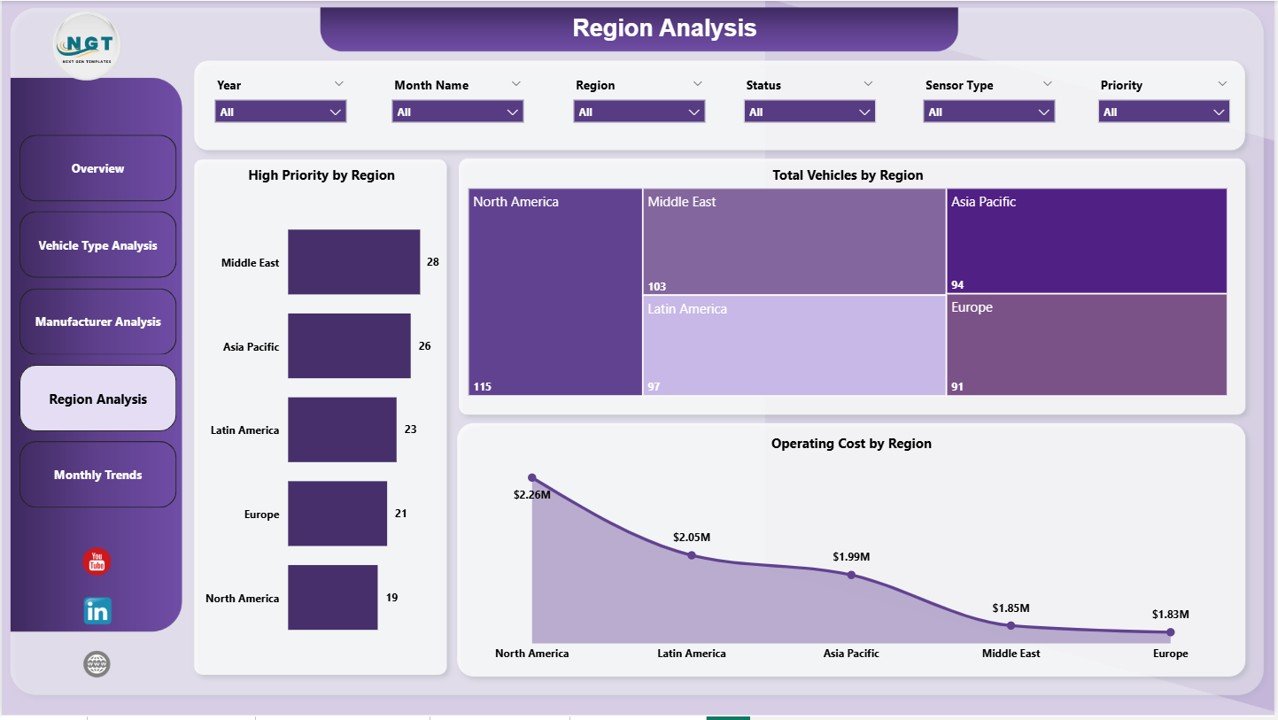
📊 Charts:
- High Priority by Region
- Total Vehicles by Region
- Operating Cost by Region
👉 As a result, you can identify high-performing regions and areas that need improvement.
📅 5. Monthly Trends – Track Performance Over Time
The Monthly Trends Page helps you analyze trends and patterns.
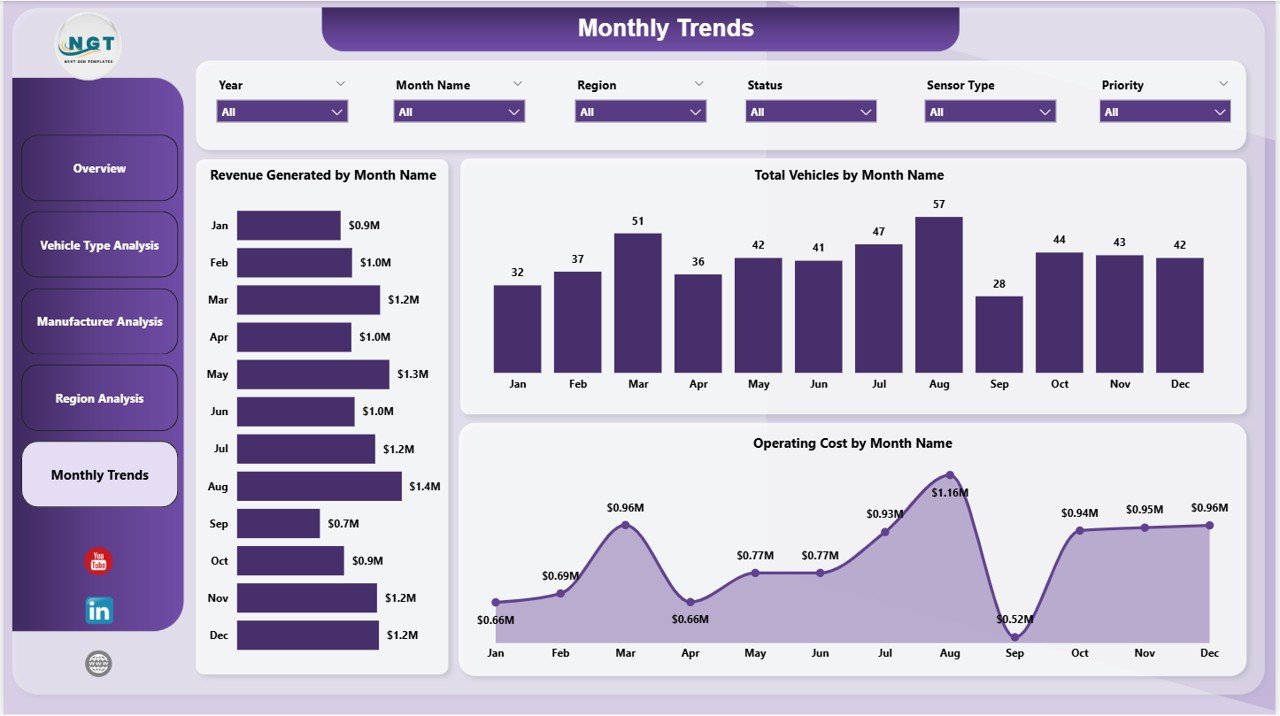
📊 Charts:
- Revenue Generated by Month
- Total Vehicles by Month
- Operating Cost by Month
👉 Therefore, you can monitor growth trends and plan future strategies effectively.
💡 How Does This Dashboard Help Your Business?
This dashboard does more than just display data—it helps you take action.
Because:
- You can monitor costs in real time
- You can improve operational efficiency
- You can optimize maintenance schedules
- You can increase revenue
As a result, your fleet operations become more efficient and profitable.
✅ Advantages of Autonomous Vehicles Dashboard in Power BI
Using this dashboard provides several key benefits:
🎯 Better Decision Making
- You get real-time insights
- You make faster decisions
💰 Cost Optimization
- You track fuel and maintenance costs
- You reduce unnecessary expenses
📊 Enhanced Data Visualization
- You simplify complex data
- You improve clarity
🚗 Improved Fleet Performance
- You monitor vehicle efficiency
- You optimize operations
📈 Increased Profitability
- You identify revenue opportunities
- You enhance financial performance
⚙️ How to Use the Autonomous Vehicles Dashboard?
Using this dashboard is simple and effective.
Step-by-Step Process:
- 📥 Import your dataset into Power BI
- 🔄 Refresh data regularly
- 🎛️ Use slicers to filter data
- 📊 Analyze each page
- 🎯 Take action based on insights
👉 Therefore, even non-technical users can easily use this dashboard.
🔥 Best Practices for the Autonomous Vehicles Dashboard
To maximize results, follow these best practices:
📌 Maintain Data Accuracy
- Always use clean and updated data
- Avoid duplicates
📊 Focus on Key KPIs
- Track only important metrics
- Avoid clutter
🔄 Update Data Regularly
- Refresh dashboards frequently
- Monitor real-time changes
🎯 Use Filters Effectively
- Apply slicers smartly
- Drill down into insights
📈 Monitor Trends
- Track monthly performance
- Identify patterns early
📉 Common Challenges and Solutions
Although dashboards are powerful, some challenges may occur.
❌ Data Overload
👉 Solution: Focus on key metrics only
❌ Inaccurate Data
👉 Solution: Maintain data quality
❌ Lack of Insights
👉 Solution: Focus on actionable insights
🎯 Who Can Benefit from This Dashboard?
This dashboard is useful for:
- 🚗 Fleet Managers
- 📊 Data Analysts
- 🏢 Automotive Companies
- 🚀 Autonomous Vehicle Startups
- 💼 Business Owners
👉 Therefore, anyone involved in fleet management can benefit from this tool.
📈 How Does It Improve Business Performance?
This dashboard directly impacts your business growth.
Because:
- You reduce operational costs
- You improve fleet utilization
- You enhance decision-making
- You increase profitability
As a result, your organization becomes more efficient and competitive.
🧠 Future of Autonomous Vehicle Analytics
The future of autonomous vehicles depends heavily on data analytics.
In the coming years:
- AI will drive smarter decisions
- Real-time analytics will become standard
- Predictive maintenance will improve efficiency
👉 Therefore, dashboards like this will become essential tools for success.
🏁 Conclusion
The Autonomous Vehicles Dashboard in Power BI is a powerful tool that simplifies complex data and provides actionable insights.
Moreover, it helps you track costs, monitor performance, and optimize operations. As a result, you can improve efficiency and increase profitability.
So, if you want to take your autonomous vehicle operations to the next level, this dashboard is a must-have solution.
Click to Purchases Autonomous Vehicles Dashboard in Power BI
❓ Frequently Asked Questions (FAQs)
1. What is an Autonomous Vehicles Dashboard in Power BI?
It is a data visualization tool that helps track vehicle performance, costs, and revenue.
2. Who should use this dashboard?
Fleet managers, analysts, and automotive companies can use it.
3. Is it beginner-friendly?
Yes, it is easy to use and requires basic Power BI knowledge.
4. What data is required?
You need data related to vehicles, costs, revenue, and regions.
5. How often should I update it?
You should update it regularly for accurate insights.
6. Can I customize the dashboard?
Yes, it is fully customizable.
7. Does it support real-time data?
Yes, Power BI supports real-time data integration.
8. How does it improve efficiency?
It provides insights that help reduce costs and improve performance.
Click to Purchases Autonomous Vehicles Dashboard in Power BI
Visit our YouTube channel to learn step-by-step video tutorials