Managing podcast data across multiple platforms can quickly become overwhelming. From tracking revenue and marketing costs to analyzing performance across countries and hosts, handling everything manually is not only time-consuming but also inefficient.
So, how can you simplify podcast analytics and make smarter business decisions?
The answer is simple — Podcast Platforms Dashboard in Power BI.
This powerful and interactive dashboard helps you monitor all key podcast metrics in one place. Moreover, it transforms complex datasets into visually appealing insights, enabling faster and more informed decisions.
Click to Purchases Podcast Platforms Dashboard in Power BI
What is a Podcast Platforms Dashboard in Power BI?
A Podcast Platforms Dashboard in Power BI is a dynamic business intelligence solution designed to analyze podcast performance across different platforms, countries, and monetization models.
Instead of relying on scattered spreadsheets, this dashboard provides a centralized view of your podcast operations. As a result, you can easily track costs, revenue, profitability, and audience engagement.
Why Should You Use This Dashboard?
If you are managing podcasts across platforms like Spotify, Apple Podcasts, or others, then this dashboard becomes an essential tool.
- It helps you track financial performance in real-time
- It simplifies multi-platform analysis
- It improves decision-making with clear visual insights
- It reduces manual reporting effort
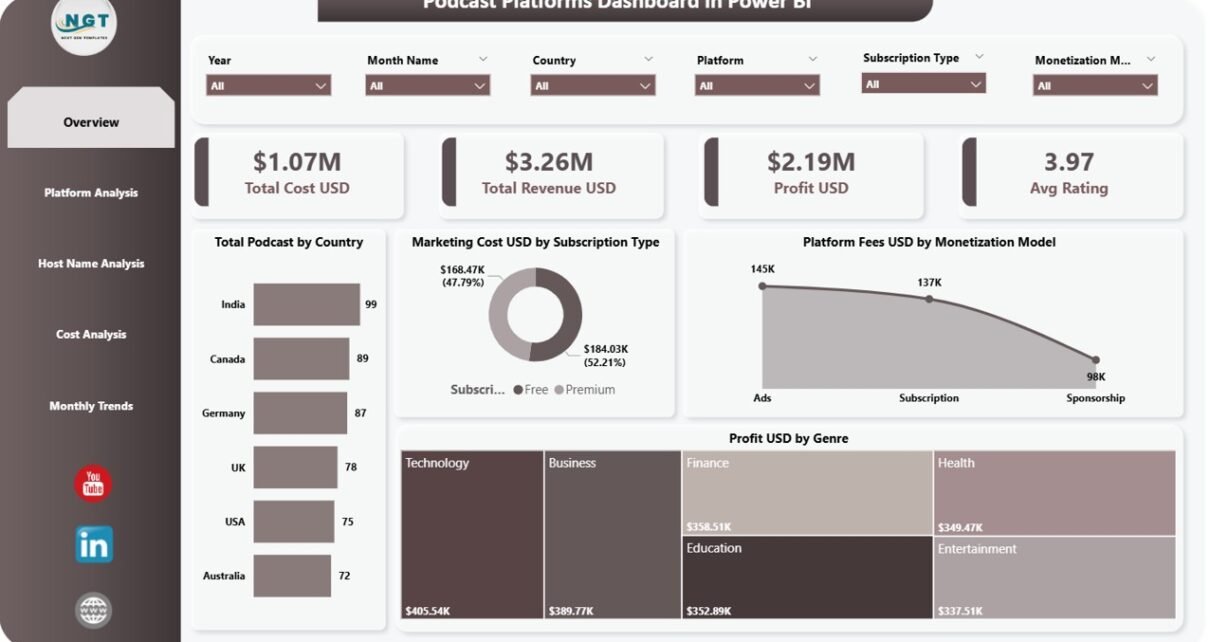
Overview Page
The Overview Page provides a high-level snapshot of your entire podcast ecosystem. At the top, you will find key KPI cards that summarize your performance instantly.
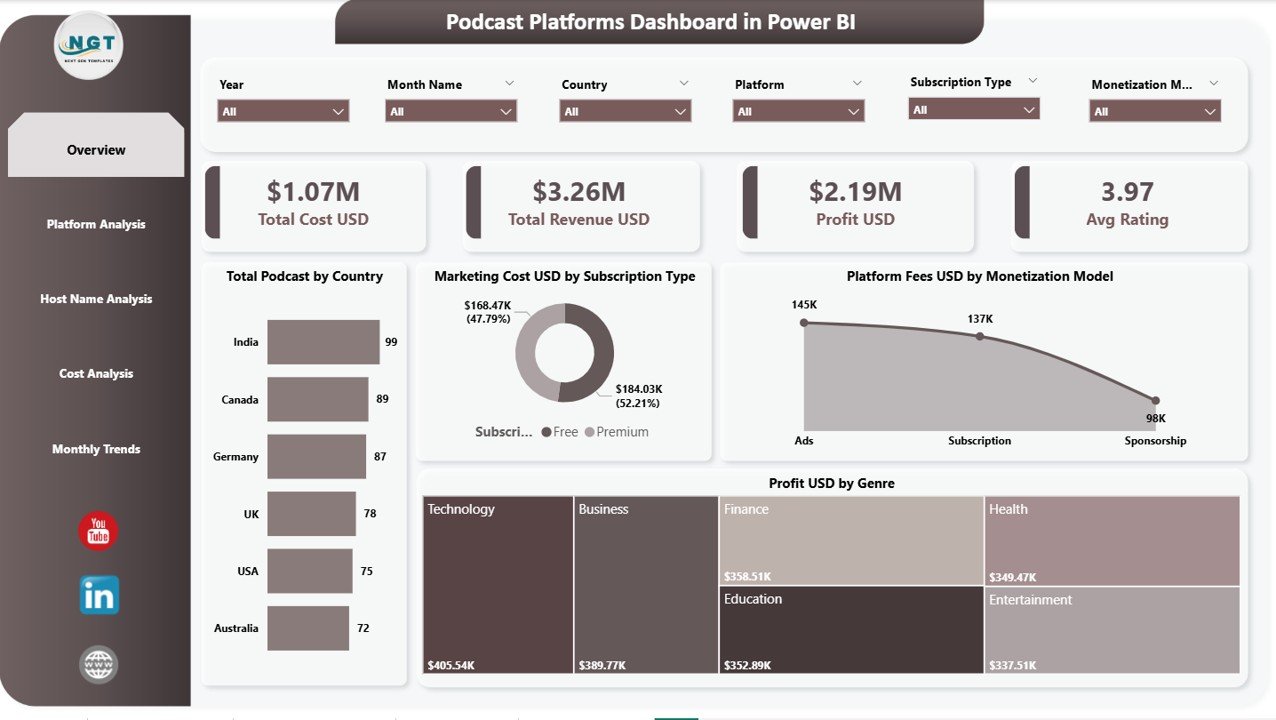
Key KPI Cards:
- Total Cost USD – Displays the total operational and production costs
- Total Revenue USD – Shows total earnings generated across platforms
- Profit USD – Calculates the net profit after deducting costs
- Avg Rating – Represents average listener rating across podcasts
Charts Explanation:
- Total Podcast by Country
This chart shows the number of podcasts distributed across different countries. It helps identify regions with the highest podcast presence and growth opportunities. - Marketing Cost USD by Subscription Type
This visualization compares marketing expenses between free and premium subscription models. It allows you to evaluate which model requires higher promotional investment. - Platform Fees USD by Monetization Model
This chart highlights fees associated with different monetization strategies such as ads, subscriptions, and sponsorships. It helps optimize cost-heavy monetization channels. - Profit USD by Genre
This treemap or chart shows profit distribution across podcast genres. It helps identify the most profitable content categories for better content planning.
Platform Analysis
The Platform Analysis Page focuses on comparing performance across different podcast platforms.
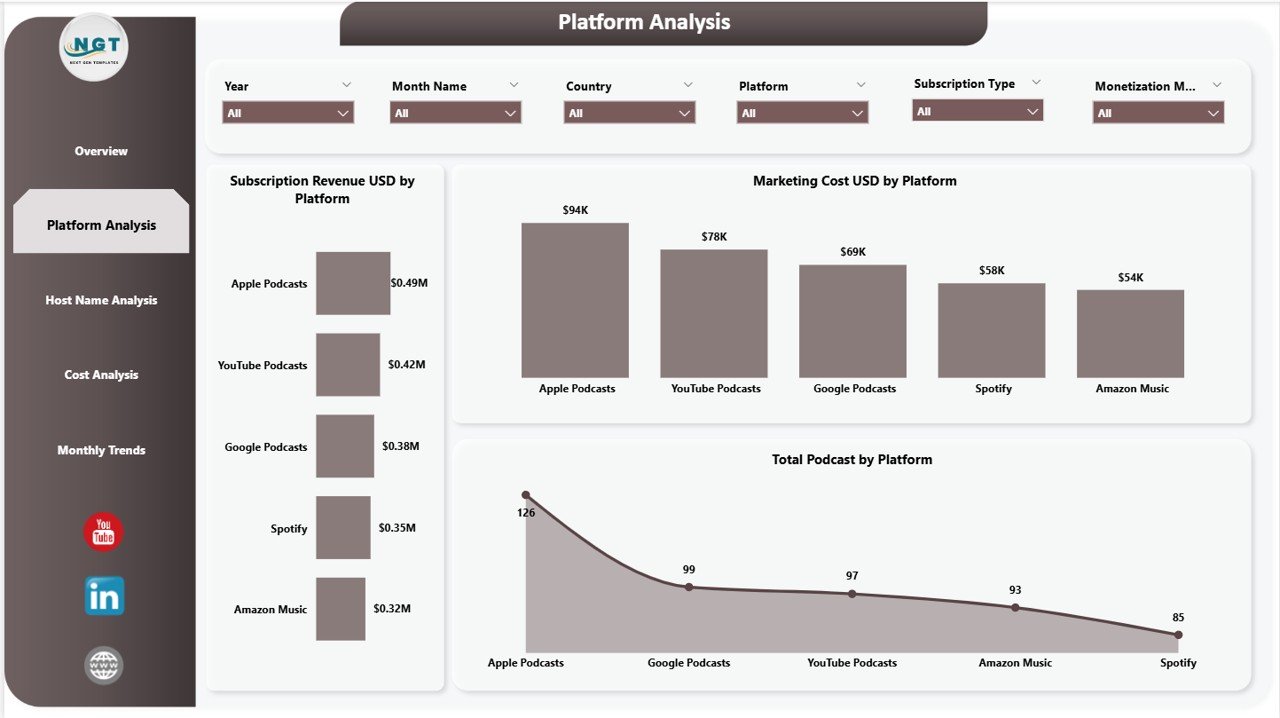
Charts Explanation:
- Subscription Revenue USD by Platform
This chart shows how much revenue each platform generates from subscriptions. It helps identify the most profitable platforms. - Marketing Cost USD by Platform
This visualization compares marketing spending across platforms. It enables better allocation of marketing budgets. - Total Podcast by Platform
This chart displays the number of podcasts hosted on each platform. It helps understand platform distribution and content strategy.
Host Name Analysis
The Host Name Analysis Page provides insights into individual podcast hosts and their performance.
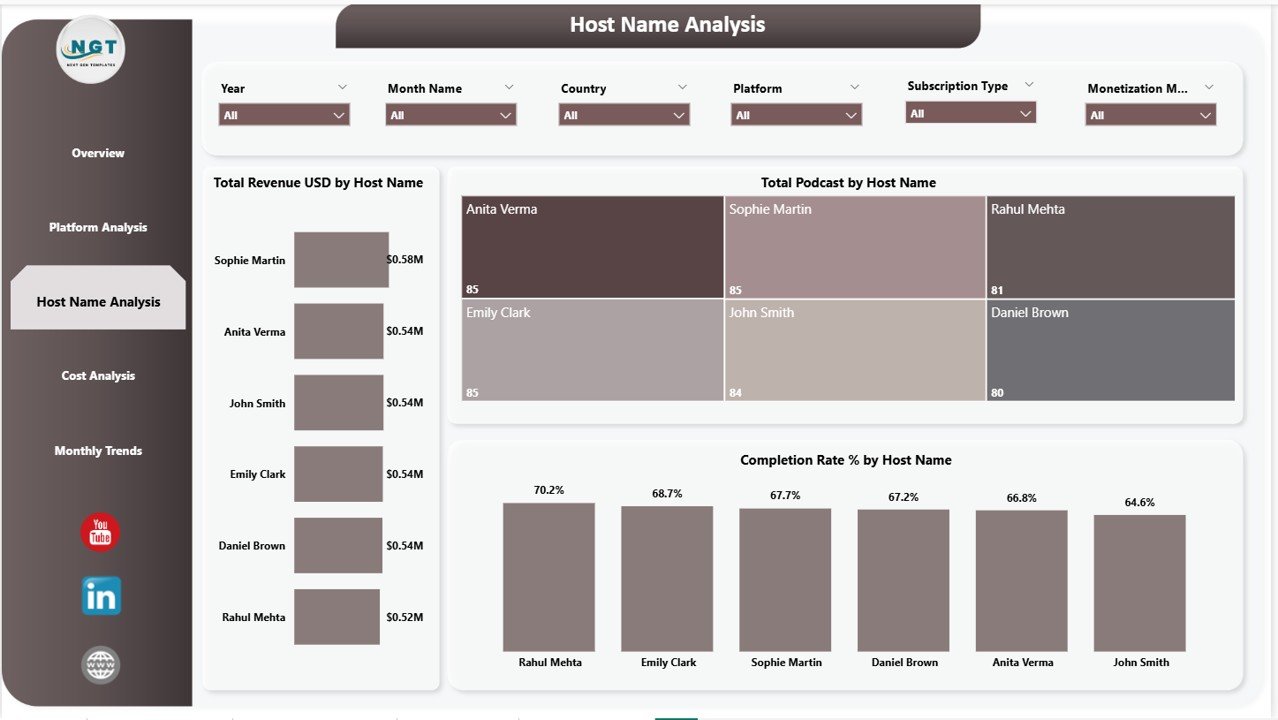
Charts Explanation:
- Total Revenue USD by Host Name
This chart shows revenue generated by each host. It helps identify top-performing creators. - Total Podcast by Host Name
This visualization highlights how many podcasts each host manages. It gives insight into workload and content volume. - Completion Rate % by Host Name
This chart measures listener engagement by showing podcast completion rates. It helps evaluate content effectiveness.
Cost Analysis
The Cost Analysis Page helps you understand cost distribution across different dimensions.
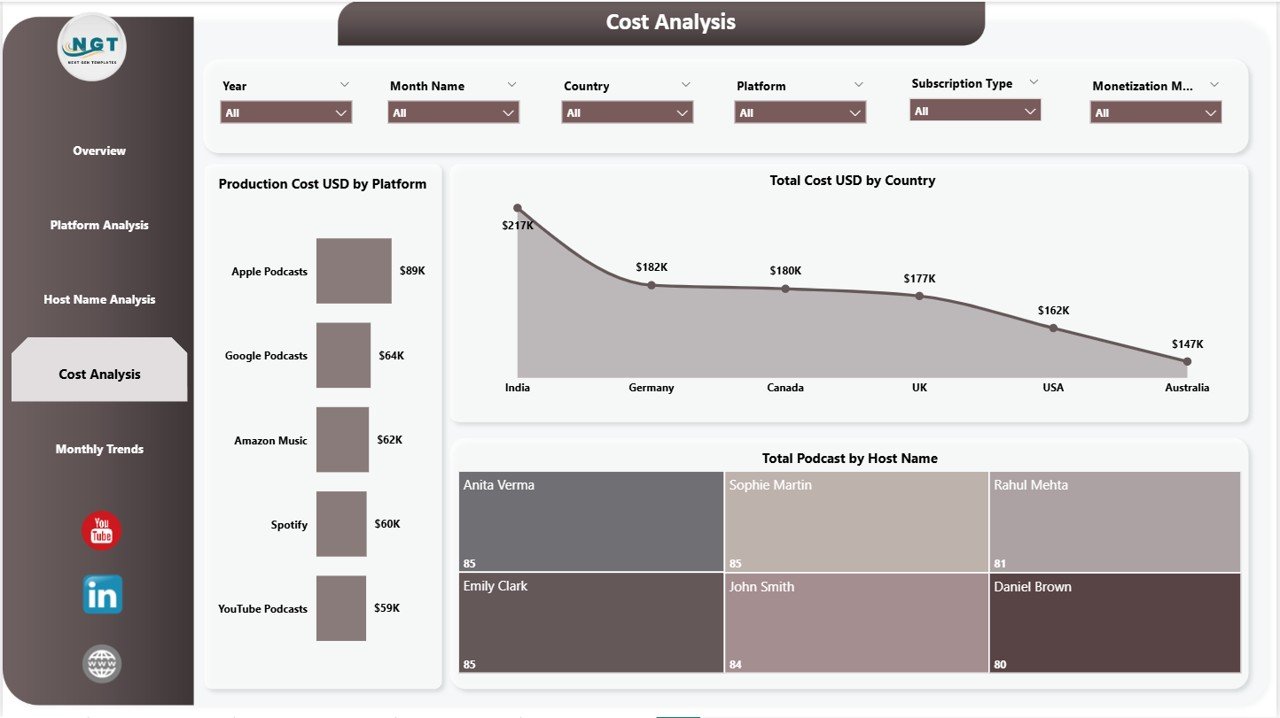
Charts Explanation:
- Production Cost USD by Platform
This chart shows production costs across platforms. It helps identify expensive platforms. - Total Cost USD by Country
This visualization highlights cost distribution by country. It helps optimize regional expenses. - Total Podcast by Host Name
This chart shows podcast count per host, helping analyze cost versus productivity.
Monthly Trends
The Monthly Trends Page focuses on time-based analysis to track performance over months.
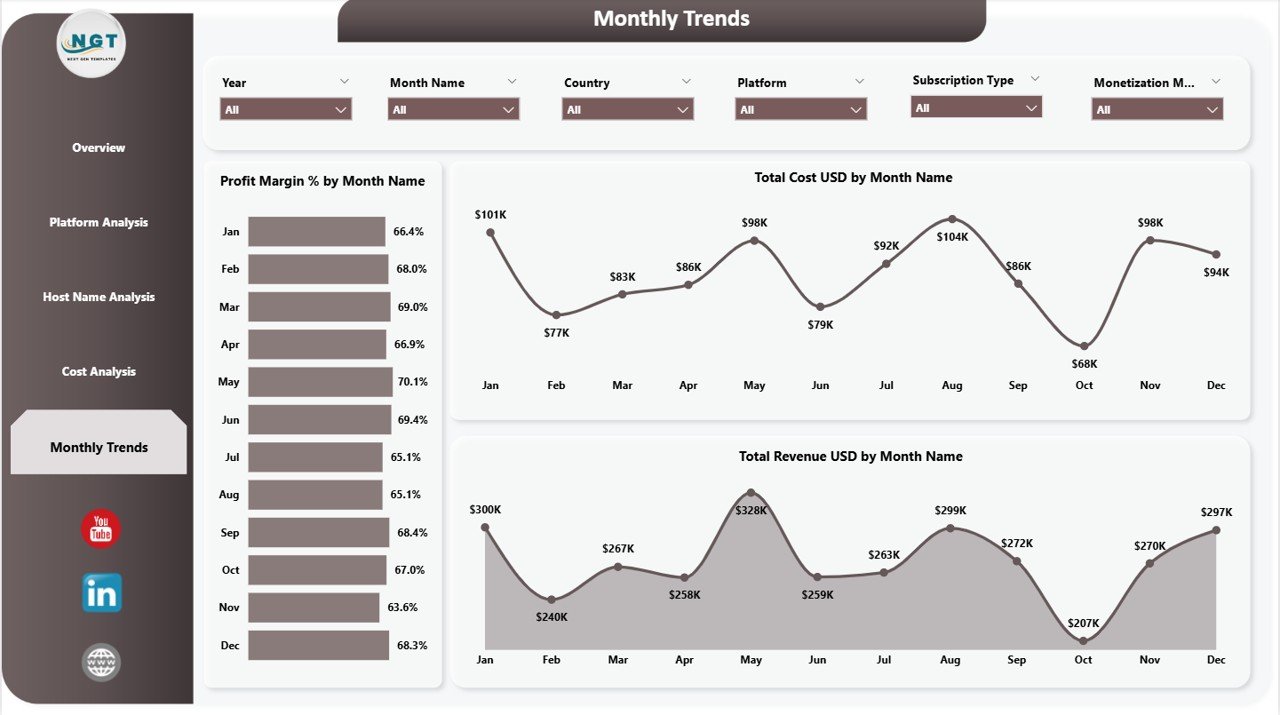
Charts Explanation:
- Profit Margin % by Month Name
This chart shows how profit margins fluctuate over time. It helps identify seasonal profitability trends. - Total Cost USD by Month Name
This visualization tracks monthly costs, helping monitor expense trends. - Total Revenue USD by Month Name
This chart displays revenue trends over time, helping forecast future growth.
Advantages of Podcast Platforms Dashboard in Power BI
- Provides a centralized view of all podcast data
- Helps track profitability and cost efficiency
- Enables real-time performance monitoring
- Improves decision-making with visual insights
- Reduces manual reporting workload
Opportunities for Improvement
- Integrate real-time streaming data sources
- Add advanced predictive analytics
- Include listener demographics analysis
- Enhance custom filtering options
- Automate data refresh schedules
Best Practices for Using This Dashboard
- Keep your data updated regularly
- Use slicers to filter insights effectively
- Focus on key KPIs for quick decisions
- Compare trends month-over-month
- Monitor both cost and revenue together
Frequently Asked Questions (FAQs)
What is the main purpose of this dashboard?
It helps analyze podcast performance, revenue, costs, and engagement across platforms.
Can beginners use this dashboard?
Yes, the dashboard is user-friendly and designed for both beginners and professionals.
Does it support multiple platforms?
Yes, it allows analysis across multiple podcast platforms.
Can I customize this dashboard?
Absolutely, you can modify visuals, KPIs, and filters as per your needs.
Conclusion
The Podcast Platforms Dashboard in Power BI is a powerful solution for anyone managing podcasts across multiple platforms. It simplifies complex data, provides actionable insights, and helps you make smarter decisions faster.
If you want to save time, improve performance, and grow your podcast business, this dashboard is exactly what you need.
Click to Purchases Podcast Platforms Dashboard in Power BI
Visit our YouTube channel to learn step-by-step video tutorials