Cloud Migration Services Dashboard in Excel is a professionally designed, ready-to-use Excel dashboard template built for IT teams, cloud architects, project managers, and consulting firms managing cloud migration projects across multiple industries and platforms. This comprehensive dashboard includes 5 interactive analytical pages, a structured data sheet, and a support sheet with pivot tables powering all charts dynamically. It tracks 5 critical metrics — Total Budget, Total Actual Cost, Total Workloads, Total Downtime, and Total Records — giving you full visibility into your cloud migration portfolio from a single workbook.
Click here to Purchase Cloud Migration Services Dashboard in Excel
Whether you are migrating workloads to AWS, Azure, GCP, or hybrid environments, this Excel dashboard template centralizes your project data and transforms it into clear, actionable visuals. Every chart, slicer, and KPI card is connected to the underlying pivot tables, so updating your data takes just one click — go to the Data tab and hit Refresh All.
Key Features of Cloud Migration Services Dashboard in Excel
This dashboard provides multi-dimensional analysis of cloud migration projects through 5 dedicated pages, each focusing on a different analytical perspective. It includes dynamic slicers for instant filtering, budget versus actual cost comparisons, platform-level and industry-level breakdowns, and monthly timeline trend analysis. The dashboard is built entirely with Excel pivot tables and charts, requiring no macros, VBA, or add-ins — making it compatible with any modern version of Microsoft Excel.
Click here to Purchase Cloud Migration Services Dashboard in Excel
Key capabilities include 5 interactive dashboard pages with slicer-driven filtering, 5 KPI cards on the Overview page for executive-level summary, budget versus actual cost tracking by source platform and industry, workload migration analysis by target platform and migration type, timeline trends showing yearly workload counts and monthly budget patterns, client satisfaction tracking, and project status distribution. All visuals refresh automatically when you update the data and click Refresh All.
Dashboard Pages Explained
1. Overview Page
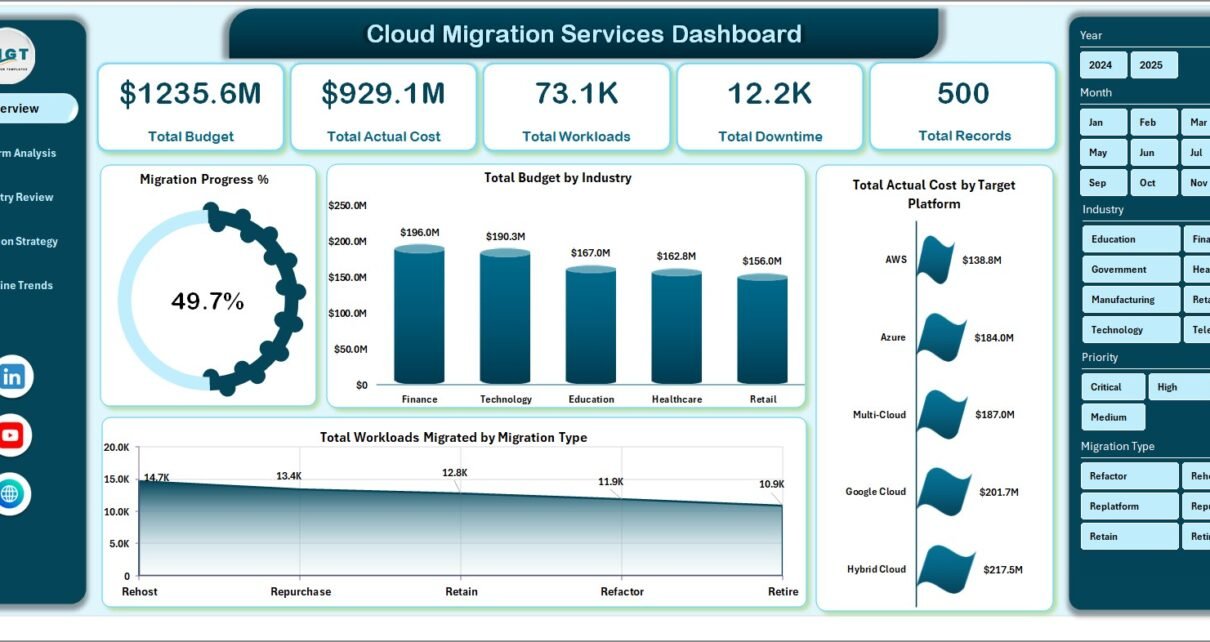
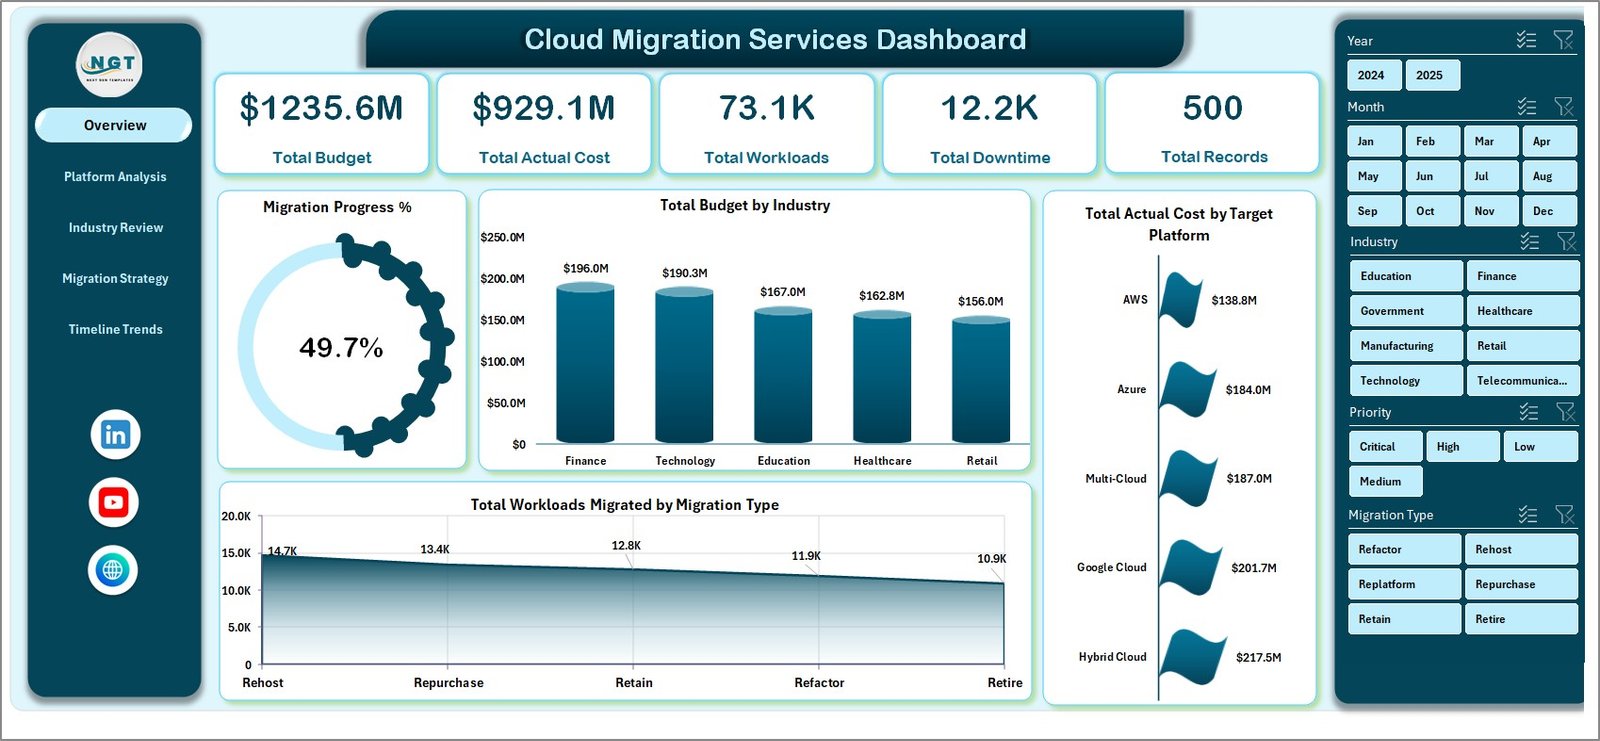
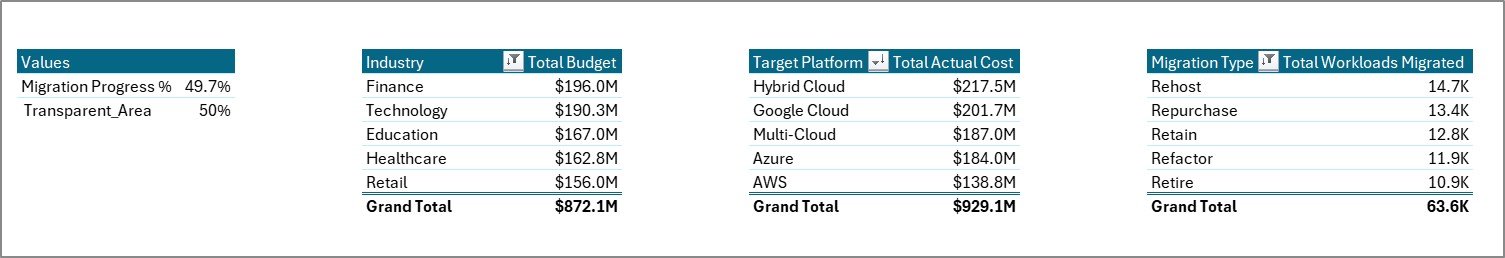
The Overview page serves as the executive command center. At the top, 5 KPI cards display Total Budget, Total Actual Cost, Total Workloads, Total Downtime, and Total Records at a glance. Below the cards, you will find charts showing Migration Progress % by Overall, Total Budget by Industry, Total Actual Cost by Target Platform, and Total Workloads Migrated by Migration Type. Multiple slicers allow you to filter the entire dashboard instantly by industry, platform, migration type, priority, or project status.
Cloud Migration Services Dashboard
2. Platform Analysis
The Platform Analysis page provides deep insights into cloud platform performance. It features charts for Total Workloads Migrated by Target Platform, Total Budget by Target Platform, Total Downtime by Source Platform, and Total Budget Vs Total Actual Cost by Source Platform. This page helps identify which target platforms receive the most workloads and where budget overruns occur at the platform level.
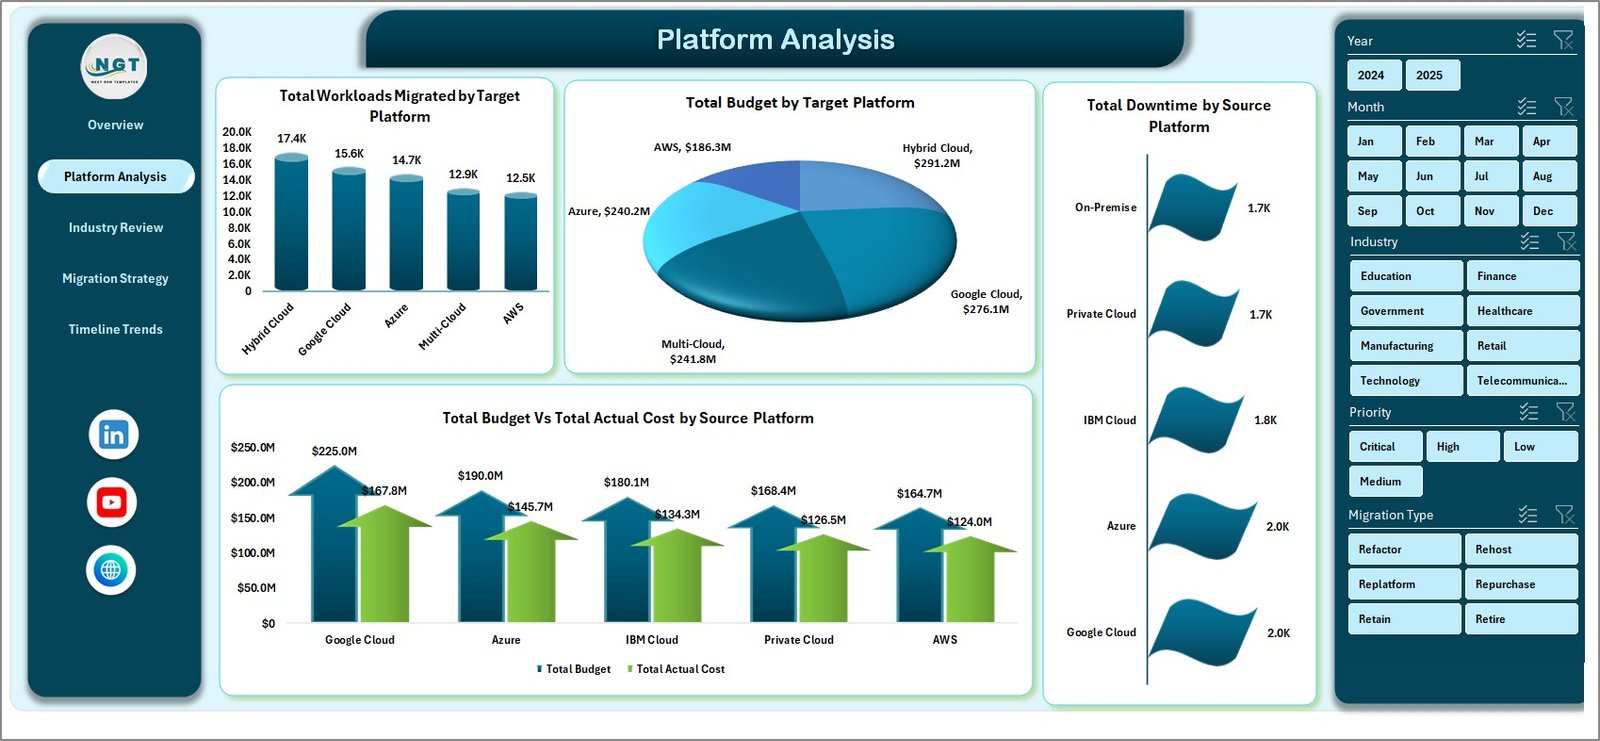
Platform Analysis
3. Industry Review
The Industry Review page breaks down migration data by industry sector. Charts include Total Downtime by Industry, Total Workloads Migrated by Industry, Total Team Members by Industry, and Total Budget Vs Total Actual Cost by Industry. This is especially valuable for consulting firms managing multi-industry portfolios who need to understand resource consumption and cost efficiency per sector.
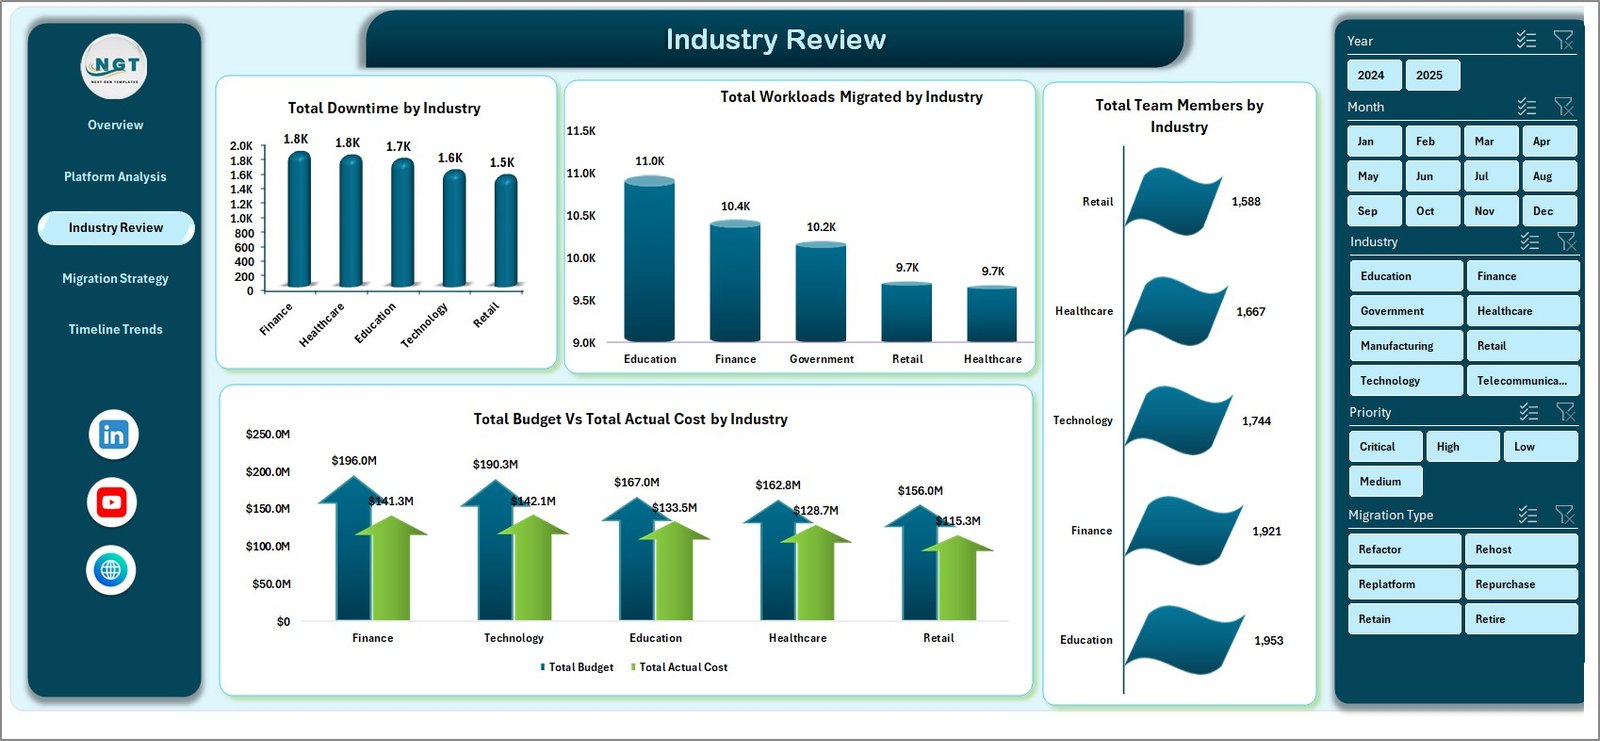
Industry Review
4. Migration Strategy
The Migration Strategy page focuses on how different migration approaches perform. It includes charts for Total Budget by Migration Type, Total Downtime by Migration Type, Total Records by Priority, and Total Budget by Priority. Use this page to evaluate whether lift-and-shift, re-platforming, or refactoring strategies deliver better cost and performance outcomes for your organization.
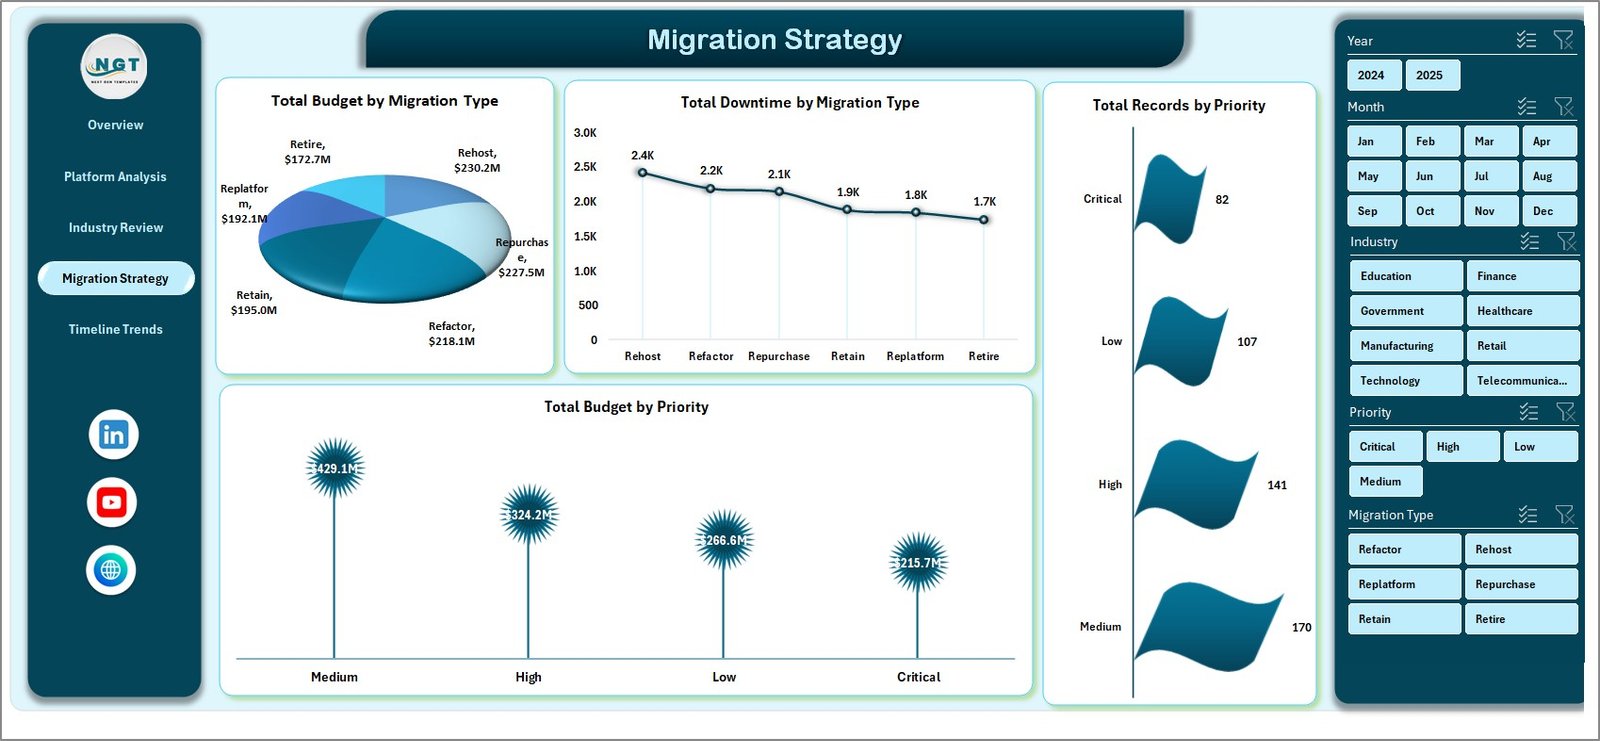
Migration Strategy
5. Timeline Trends
The Timeline Trends page tracks migration performance over time. It features charts for Total Workloads Migrated by Year, Total Budget by Month, Avg. Satisfaction by Client Name, and Total Records by Project Status. This page helps identify seasonal patterns, budget spikes, and long-term migration velocity trends across your portfolio.
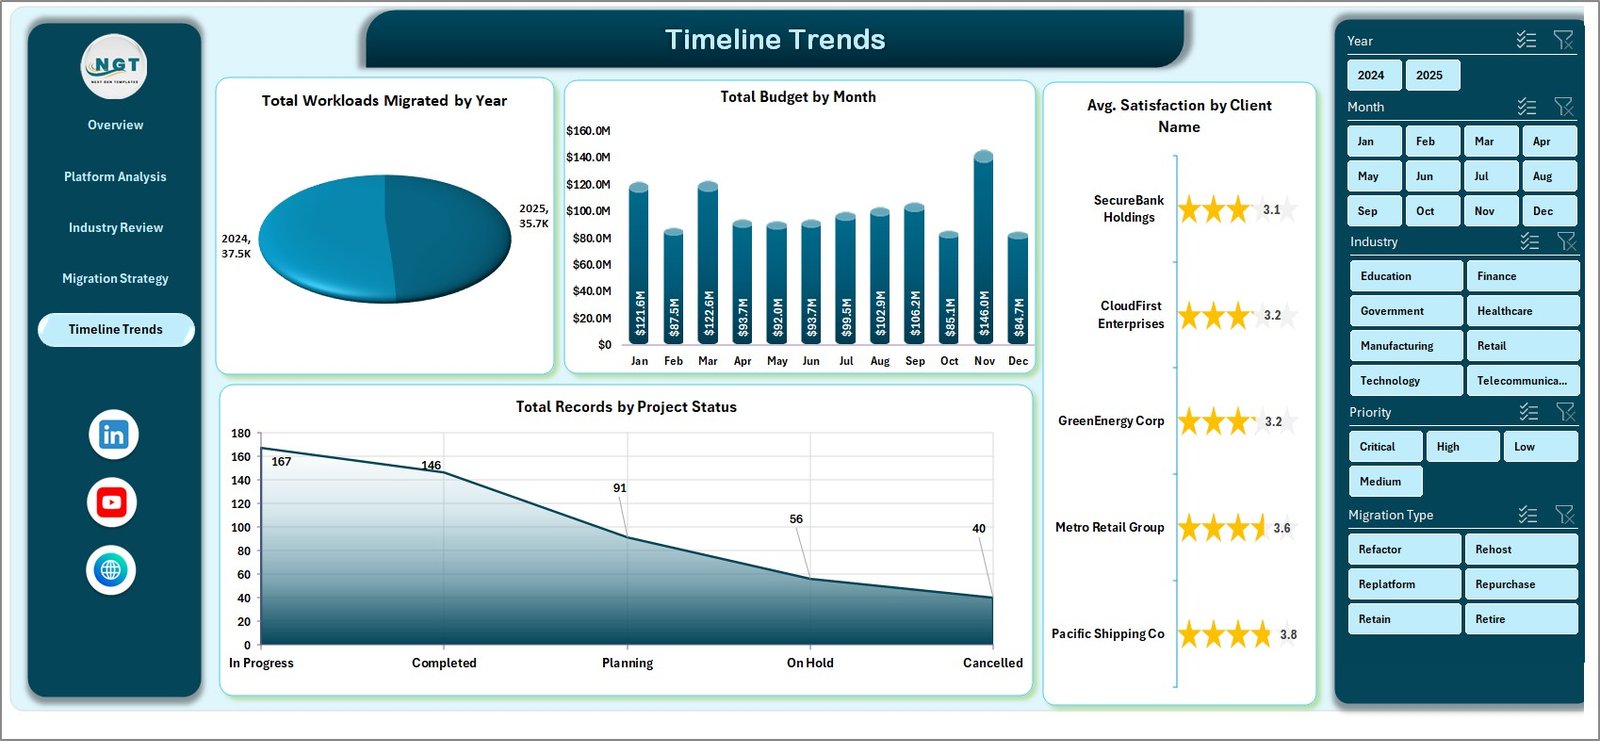
Timeline Trends
6. Data Sheet Tab
The Data Sheet is where all your cloud migration records are stored. Simply add your project data in the same structured format — including fields for Project Name, Industry, Source Platform, Target Platform, Migration Type, Budget, Actual Cost, Workloads, Downtime, Priority, Client Name, and Status. After updating, click Refresh All from the Data tab to update all pivots and charts automatically.
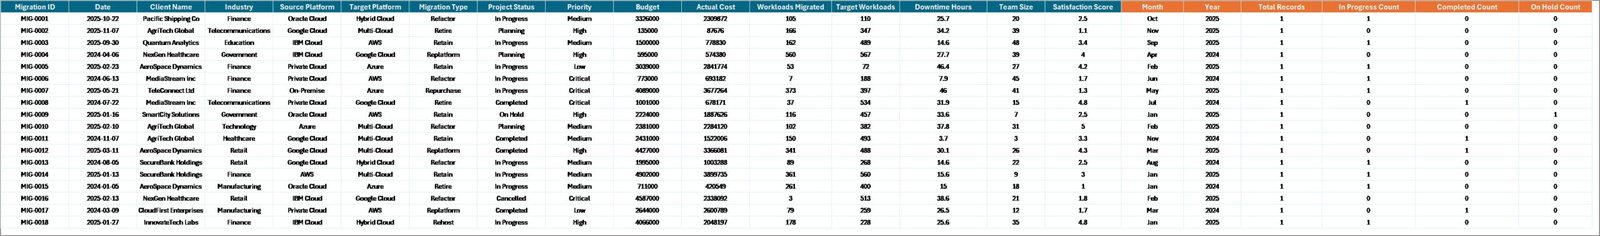
Data Sheet Tab
7. Support Sheet
The Support Sheet contains all the pivot tables that power every chart in the dashboard. After updating data in the Data Sheet, go to the Data tab in the Excel Ribbon and click Refresh All — every pivot table and chart refreshes instantly. You can keep this sheet hidden during presentations for a cleaner look.
Support Sheet Tab
Advantages of Cloud Migration Services Dashboard in Excel
This dashboard eliminates the need for expensive BI tools by delivering powerful migration analytics directly in Excel. It provides complete visibility into budget utilization, workload distribution, platform performance, and industry-level resource consumption from a single workbook. The slicer-driven filtering makes it easy for executives and project managers to drill into specific dimensions without technical skills. Since every visual is powered by pivot tables, the dashboard scales effortlessly as your data grows — just add rows to the Data Sheet and refresh.
The built-in budget versus actual cost analysis helps organizations identify cost overruns early, while the timeline trends page reveals seasonal patterns and long-term migration velocity. For consulting firms, the industry-level breakdown enables portfolio-wide performance benchmarking across clients and sectors.
Click here to Purchase Cloud Migration Services Dashboard in Excel
Opportunities for Improvement
While the dashboard covers core migration metrics comprehensively, organizations with advanced needs could extend it by adding risk scoring for each migration project, integrating automated data feeds from cloud provider APIs, adding SLA compliance tracking, or building predictive models for migration timeline estimation. For teams using Power BI, the data structure is compatible with direct import for more advanced interactive visualizations.
Best Practices
To get the most value from this dashboard, update your migration data weekly or bi-weekly to maintain accuracy. Use the slicers to focus on specific industries or platforms during stakeholder reviews. Compare budget versus actual cost regularly to catch overruns before they escalate. Review the Timeline Trends page monthly to track migration velocity and identify bottlenecks. Keep the Support Sheet hidden during presentations for a cleaner executive view, and share the workbook via OneDrive or SharePoint for real-time collaboration with your team.
Explore Relevant Templates
If you manage cloud infrastructure and digital transformation projects, explore these related templates on NextGenTemplates:
- Cloud Migration KPI Dashboard in Power BI — Track cloud migration KPIs with MTD/YTD analysis and trend charts in Power BI.
- Cloud Migration KPI Dashboard in Google Sheets — Monitor cloud migration KPIs collaboratively using Google Sheets.
- Digital Transformation Dashboard in Power BI — Track digital projects, budgets, completion rates, and cost variance.
- AI Research Labs KPI Dashboard in Power BI — Monitor AI research lab performance with KPI scorecards.
Browse all Excel Dashboard Templates on NextGenTemplates.
Click here to Purchase Cloud Migration Services Dashboard in Excel
Frequently Asked Questions
What is the best Excel dashboard for tracking cloud migration projects?
The Cloud Migration Services Dashboard in Excel is a purpose-built template that tracks Total Budget, Total Actual Cost, Total Workloads, Total Downtime, and Total Records across 5 interactive pages covering platform performance, industry breakdown, migration strategy, and timeline trends.
How do I update the data in this cloud migration dashboard?
Simply add or modify records in the Data Sheet tab, then go to the Data tab in Excel and click Refresh All. Every pivot table and chart across all 5 dashboard pages updates automatically.
Can I use this dashboard for multi-client cloud migration consulting?
Yes. The dashboard includes Client Name, Industry, and Project Status fields, making it ideal for consulting firms managing multiple cloud migration engagements across different industries and platforms.
What cloud platforms does this Excel dashboard support?
The dashboard supports any cloud platform including AWS, Microsoft Azure, Google Cloud Platform, IBM Cloud, Oracle Cloud, and hybrid environments. Simply enter your platform names in the data fields.
Do I need advanced Excel skills to use this template?
No advanced skills are required. The dashboard is fully pre-built with pivot tables, charts, and slicers. Just replace the sample data with your own records and click Refresh All to see your updated dashboard.
How many migration records can this dashboard handle?
The dashboard can handle thousands of records efficiently since it uses Excel pivot tables. As your data grows, simply add rows to the Data Sheet and refresh — the dashboard scales automatically.
Conclusion
The Cloud Migration Services Dashboard in Excel is an essential tool for any organization managing cloud migration projects. With 5 interactive analytical pages, dynamic pivot-powered charts, budget versus actual tracking, platform-level and industry-level analysis, and timeline trend monitoring, it transforms complex migration data into clear, actionable insights. Whether you are a cloud architect tracking workloads, a project manager monitoring budgets, or a consulting firm managing multi-industry portfolios, this dashboard delivers the visibility and control you need — all within Microsoft Excel.
Click here to Purchase Cloud Migration Services Dashboard in Excel
Visit our YouTube channel to learn step-by-step video tutorials