Etsy Seller Analytics Dashboard in Excel is a comprehensive, ready-to-use analytics template that helps Etsy shop owners track revenue, orders, traffic patterns, product performance, and operational costs — all from one powerful Excel workbook. If you are an Etsy seller struggling to make sense of scattered sales data, this dashboard consolidates everything into 5 interactive pages with dynamic charts, slicers, and automated KPI cards.
Whether you are running a full-time Etsy business, managing a creative side hustle, or consulting for multiple Etsy shops, this Excel Dashboard Template transforms raw Etsy data into actionable insights within minutes. The template includes 5 dashboard pages, 1 data entry sheet, and 1 support sheet packed with pivot tables that power the entire analytical engine.
Key Features of Etsy Seller Analytics Dashboard in Excel
This Etsy analytics dashboard is built with professional-grade Excel features that make data analysis intuitive for sellers at every skill level. Here is what makes this template stand out:
- 5 Interactive Dashboard Pages – Overview, Sales Analysis, Traffic Analysis, Product Performance, and Cost & Fees pages deliver a 360-degree view of your Etsy shop performance.
- High-Level KPI Cards – Instantly see Total Revenue, Total Orders, Total Views, Net Revenue, and Avg. Star Rating at the top of the Overview page.
- Dynamic Slicers – Filter all charts and data by Month, Channel, Shop Section, Product Category, Country, and Device with one click.
- Automated Pivot-Based Engine – All charts and metrics refresh automatically when you click Refresh All in Excel — no manual chart updates needed.
- Multi-Dimensional Revenue Analysis – Break down revenue by product category, country, device, listing status, channel, and shop section.
- Traffic & Favorites Tracking – Compare views against favorites across channels and months to understand engagement patterns.
- Cost & Fee Monitoring – Track shipping fees, material costs, and advertising spend to protect your profit margins.
- Beginner-Friendly Setup – No macros, no VBA, no advanced formulas. Just replace sample data and refresh.
Dashboard Pages Explained
1. Overview Page
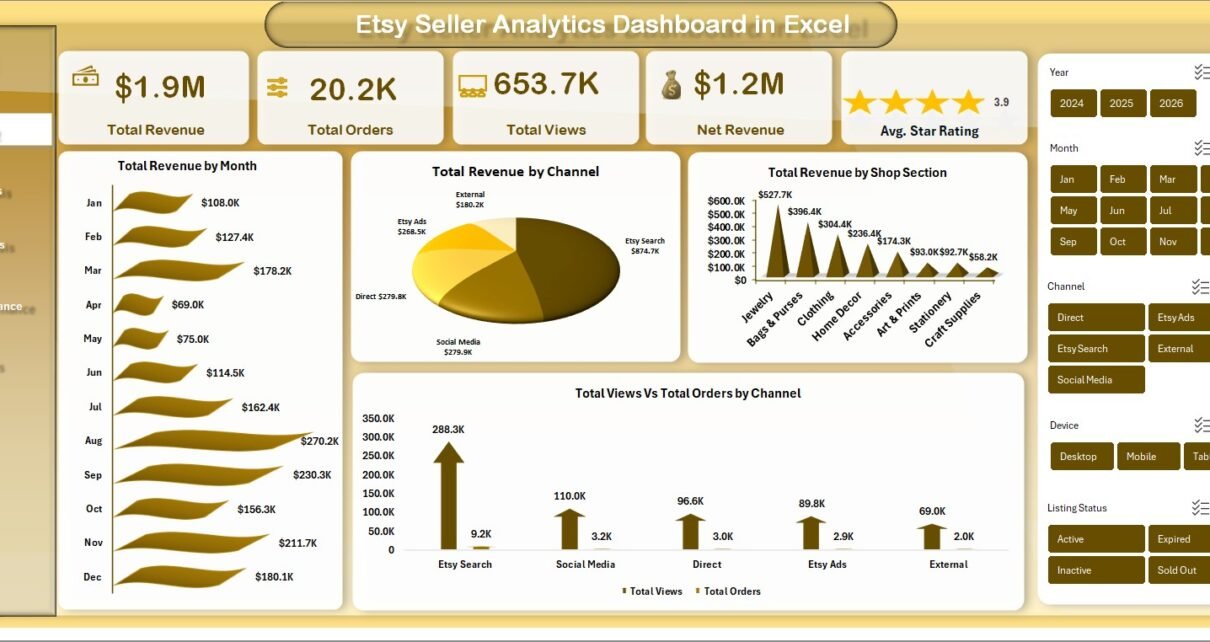
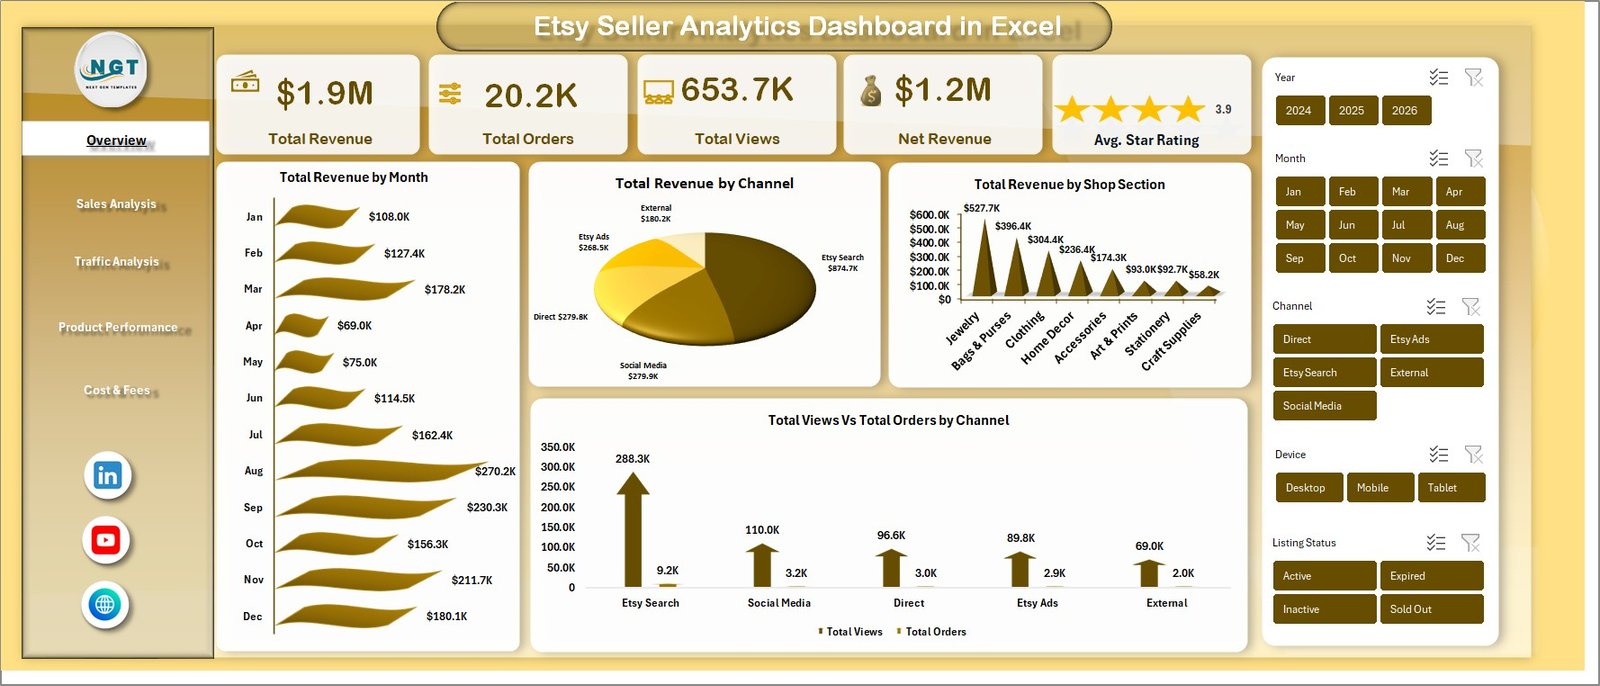
The Overview page serves as the command center for your entire Etsy shop. At the top, five KPI cards display high-level metrics: Total Revenue, Total Orders, Total Views, Net Revenue, and Avg. Star Rating. These cards give you an instant snapshot of your shop’s health without scrolling through any reports.
Below the cards, several analytical charts provide deeper context. Total Revenue by Month shows seasonal trends and growth trajectories. Total Revenue by Channel reveals which sales channels (direct, social, Etsy search, etc.) are driving the most income. Total Revenue by Shop Section helps identify which product categories are performing best. Total Views vs Total Orders by Channel compares traffic volume against actual conversions for each channel.
Multiple slicers are placed on this page so you can quickly filter the entire dashboard by specific time periods, channels, or categories.
 Etsy Seller Analytics Dashboard in Excel
2. Sales Analysis
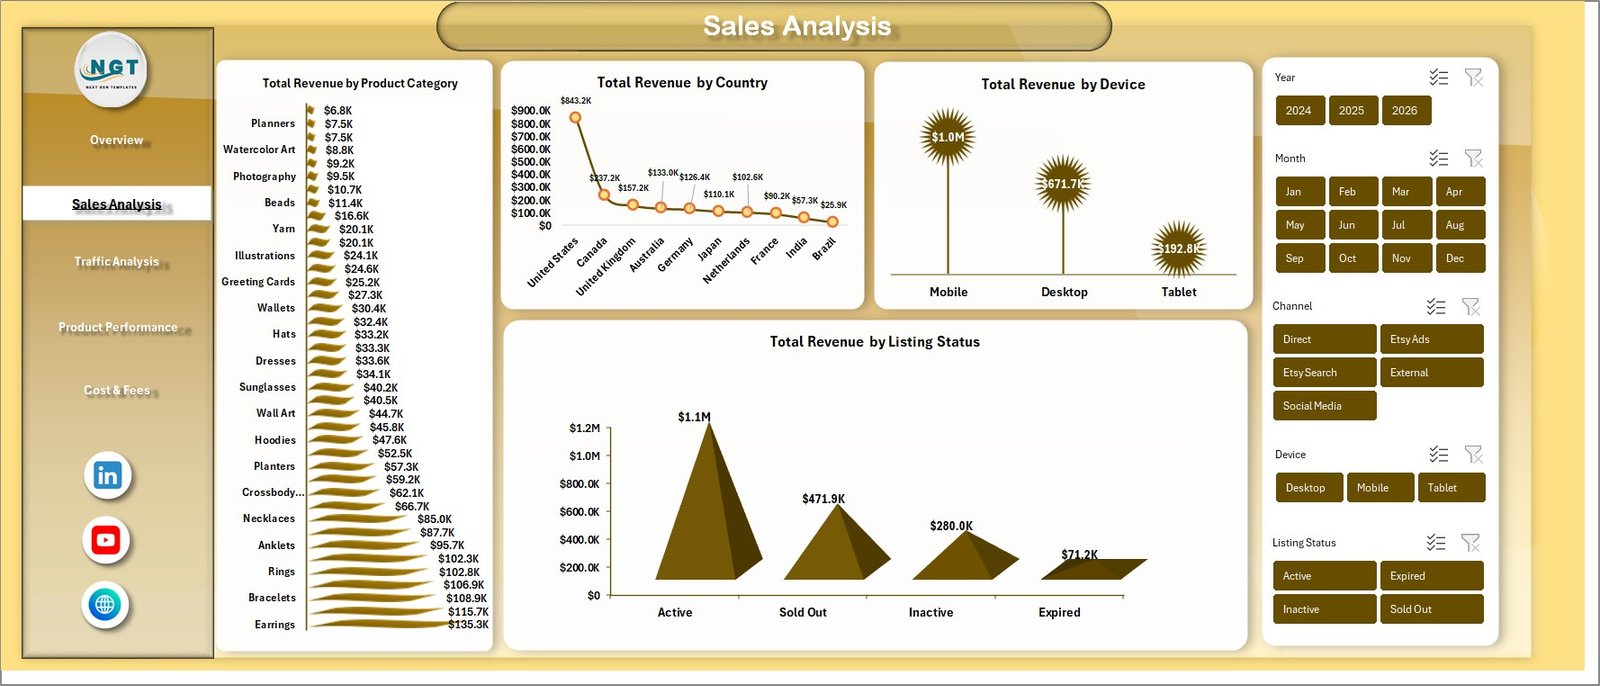
The Sales Analysis page takes a focused look at where your revenue is coming from across multiple dimensions. Total Revenue by Product Category breaks down earnings by product type so you know which items are your top sellers. Total Revenue by Country shows geographic distribution of your customer base. Total Revenue by Device reveals whether your buyers are shopping on desktop, mobile, or tablet. Total Revenue by Listing Status compares performance between active, sold out, and draft listings.
Together, these four charts help you identify which products to promote, which markets to target, and which platforms your customers prefer for shopping.
 Sales Analysis
3. Traffic Analysis
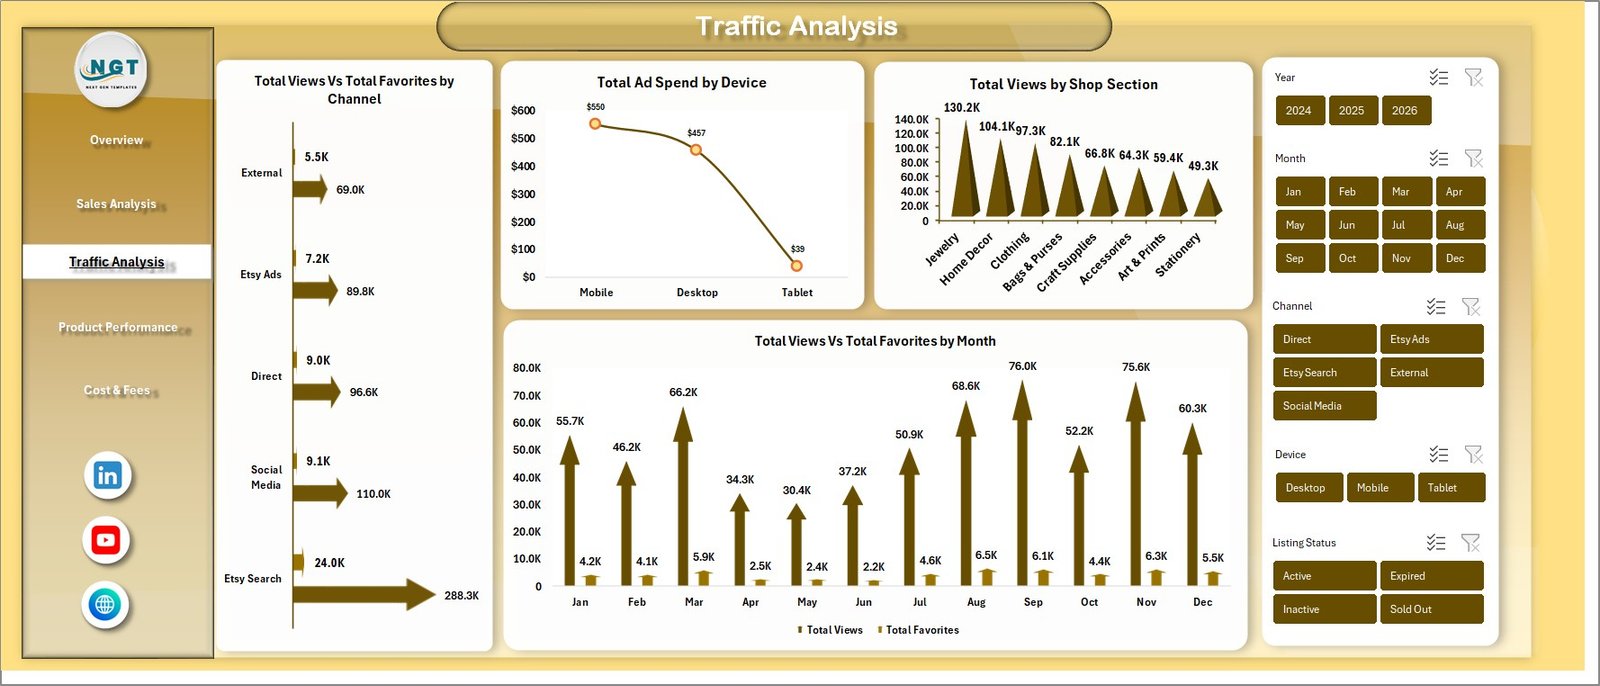
Understanding where your traffic comes from is essential for growing an Etsy shop. The Traffic Analysis page visualizes Total Views vs Total Favorites by Channel to show which channels generate the most engagement. Total Ad Spend by Device helps you optimize your advertising budget across platforms. Total Views by Shop Section identifies which product categories attract the most visitors. Total Views vs Total Favorites by Month reveals seasonal patterns in customer interest and engagement.
By cross-referencing traffic data with sales data from other pages, you can calculate effective conversion rates and optimize your marketing strategy accordingly.
 Traffic Analysis
4. Product Performance
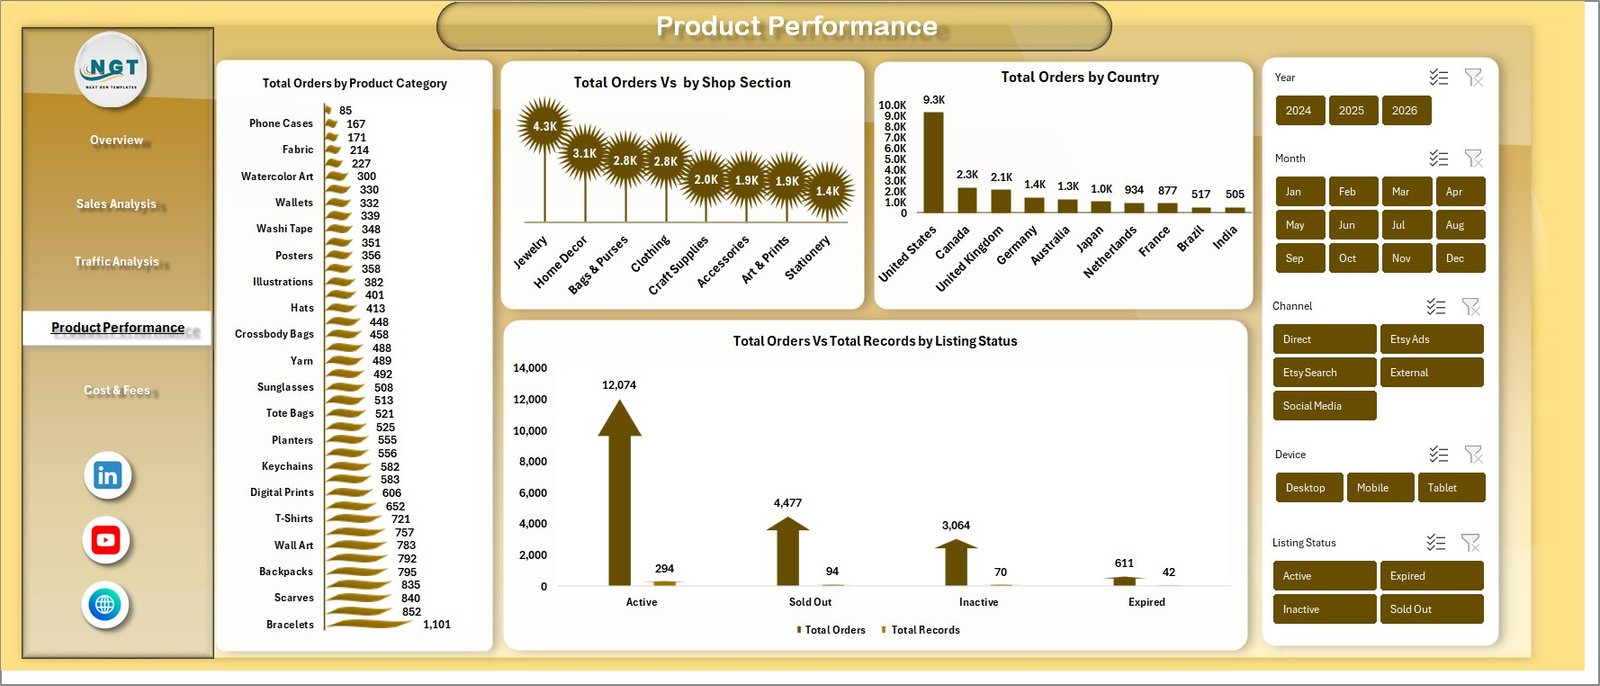
The Product Performance page focuses on order-level analysis to help you understand which products are selling and where. Total Orders by Product Category highlights your best-selling product types. Total Orders by Shop Section shows order distribution across your shop’s organizational structure. Total Orders by Country identifies your strongest geographic markets by order volume. Total Orders vs Total Reviews by Listing Status helps you gauge customer satisfaction and review engagement across different listing types.
These insights are invaluable for inventory planning, product development, and prioritizing which listings to optimize.
 Product Performance
5. Cost & Fees
Profitability depends on understanding your costs. The Cost & Fees page tracks Total Ship Fee by Month to reveal shipping expense trends over time. Total Material Cost by Shop Section breaks down production costs by product category. Total Ad Spend by Channel shows how much you are investing in advertising across different platforms.
By monitoring these cost metrics alongside revenue data from other pages, you can calculate true profit margins and identify areas where expenses can be reduced without impacting sales.
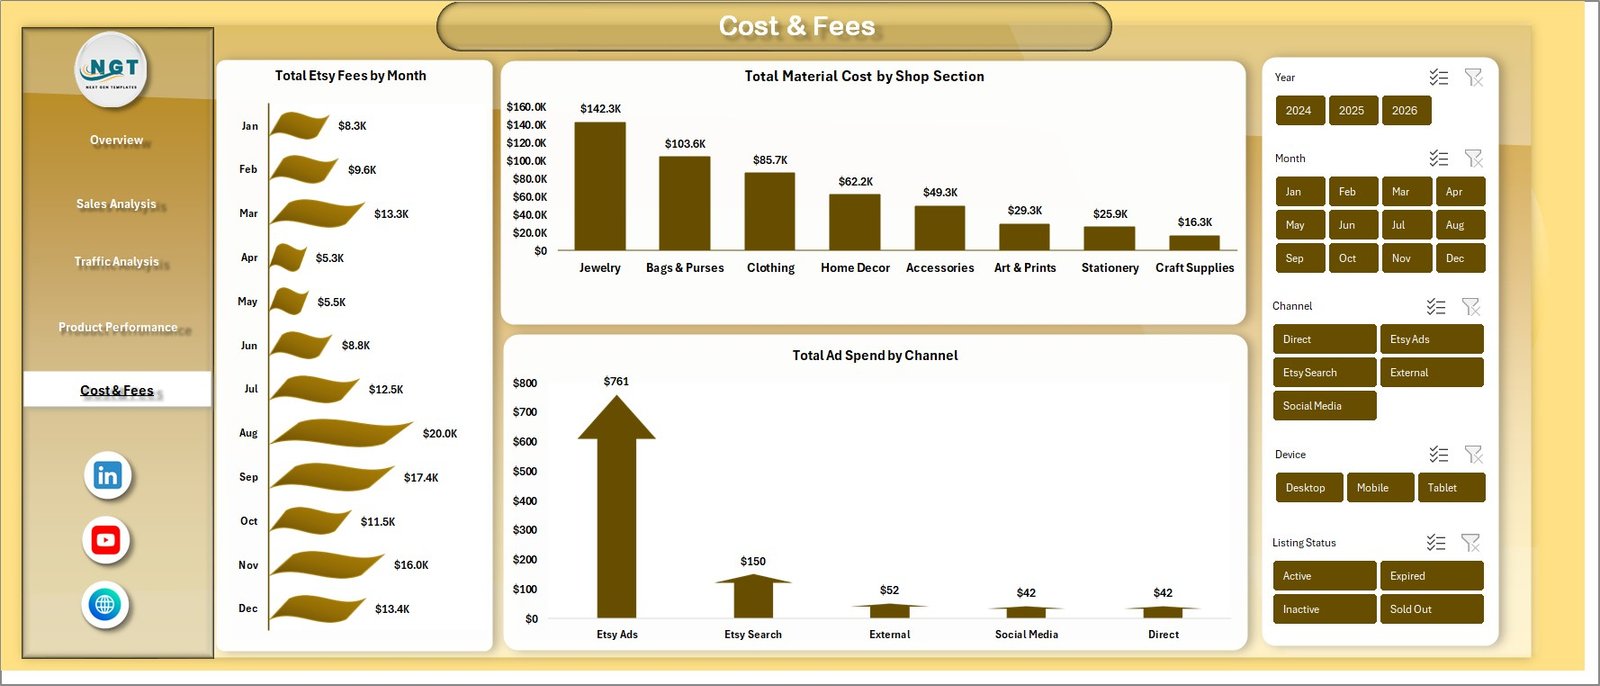 Cost & Fees
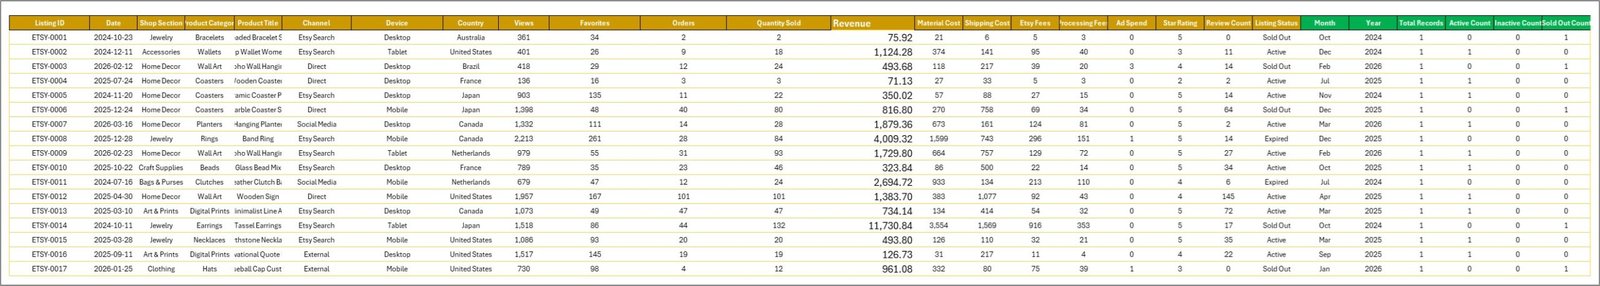
6. Data Sheet
The Data Sheet is where all your Etsy shop data lives. It contains structured columns for order details, revenue, fees, traffic metrics, and product information. To use the dashboard with your own data, simply replace the sample records with your actual Etsy data in the same format. The pivot tables and charts across all dashboard pages will pull from this sheet automatically.
 Data Sheet Tab
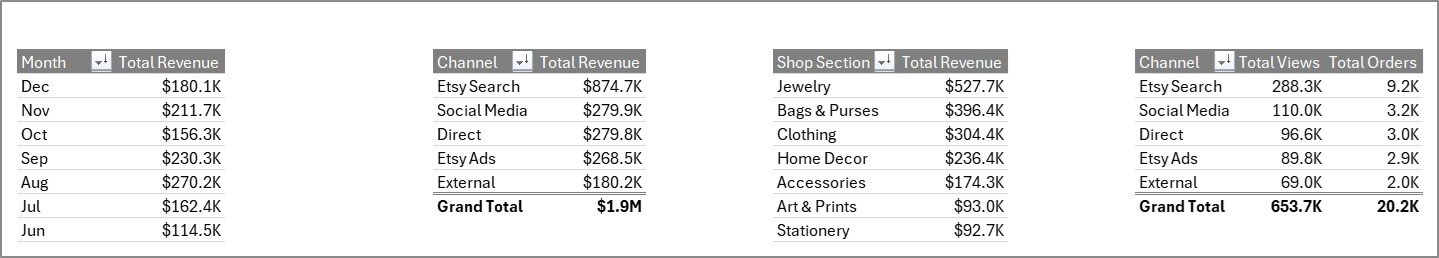
7. Support Sheet
The Support Sheet contains all the pivot tables that power every chart and KPI card across the dashboard. After updating your data in the Data Sheet, navigate to the Data tab in the Excel Ribbon and click Refresh All. Every pivot table in this sheet will recalculate, and all connected charts will update automatically. You can keep this sheet hidden during regular use.
 Support Sheet Tab
Advantages of Etsy Seller Analytics Dashboard in Excel
- Centralized Analytics – No more switching between Etsy stats, spreadsheets, and reports. Everything lives in one workbook.
- Time Savings – Automated pivot tables and charts eliminate hours of manual reporting work.
- Data-Driven Decisions – Visual charts make it easy to spot trends, identify top performers, and catch declining metrics early.
- Cost Control – Dedicated cost tracking helps protect profit margins by monitoring shipping, material, and ad expenses.
- No Subscription Fees – Unlike SaaS analytics tools, this is a one-time purchase with no recurring costs.
- Offline Access – Works entirely in Microsoft Excel without needing an internet connection.
Opportunities for Improvement
- Adding a comparison page for year-over-year performance analysis would enhance strategic planning capabilities.
- Including conditional formatting alerts for metrics that fall below target thresholds would enable proactive management.
- A customer demographics page with age, gender, and repeat buyer analysis could provide deeper audience insights.
- Integration with Etsy’s CSV export format documentation would simplify the data import process for new users.
Best Practices for Using This Dashboard
- Update Weekly – Export your Etsy shop data weekly and paste it into the Data Sheet for consistent tracking.
- Use Slicers Strategically – Filter by specific months or channels to isolate performance trends during promotional periods or seasonal events.
- Monitor Cost Ratios – Compare shipping and material costs against revenue regularly to maintain healthy profit margins.
- Track Star Ratings – Keep an eye on the Avg. Star Rating KPI as a leading indicator of customer satisfaction and potential review issues.
- Benchmark Monthly – Use the monthly revenue charts to set benchmarks and track progress against your sales goals.
Explore Relevant Templates
If you found this Etsy analytics template useful, you might also like these related Excel Dashboard Templates:
- Online Marketplaces KPI Scorecard in Excel – A KPI scorecard template for tracking performance across Amazon, Flipkart, Etsy, and other online marketplaces.
- Ecommerce Conversion Rate KPI Dashboard in Excel – Track and optimize your ecommerce conversion funnel with visual KPI monitoring.
- Google Analytics KPI Dashboard in Excel – Analyze website traffic, user behavior, and engagement metrics in Excel.
- Abandoned Cart Recovery KPI Dashboard in Excel – Monitor cart abandonment rates and recovery strategies.
- Online Marketplaces KPI Scorecard Blog Post – Read our detailed guide on tracking marketplace KPIs.
Frequently Asked Questions
What is the best Excel dashboard for tracking Etsy sales?
The Etsy Seller Analytics Dashboard in Excel is purpose-built for Etsy sellers. It features 5 interactive pages covering sales analysis, traffic tracking, product performance, and cost monitoring — making it the most comprehensive Etsy-specific Excel analytics tool available.
How do I use the Etsy Seller Analytics Dashboard in Excel?
Download and open the file in Microsoft Excel. Replace the sample data in the Data Sheet with your actual Etsy shop data. Go to the Data tab and click Refresh All. All 5 dashboard pages, charts, and KPI cards update automatically.
Do I need advanced Excel skills to use this template?
No. The template requires zero VBA, macro, or formula knowledge. Simply paste your data and click Refresh All. The pivot tables handle everything behind the scenes.
Can I track multiple Etsy shops in one dashboard?
Yes. Consolidate data from multiple Etsy shops into the Data Sheet. The slicers and charts will analyze all combined data, giving you a unified view of performance across all your shops.
What KPIs does this Etsy dashboard track?
The dashboard tracks Total Revenue, Total Orders, Total Views, Net Revenue, Avg. Star Rating, Total Ship Fee, Total Material Cost, Total Ad Spend, and performance breakdowns by product category, channel, country, device, shop section, and listing status.
Is this Etsy analytics template compatible with Google Sheets?
This template is designed for Microsoft Excel (desktop version) as it relies on pivot tables and slicers. For Google Sheets alternatives, visit our Google Sheets Dashboard Templates collection.
Conclusion
The Etsy Seller Analytics Dashboard in Excel is a must-have tool for any serious Etsy seller who wants to move beyond guesswork and start making data-driven decisions. With 5 interactive dashboard pages, automated pivot tables, and dynamic slicers, this template turns your raw Etsy data into clear, actionable business intelligence.
Click here to Purchase the Etsy Seller Analytics Dashboard in Excel
For more Excel tutorials and dashboard walkthroughs, visit our YouTube channel:
👉 Youtube.com/@PK-AnExcelExpert