Small Business CFO Dashboard in Power BI is a ready-to-use financial analytics template designed for small business owners, CFOs, finance managers, startup founders, and accountants who want a complete view of their company finances in a single Power BI file. This dashboard includes 5 interactive pages — Overview, Cash Flow, Budget Analysis, Department Spend, and Profitability — tracking key metrics like Total Revenue, Total Cost, Net Profit, Total Receivables, Budget Utilization, Profit Margin, and more. Whether you need to present financial performance to stakeholders, monitor cash flow, or analyze departmental budgets, this Power BI Dashboard Template gives you everything in one place.
Click here to Purchase Small Business CFO Dashboard in Power BI
Key Features of Small Business CFO Dashboard in Power BI
The Small Business CFO Dashboard in Power BI is packed with features that make financial tracking effortless for any small business. Here is what makes this template stand out:
- 5 Interactive Dashboard Pages — Overview, Cash Flow, Budget Analysis, Department Spend, and Profitability give you a 360-degree view of your finances.
- Real-Time KPI Cards — Instantly view Total Revenue, Total Cost, Net Profit, and Total Receivables from the Overview page.
- Dynamic Slicers and Filters — Filter by department, month, category, or payment status across all 5 pages.
- Cash Flow Monitoring — Track revenue by payment status, receivables by month, and compare payables vs receivables by department.
- Budget vs Actual Analysis — Compare budget allocation against actual costs by department and month.
- Profitability Insights — View profit margin trends by month, net profit by department, and identify overdue transactions by category.
- Plug-and-Play — Open the .pbix file, replace sample data with your own, and all visuals update automatically.
- Power BI Service Compatible — Publish to the cloud for scheduled refreshes, sharing, and mobile access.
Dashboard Pages Explanation
Let us walk through each of the 5 pages in the Small Business CFO Dashboard in Power BI to understand the depth of financial analysis this template provides.
1. Overview Page
The Overview page is the main landing page of the Small Business CFO Dashboard in Power BI. At the top, you will find high-level KPI cards displaying Total Revenue, Total Cost, Net Profit, and Total Receivables — giving you an instant snapshot of your company’s financial health. Below the cards, the page features several interactive charts that visualize your financial data from multiple angles. Total Revenue by Month Name shows monthly revenue trends so you can identify peak and low-performing months. Budget Utilization displays how effectively your allocated budget is being consumed. Total Cost and Total Revenue by Department breaks down financial performance across different business units. Total Cost by Category reveals which expense categories are consuming the most resources. Multiple slicers are available on this page so you can quickly filter the entire dashboard by department, month, category, or any other dimension.
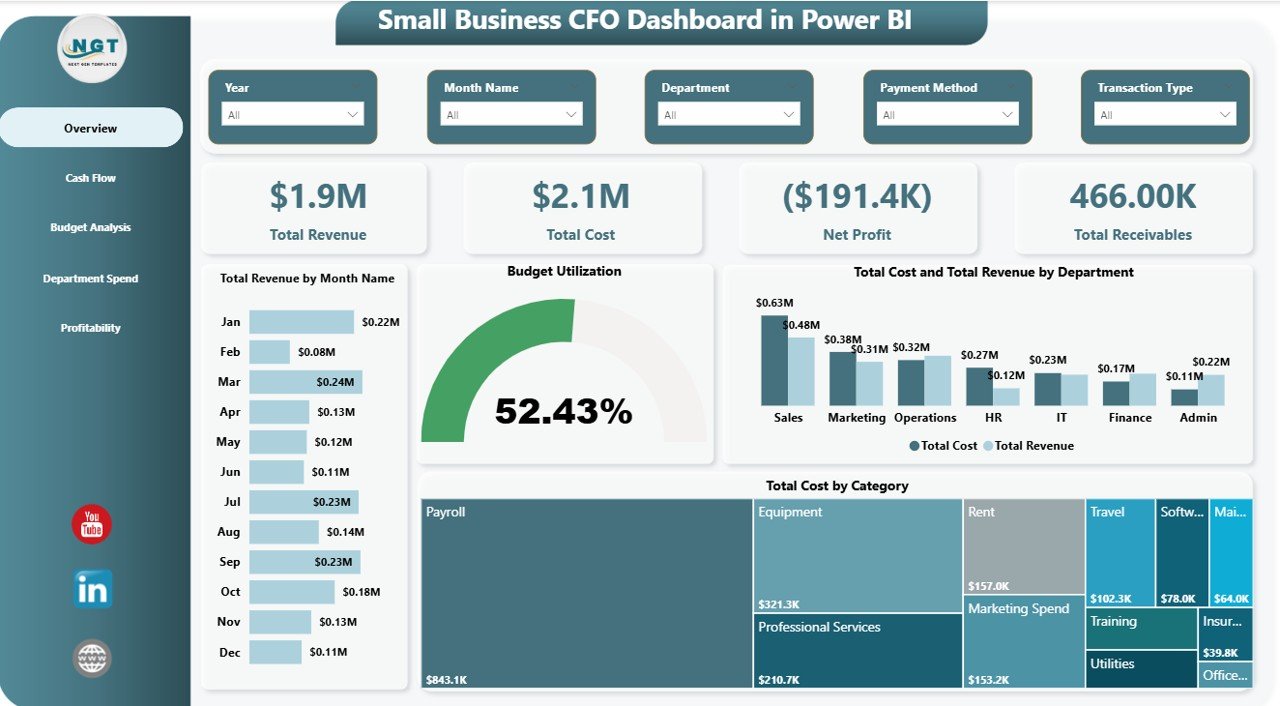
Overview Page
2. Cash Flow
The Cash Flow page provides a detailed analysis of your company’s money movement. This page is critical for any CFO or finance manager who needs to ensure the business maintains healthy liquidity. Total Revenue by Payment Status helps you understand how much revenue has been collected versus outstanding. Total Receivables by Month Name tracks month-over-month receivable trends so you can spot collection delays early. Total Cost and Total Revenue by Payment Status gives a side-by-side comparison of costs and revenue filtered by their payment stage. Total Receivables and Total Payables by Department shows which departments have the highest outstanding balances on both the receivable and payable sides. This information is essential for optimizing cash flow cycles and making informed decisions about payment terms and collection efforts.
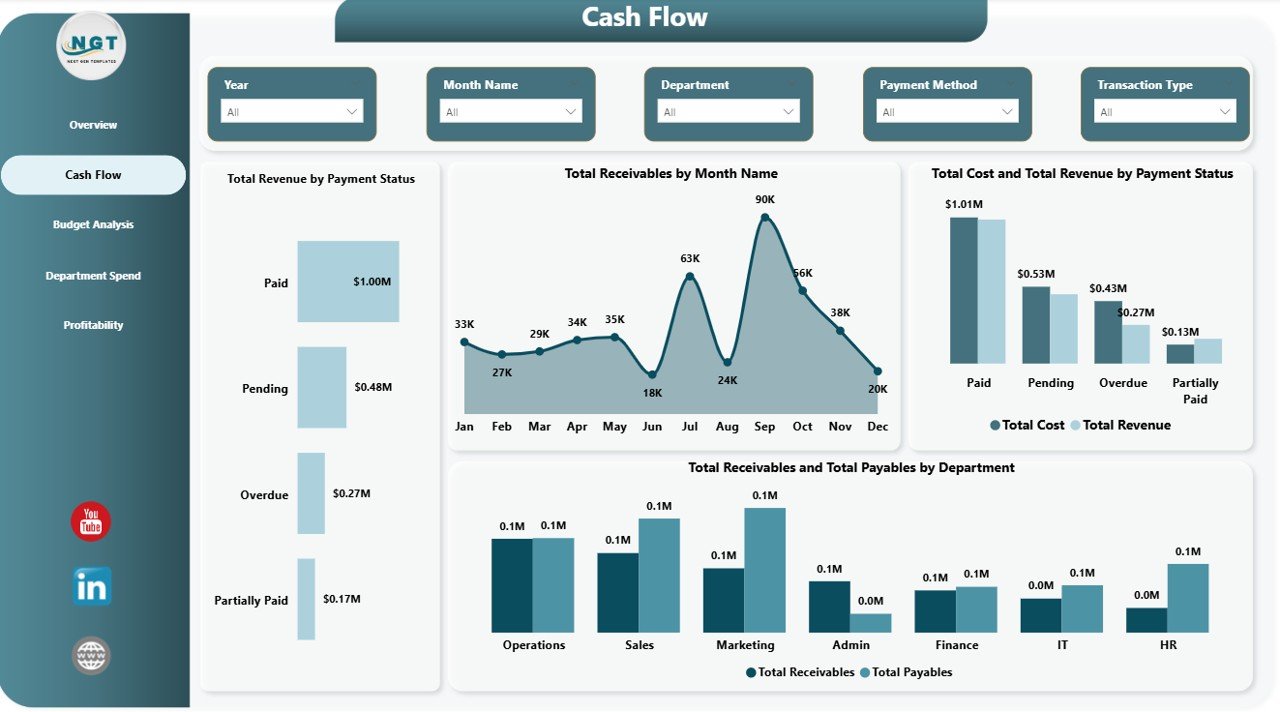
Cash Flow
3. Budget Analysis
The Budget Analysis page helps you track how your company’s spending aligns with planned budgets. Total Budget by Payment Status breaks down your budget allocation by payment stage so you can see how much of the budget has been committed, pending, or fully utilized. Total Budget by Department shows the budget distribution across all business units, helping you identify which departments receive the largest share of financial resources. Total Cost and Total Budget by Month Name provides a month-by-month comparison of actual costs against budgeted amounts, making it easy to spot months where spending exceeded or fell below plan. This page is invaluable for quarterly and annual financial reviews.
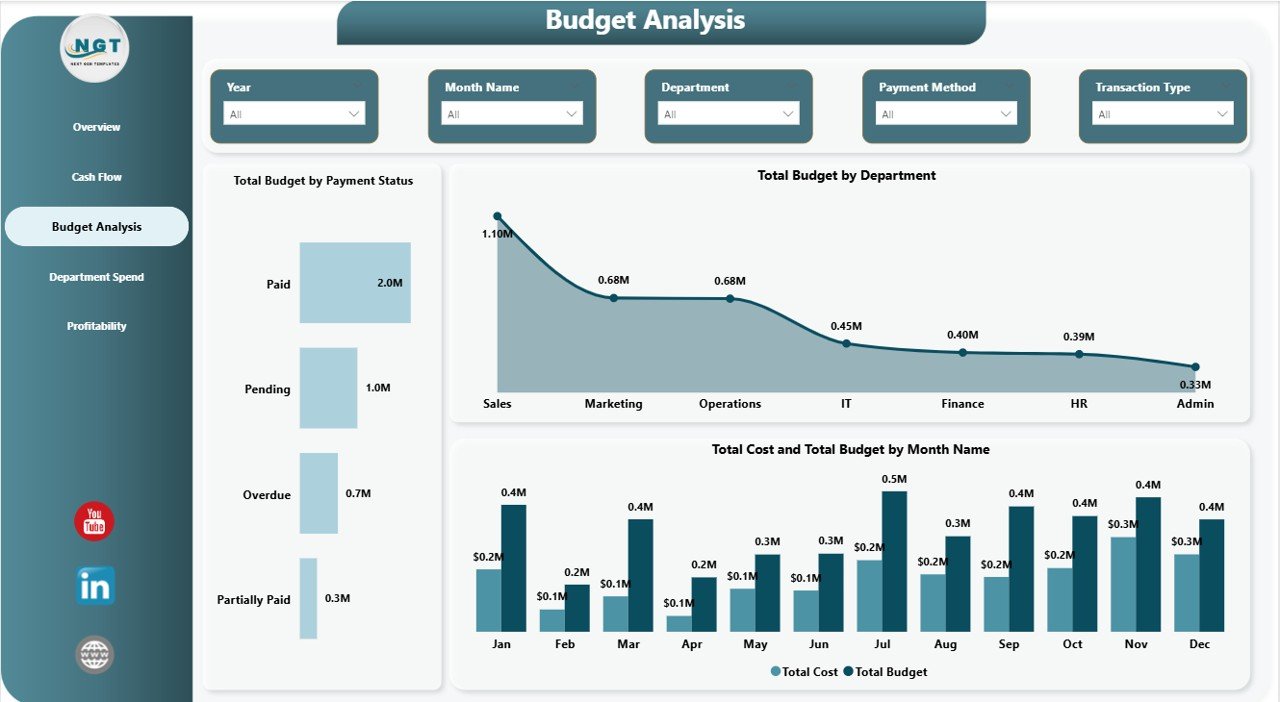
Budget Analysis
4. Department Spend
The Department Spend page zooms in on how each department within your organization is consuming financial resources. Total Cost by Department displays the total expenditure for each department, allowing you to quickly identify the highest-spending business units. Total Tax by Department reveals tax obligations associated with each department’s operations. Budget Utilization by Department shows the percentage of allocated budget that each department has consumed, making it easy to identify departments that are underspending or overspending. This page is especially useful for finance teams that need to present departmental financial performance to leadership or allocate resources for the next budgeting cycle.
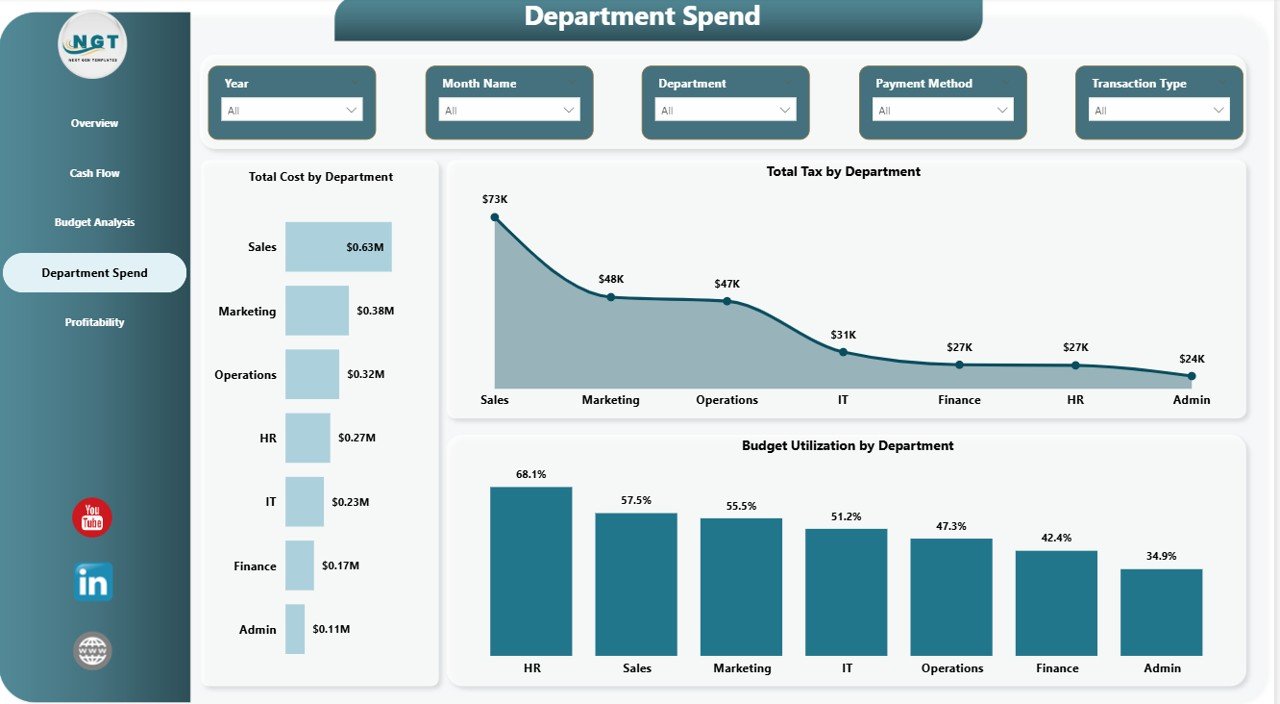
Department Spend
5. Profitability
The Profitability page is where the bottom-line story comes together. Overdue Transactions by Category highlights which expense or revenue categories have the most overdue items, helping you prioritize collection and payment follow-ups. Profit Margin by Month Name tracks your profit margin trend across the year so you can see whether your margins are improving, declining, or staying flat. Net Profit by Department reveals which departments are contributing the most to the bottom line and which ones might be dragging profitability down. Together, these visualizations give CFOs and business owners the clarity they need to make strategic financial decisions.
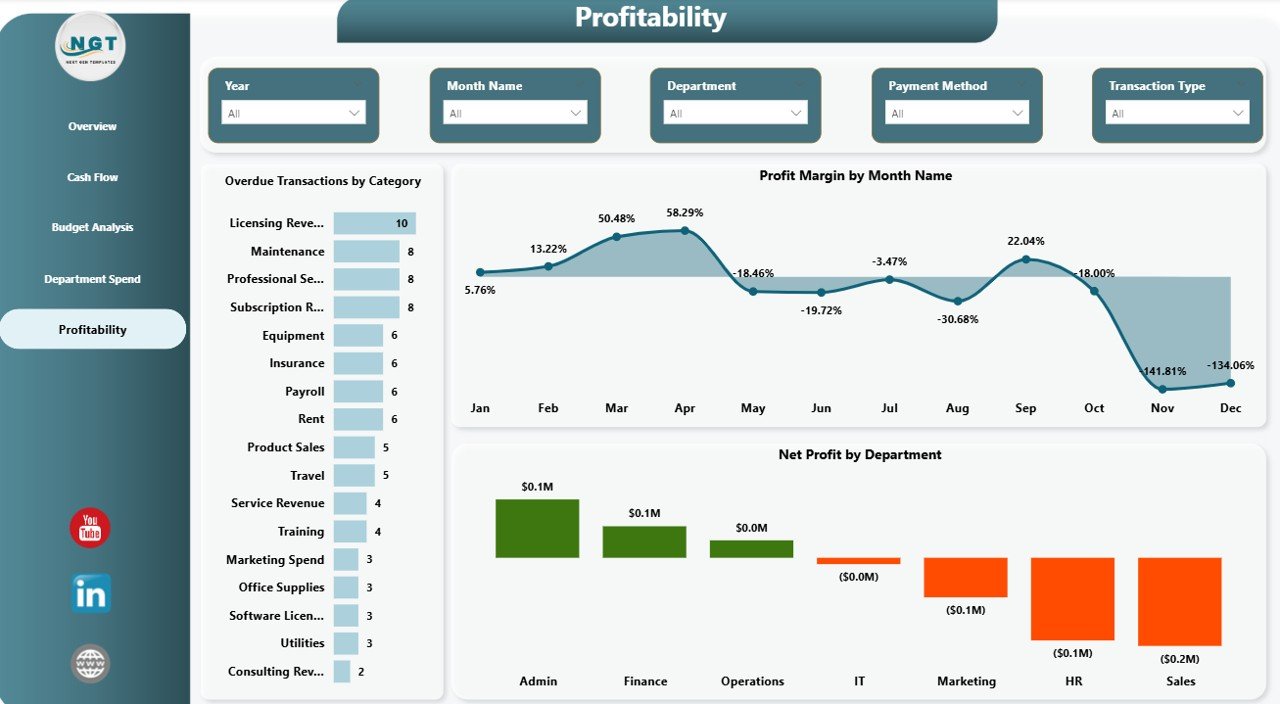
Profitability
Advantages of Small Business CFO Dashboard in Power BI
There are several reasons why this Power BI template is a smart investment for any small business:
- Complete Financial Visibility — 5 dedicated pages cover every aspect of financial management from revenue tracking to profitability analysis.
- Time-Saving — No need to build dashboards from scratch. This template is ready to use the moment you open it in Power BI Desktop.
- Data-Driven Decisions — Replace guesswork with visual, interactive data that updates automatically when you refresh your source.
- Executive-Ready — Professional layout suitable for board meetings, investor presentations, and internal reviews.
- Cost Effective — At a fraction of the cost of hiring a data analyst, you get a fully functional financial dashboard.
Also check out the Small Business CFO Dashboard in Excel if you prefer working in Microsoft Excel, or explore the Finance and Accounting Command Center Bundle for a comprehensive 8-template finance toolkit.
Opportunities for Improvement
While this dashboard is comprehensive, here are some ways you could extend it further:
- Add Forecasting — Connect to Power BI’s built-in forecasting features to project future revenue and cost trends.
- Integrate Live Data Sources — Connect directly to your accounting software (QuickBooks, Xero, etc.) for real-time data refresh.
- Custom DAX Measures — Add advanced DAX calculations for metrics like working capital ratio, debt-to-equity, or EBITDA.
- Row-Level Security — Implement RLS to restrict department managers to only their own department’s data.
- Additional Pages — Add pages for vendor analysis, invoice aging, or year-over-year comparisons.
Best Practices
Follow these tips to get the most out of your Small Business CFO Dashboard in Power BI:
- Update Data Monthly — For the most accurate insights, refresh your data source at least once a month.
- Use Consistent Data Formats — Ensure your financial data uses consistent date formats, currency codes, and department names.
- Leverage Slicers — Use the built-in slicers to drill down into specific time periods, departments, or categories for targeted analysis.
- Publish to Power BI Service — Share the dashboard with your team by publishing to Power BI Service for cloud-based collaboration.
- Schedule Auto-Refresh — Set up scheduled data refreshes in Power BI Service so your dashboard always shows the latest numbers.
For more Power BI dashboards, visit NextGenTemplates Power BI Dashboard Collection. You might also find the Business Valuation Dashboard in Power BI useful for advanced financial modeling.
Explore Relevant Templates
- Small Business CFO Dashboard in Excel — Same financial analytics in a familiar Excel spreadsheet format.
- Small Business CFO Dashboard in HTML — Browser-based version that works without any software installation.
- Finance Summary Dashboard in Excel — A compact financial summary dashboard for quick reporting needs.
- Finance and Accounting Command Center Bundle — 8 premium finance templates across Excel, Power BI, and Google Sheets at 46% savings.
Frequently Asked Questions
What is the best Power BI dashboard template for small business CFOs?
The Small Business CFO Dashboard in Power BI is one of the best options available. It includes 5 interactive pages covering Overview, Cash Flow, Budget Analysis, Department Spend, and Profitability, tracking metrics like Total Revenue, Net Profit, Budget Utilization, and Profit Margin in a single .pbix file.
How do I use the Small Business CFO Dashboard in Power BI?
Download the .pbix file, open it in Power BI Desktop (free from Microsoft), and replace the sample data with your own business financial data. All charts, KPIs, and visuals update automatically. No DAX or coding knowledge is required.
Can I customize this Power BI finance dashboard?
Yes, the template is fully editable. You can modify colors, add new measures, create additional pages, and connect your own data sources like QuickBooks, Xero, or Excel files.
What KPIs does this CFO dashboard track?
The dashboard tracks Total Revenue, Total Cost, Net Profit, Total Receivables, Total Payables, Budget Utilization, Profit Margin, Total Tax, and Overdue Transactions across 5 interactive pages.
Is there an Excel version of this CFO dashboard?
Yes. NextGenTemplates offers a Small Business CFO Dashboard in Excel with the same financial analytics in a spreadsheet format, plus an HTML version for browser-based viewing.
Can I share this dashboard with my team?
Yes. You can publish the dashboard from Power BI Desktop to Power BI Service for cloud-based sharing, scheduled data refreshes, and mobile access across your organization.
Conclusion
The Small Business CFO Dashboard in Power BI is a powerful, ready-to-use financial analytics solution that gives small business owners and finance professionals complete visibility into revenue, costs, cash flow, budgets, and profitability. With 5 interactive pages, real-time KPI cards, and dynamic slicers, this template transforms complex financial data into clear, actionable insights. Download it today and take control of your business finances.
Click here to Purchase Small Business CFO Dashboard in Power BI
Visit our YouTube channel for step-by-step video tutorials: Youtube.com/@PK-AnExcelExpert