The global pet care industry surpassed $235 billion in 2023 and is projected to grow at 6.1% CAGR through 2030 — yet most independent pet grooming salons, boarding facilities, and multi-service pet care centers still manage business performance through disconnected spreadsheets, paper logs, or outdated booking software reports. The Pet Care Business Dashboard in Excel changes that: it delivers 5 KPI cards, 16 pre-built charts, and 5 dedicated analysis pages in a single .xlsx file that takes under 10 minutes to set up. No SaaS subscription, no IT project, no per-user fees.
Whether you run a solo grooming studio or a multi-location pet care operation, tracking which booking channels deliver the best margins, which staff members drive the highest satisfaction scores, and how monthly revenue trends shift across pet types is the difference between a business that reacts and one that grows. This dashboard gives you that visibility — in a tool you already know how to use.
Click here to Purchase Pet Care Business Dashboard in Excel →
Key Features of Pet Care Business Dashboard in Excel
- 5 KPI Cards on the Overview page — Total Records, Total Revenue, Total Cost, Total Product Sales, and Avg. Satisfaction update instantly after a single Refresh All click.
- 16 pre-built charts across 5 pages — Every chart is wired to a pivot-driven Support sheet; change the data, click Refresh All, and all visuals rebuild in seconds.
- Native Excel slicers — Filter the entire Overview dashboard by Booking Channel, Pet Size, Pet Type, and more in a single click — no formula editing required.
- Pivot-table engine (Support sheet) — All pivot tables live in one hidden sheet; keep it hidden for end users and never touch it after initial setup.
- Pre-formatted Data Sheet — Structured columns for Date, Service Type, Pet Type, Pet Size, Booking Channel, Staff Member, Location, Revenue, Cost, Status, and Satisfaction Score. Add rows and Refresh All — the entire dashboard expands automatically.
- Works offline, on Windows and Mac — Microsoft Excel 2016+, Microsoft 365, and Excel for Mac all supported. No VBA macros, no security prompts.
- One-time $17.99 — Instant download, lifetime access, no subscription, no per-user fees.
Dashboard Pages Explanation
Page 1 — Overview
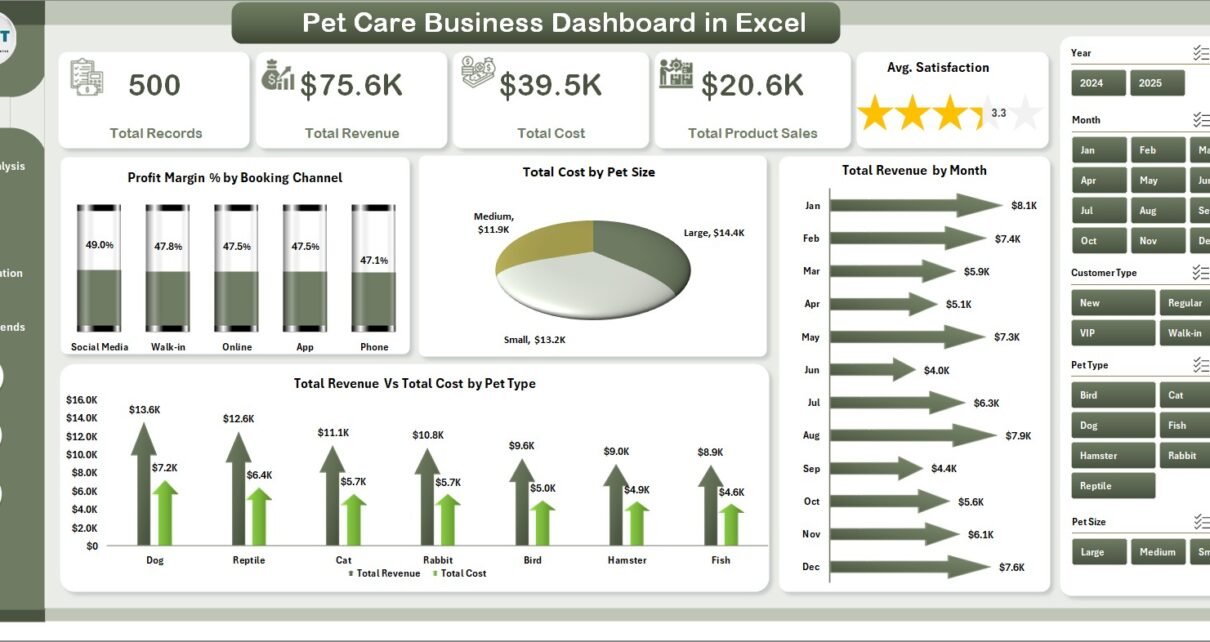
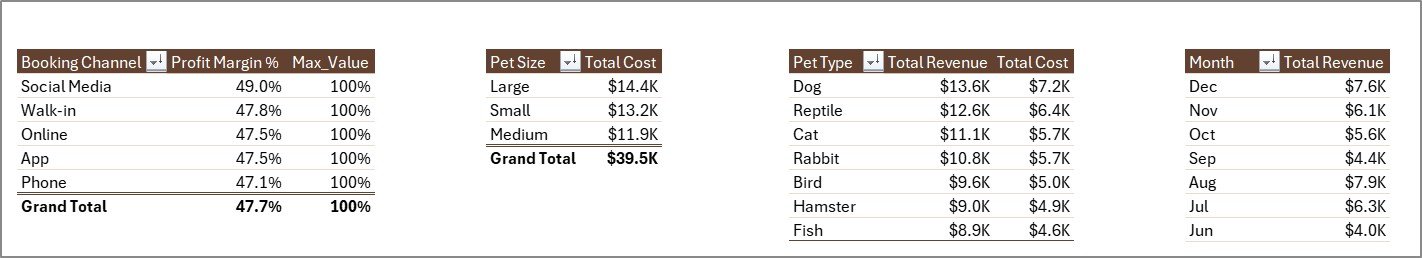
The Overview page is the command center. At the top, five KPI cards give you an immediate performance snapshot: Total Records (total appointments logged), Total Revenue, Total Cost, Total Product Sales, and Avg. Satisfaction. Below the cards, four charts break down performance by channel and type:
- Profit Margin % by Booking Channel — reveals whether walk-in, online, phone, or app bookings deliver better margins
- Total Cost by Pet Size — shows where service costs concentrate across small, medium, and large pets
- Total Revenue by Month — surfaces seasonal booking patterns to guide staffing and promotions
- Total Revenue vs Total Cost by Pet Type — compares income against cost across dogs, cats, birds, and other species
Multiple slicers on this page filter the entire view instantly — no formula edits needed.
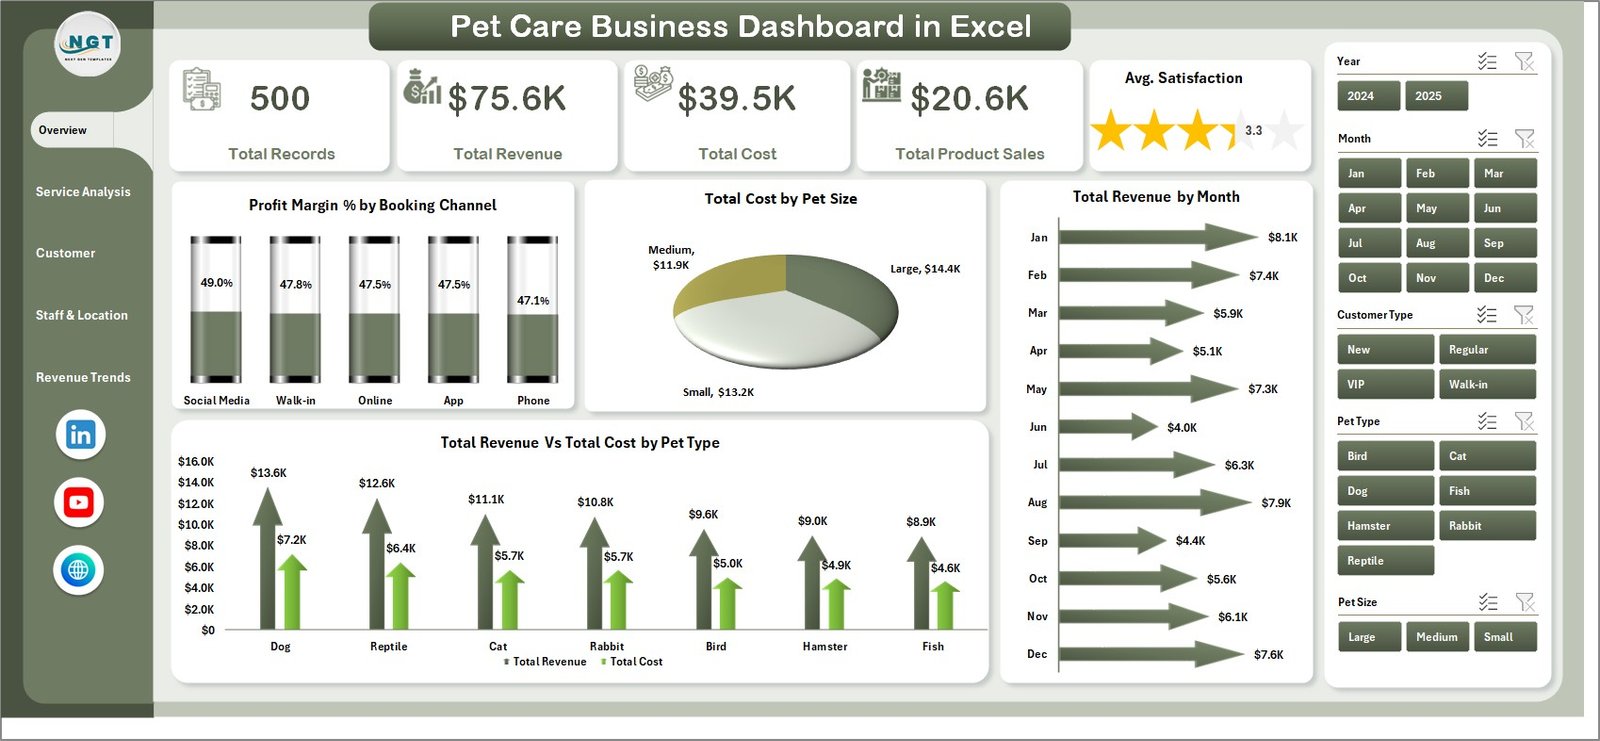
Overview Page — KPI Cards, Slicers, and 4 Charts
Page 2 — Service Analysis
This page focuses on the performance of individual service categories — grooming, boarding, vet checks, training, and any custom service types you add:
- Total Revenue by Service Type — which services generate the most income
- Total Records by Status — tracks completed vs pending vs cancelled appointments
- Avg. Revenue/Visit by Service Type — benchmarks revenue efficiency per appointment category
- Avg. Satisfaction by Service Type — identifies which services clients rate highest
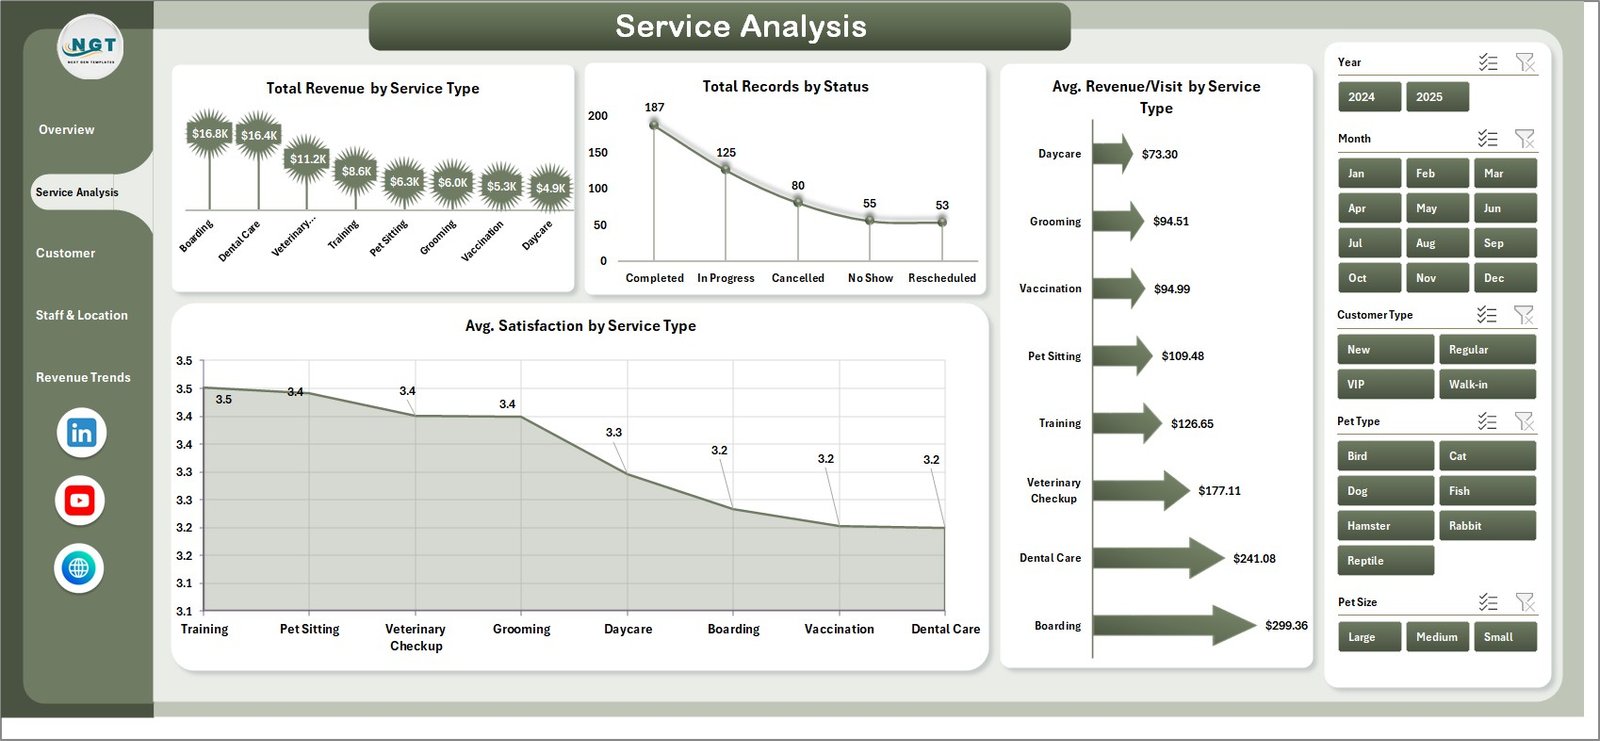
Service Analysis Page
Page 3 — Customer Insights
Understanding who your clients are and where they come from is the foundation of sustainable growth. This page provides four client-focused views:
- Total Revenue by Customer Type — segments revenue by new vs returning clients
- Total Records by Booking Channel — compares in-store, online, phone, and app booking volumes
- Avg. Satisfaction by Pet Type — reveals which animal categories receive the highest and lowest scores
- Total Revenue by Referral Source — identifies which marketing channels drive the most bookings
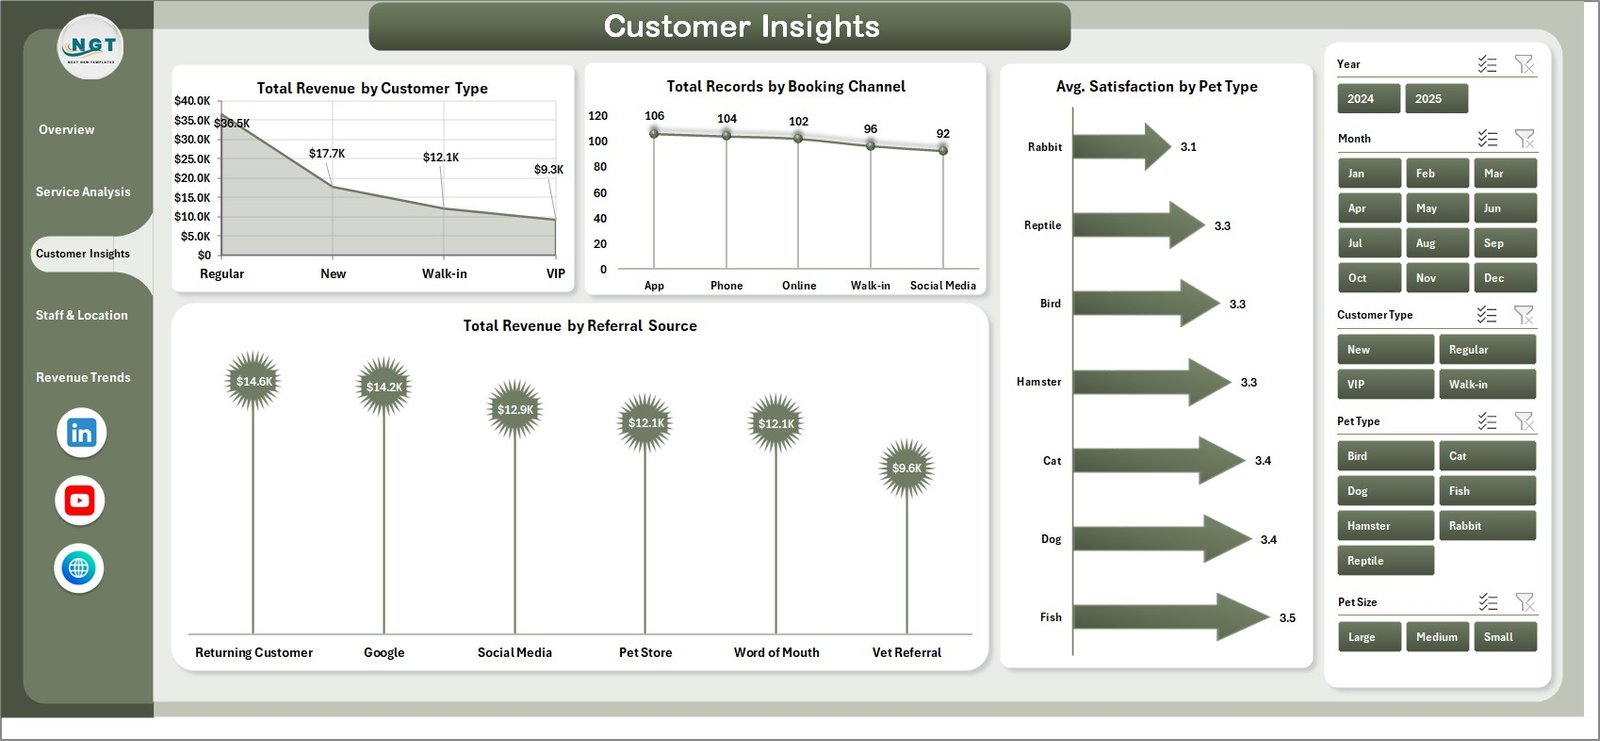
Customer Insights Page
Page 4 — Staff & Location
For multi-staff or multi-location pet care operations, this page is where operational clarity lives:
- Total Revenue by Top 5 Staff Member — ranks your highest-earning groomers and handlers
- Total Revenue vs Total Cost by Location — compares profitability across branches or outlets
- Completion % by Location — tracks appointment completion rates per outlet
- Avg. Satisfaction by Top 5 Staff Member — surfaces which team members deliver the best client experience
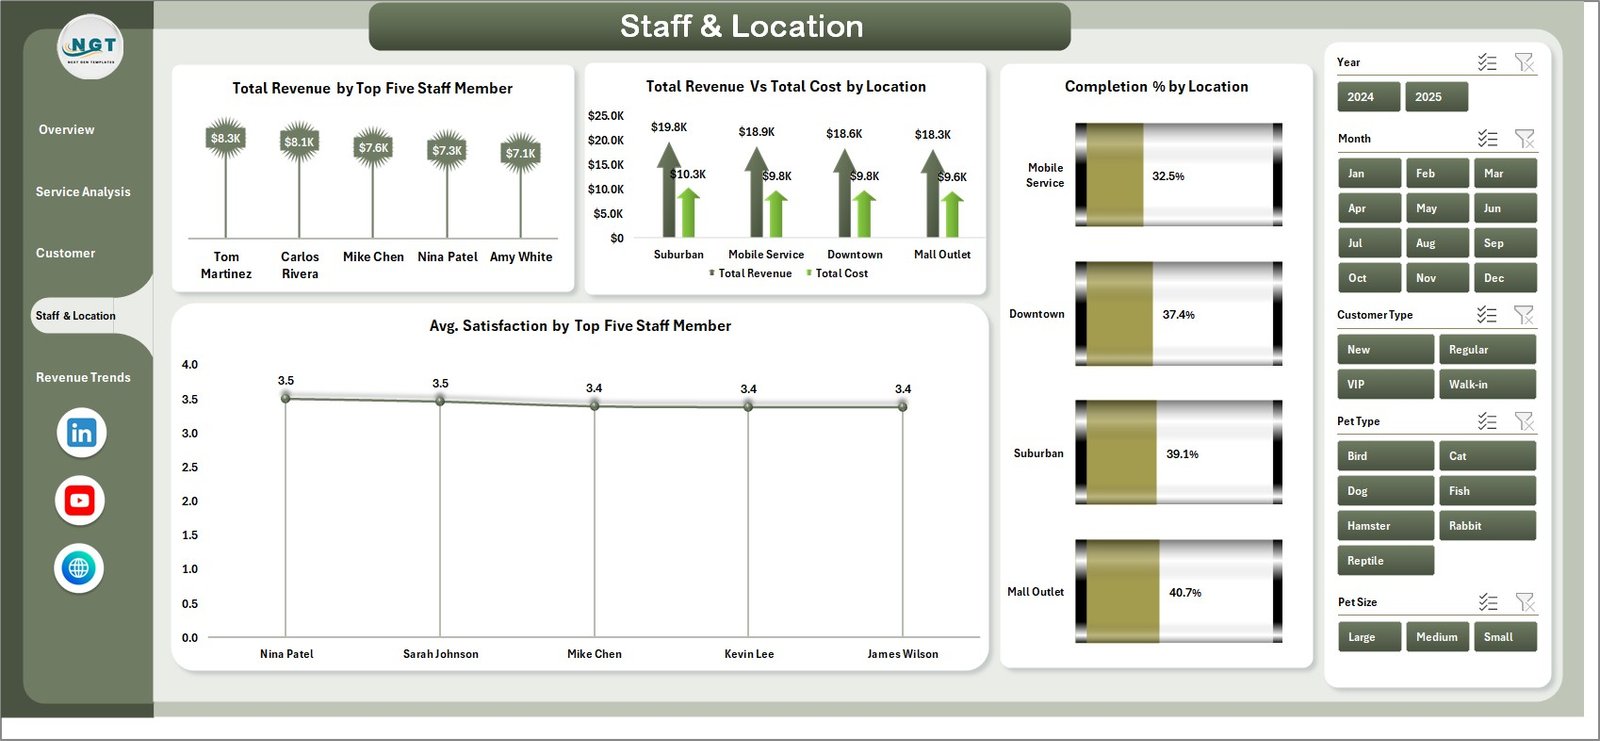
Staff & Location Page
Page 5 — Revenue Trends
The Revenue Trends page gives you the financial story over time — critical for spotting margin dips before they hurt cash flow:
- Total Revenue by Pet Type — cross-species revenue comparison
- Total Revenue by Status — separates completed, cancelled, and pending revenue impact
- Total Revenue vs Total Cost by Month — tracks margin trends month by month
- Profit Margin % by Month — spots seasonal margin dips and peaks
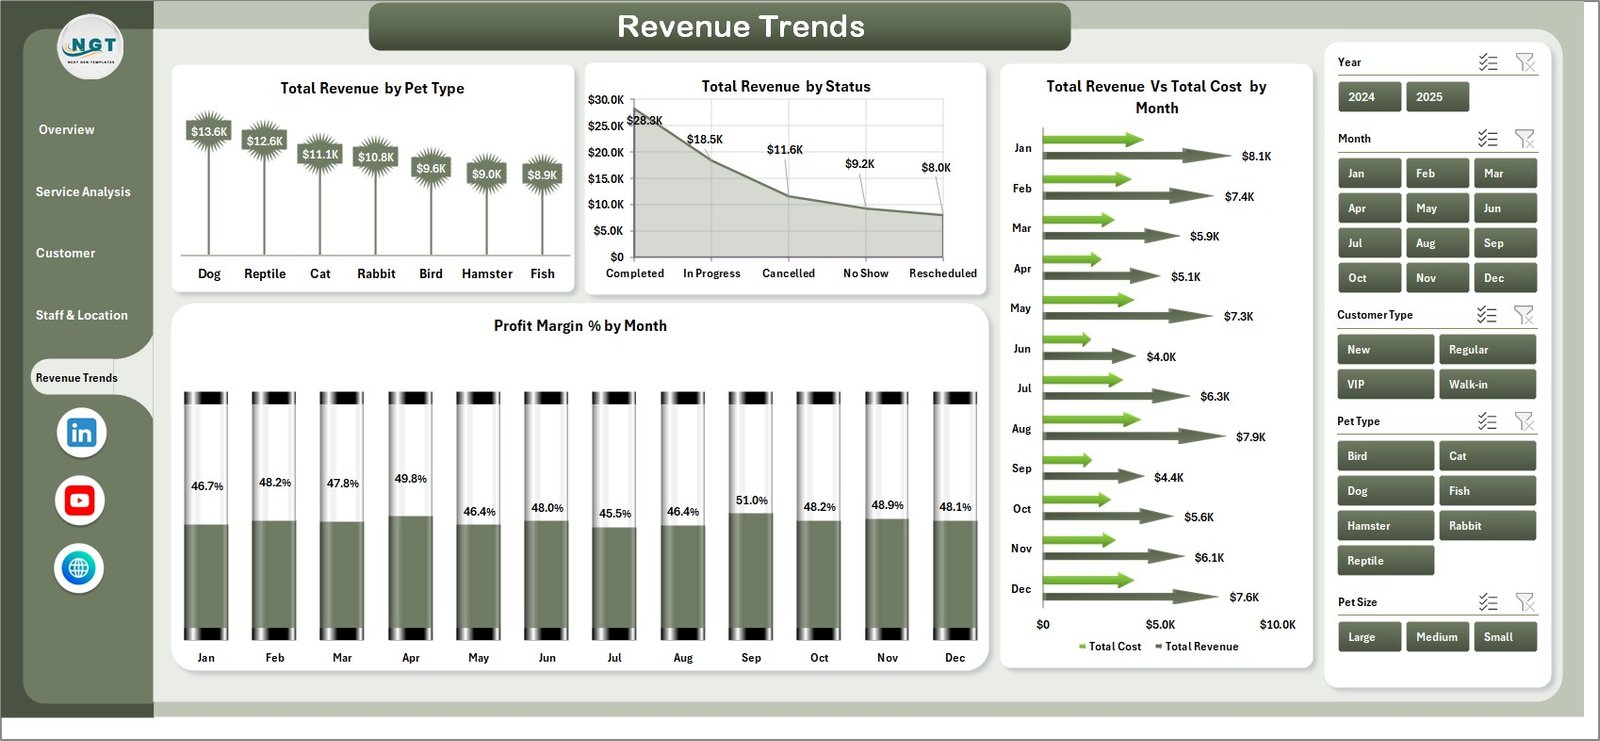
Revenue Trends Page
Data Sheet
All records enter through the pre-formatted Data Sheet. Columns cover Date, Service Type, Pet Type, Pet Size, Booking Channel, Staff Member, Location, Revenue, Cost, Status, Satisfaction Score, Customer Type, and Referral Source. Replace the included sample data with your own records and click Refresh All — every dashboard page updates automatically.

Data Sheet Tab
Support Sheet
The hidden Support Sheet holds all pivot tables that power the 16 charts across all 5 pages. After updating the Data Sheet, go to Excel Ribbon → Data → Refresh All. Every pivot table and chart rebuilds in one click. Keep this sheet hidden for end users — no changes needed here after setup. Learn more about Excel pivot table best practices at Microsoft Support.
Support Sheet Tab
Pet Care Business Dashboard in Excel vs. Google Sheets vs. PetDesk / Gingr — Feature Comparison
| Feature | Pet Care Business Dashboard in Excel | Google Sheets Dashboard | PetDesk / Gingr (SaaS) |
|---|---|---|---|
| Cost | $17.99 one-time | $9.99 one-time | $99–249 / month |
| Platform | Microsoft Excel (desktop) | Google Sheets (browser) | Cloud SaaS app |
| Setup Time | Under 10 minutes | Under 10 minutes | 1–2 weeks onboarding |
| Works Offline | ✅ Full offline support | ❌ Requires internet | ❌ Cloud-only |
| Native Slicers & Filters | ✅ Excel native slicers | ✅ Filter menus | ✅ Dashboard filters |
| Customizable Fields | ✅ Fully editable pivot model | ✅ Fully editable | ❌ Vendor-locked |
| Works on Mac | ✅ Excel for Mac | ✅ Any browser | ✅ Web app |
| Year-1 Cost at 5 Users | $17.99 total | $9.99 total | $5,940–17,940 |
| Pet-Specific Charts | ✅ 16 built-in | 15+ charts | ✅ Vendor templates |
For pet grooming salons, boarding facilities, and multi-service pet care centers that want 16 pre-built analytics charts without paying $99–249/month, the Pet Care Business Dashboard in Excel sits in the sweet spot.
Who Should Use This Template
✅ Perfect for:
- Pet grooming salon owners with 1–5 staff members tracking service revenue, satisfaction scores, and booking channels
- Dog and cat boarding facilities monitoring location-level profitability and staff performance across multiple outlets
- Multi-service pet care centers offering grooming, boarding, vet checks, and training — needing revenue visibility across all service lines
- Pet business consultants building monthly performance reports for salon or daycare clients
- Operations managers at independent pet care chains with 2–10 locations
❌ Not a fit if:
- You need EMR/EHR integration or HIPAA-compliant veterinary record management
- You need real-time appointment booking automation — this is an analytics dashboard, not a scheduling tool
- You need multi-user real-time cloud collaboration — use the Pet Care Business Dashboard in Google Sheets instead
- Your team needs enterprise-grade BI with role-based access control — consider Power BI or Tableau
Real-World Use Cases
Sarah owns a 3-location pet grooming salon in Dallas. She uses the Pet Care Business Dashboard in Excel to compare revenue by staff member across locations, spot which booking channels generate the highest-margin appointments, and track monthly profit margins — without paying $200/month for PetDesk. Her Excel file runs offline at each salon and syncs when staff export their weekly data.
Mark manages a boarding and daycare facility in London. The Staff & Location page shows him that one branch consistently hits a 78% completion rate while the other reaches 92% — a gap he traced to scheduling gaps during peak weekend hours. That single insight helped him recover an estimated 14% of potential revenue at Branch 2 within 6 weeks.
Dr. Aisha runs a boutique veterinary wellness center offering grooming, vet checks, and nutrition consultations. The Customer Insights page shows that referral-source revenue from social media outpaces walk-in bookings 2:1 — leading her to double her Instagram ad spend, a decision backed by dashboard data rather than gut feel.
Click here to Purchase Pet Care Business Dashboard in Excel →
Advantages of Pet Care Business Dashboard in Excel
The most immediate advantage is zero recurring cost. At $17.99 one-time versus $99–249/month for PetDesk or Gingr, the dashboard pays for itself in the first hour of use. The second advantage is data ownership — your records stay in your local Excel file, never uploaded to a third-party cloud. For small pet care operators who handle sensitive client data, this matters.
The pivot-driven architecture means no manual chart maintenance. Add 500 new rows to the Data Sheet, click Refresh All, and every KPI card, slicer, and chart across all 5 pages updates in seconds. No formula edits, no chart source repointing, no IT support needed. And because there are no VBA macros, the file opens cleanly on Mac without security prompts — making it equally useful for teams that mix Windows and Mac machines.
Opportunities for Improvement
Like all pre-built dashboards, this template works best when your data is structured consistently. If staff names or service types vary in spelling across records (e.g., “Grooming” vs “grooming” vs “GROOMING”), the slicers will show duplicate values. A simple data validation dropdown in the Data Sheet solves this — the template’s column headers make it straightforward to add. Additionally, the dashboard displays Top 5 Staff Members and Top 5 Locations — businesses with many more locations may want to extend the pivot tables in the Support Sheet manually. For teams that need automated nightly data imports from a POS or booking system, this template requires a manual export step; a Power BI version with direct data connectors may suit those workflows better.
Best Practices
- Standardize data entry from day one — use consistent naming for Service Types, Staff Members, and Locations to keep slicers clean.
- Refresh weekly or monthly — the dashboard gives the most actionable insights when reviewed on a consistent schedule rather than ad hoc.
- Keep the Support Sheet hidden — protect end users from accidentally modifying pivot tables. Use Excel’s sheet protection feature if needed.
- Back up your Data Sheet — keep a copy of raw data in a separate workbook or cloud folder as insurance against accidental overwrites.
- Use slicers for weekly stand-ups — the Overview page with a single-click filter (e.g., “This Month” + “Online Booking”) makes for a concise weekly operations review.
Explore Relevant Templates
📄 Pet Care Business Dashboard in Google Sheets — Cloud-based version with 6 interactive pages, Search Sheet, and real-time collaboration for distributed teams.
📄 Veterinary Clinic Dashboard in Excel — Full clinic analytics with 5 analysis pages covering patient, financial, and service insights.
📄 Veterinary Clinic Dashboard in Power BI — Advanced interactive analytics with DAX-powered visuals and drill-through pages.
📄 Browse all Excel Dashboard Templates on NextGenTemplates.com — 650+ options across every industry.
Frequently Asked Questions
What KPIs does the Pet Care Business Dashboard in Excel track?
The Pet Care Business Dashboard in Excel tracks 5 headline KPIs on the Overview page: Total Records, Total Revenue, Total Cost, Total Product Sales, and Avg. Satisfaction. All five KPI cards update automatically when you click Refresh All after entering new data into the Data Sheet.
How many charts are included?
The Pet Care Business Dashboard in Excel includes 16 pre-built charts across 5 pages. The charts cover booking channel profitability, service revenue by type, pet type cost analysis, staff performance rankings, location completion rates, monthly revenue trends, and profit margin trends by month.
How long does setup take?
Setup takes under 10 minutes. Open the .xlsx file in Excel, go to the Data Sheet, replace the sample records with your own data keeping the column headers intact, then click Data → Refresh All. All 5 dashboard pages rebuild automatically — no formula edits or chart repointing required.
Does this work on Mac?
Yes. The Pet Care Business Dashboard in Excel works in Microsoft Excel for Mac (2019 and later). Slicers, pivot tables, and Refresh All behave identically on Windows and Mac. There are no VBA macros, so there is no security prompt to clear on Mac.
How does this compare to PetDesk or Gingr?
PetDesk starts at approximately $99/month and Gingr at $249/month — both include scheduling and client communication tools. The Pet Care Business Dashboard in Excel costs $17.99 one-time and focuses entirely on analytics: 16 charts covering revenue, costs, satisfaction, and staff performance. For businesses that already have a booking tool and need data visibility without a second subscription, this dashboard fills that gap at a fraction of the cost.
Can I add new service types or staff members?
Yes. Add new rows to the Data Sheet with your service types, staff names, or locations. Click Data → Refresh All and the slicers, pivot charts, and KPI cards automatically include the new values — no structural changes to the dashboard required.
Is there a Google Sheets version?
Yes. The Pet Care Business Dashboard in Google Sheets is available for teams that prefer cloud-based, browser-accessible analytics with real-time collaboration and no desktop software required.
About the Author
Built by PK — Microsoft Certified Professional with 15+ years of Excel, Google Sheets, and Power BI experience. Founder of NextGenTemplates, reaching 300K+ subscribers across YouTube channels (@PK-AnExcelExpert, @NextGenTemplates, @NeoTechNavigators). Every template is hand-built and tested before release.
Conclusion
The pet care industry is growing fast, and the businesses that win are the ones tracking the right numbers at the right time. The Pet Care Business Dashboard in Excel gives pet grooming salons, boarding facilities, and multi-service operators a clear, structured view of revenue, costs, staff performance, and customer satisfaction — in a tool they already own, with setup in under 10 minutes.
Click here to Purchase Pet Care Business Dashboard in Excel →
✅ Instant download · One-time payment · No subscription · Lifetime access
📺 Step-by-step tutorials: Youtube.com/@PK-AnExcelExpert
📅 Last updated: May 2026