The Pet Care Business Dashboard in Power BI tracks 5 KPI cards across 5 interactive report pages, with 16 pre-built visuals and slicers covering Service Type, Booking Channel, Pet Type, Pet Size, and Location. According to the American Pet Products Association, the U.S. pet industry generates over $147 billion annually, yet most pet care businesses still rely on spreadsheets and instinct to make pricing and staffing decisions. This dashboard closes that gap. Setup takes under 10 minutes — connect your transaction data and every chart updates automatically. No DAX writing, no consulting fees, no subscription.
Whether you operate a grooming salon, a multi-location veterinary clinic, or a boarding and daycare facility, turning raw booking records into revenue intelligence is the difference between growing and guessing. This Power BI template gives pet care operators that clarity at a one-time price of $17.99.
📥 Click here to Purchase Pet Care Business Dashboard in Power BI
Key Features of Pet Care Business Dashboard in Power BI
This dashboard delivers 5 high-level KPI cards (Total Transactions, Total Revenue, Total Cost, Total Product Sales, and Avg Satisfaction) on the Overview page — giving owners and managers a full financial picture in under 30 seconds. Every card recalculates instantly when a slicer filter is applied. This Pet Care Business Dashboard in Power BI is the only Power BI template built specifically around pet service transaction data, with chart selections and filter categories designed for how pet businesses actually measure performance.
🔹 5-page interactive report — Overview, Service Analysis, Customer Insights, Staff & Location, and Revenue Trends, each designed for a distinct business question.
🔹 16 pre-built visuals — bar charts, line charts, and KPI cards built for pet care transaction data with zero custom DAX required.
🔹 Slicer-driven filtering — instantly segment data by Service Type, Booking Channel, Pet Type, Pet Size, and Location across all pages simultaneously.
🔹 Profit Margin and Cancellation Rate tracking — critical metrics for pricing decisions and operational scheduling that most generic dashboards omit.
🔹 Staff revenue leaderboard — identifies your top 5 revenue-generating staff members so you can identify and replicate what’s working.
🔹 Monthly trend analysis — track revenue and profit margin by month to spot seasonal patterns and plan staffing levels ahead of demand peaks.
🔹 Pet Type satisfaction breakdown — understand which animals generate the highest satisfaction scores and revenue per visit to inform service development.
Dashboard Pages Explanation
1. Overview Page
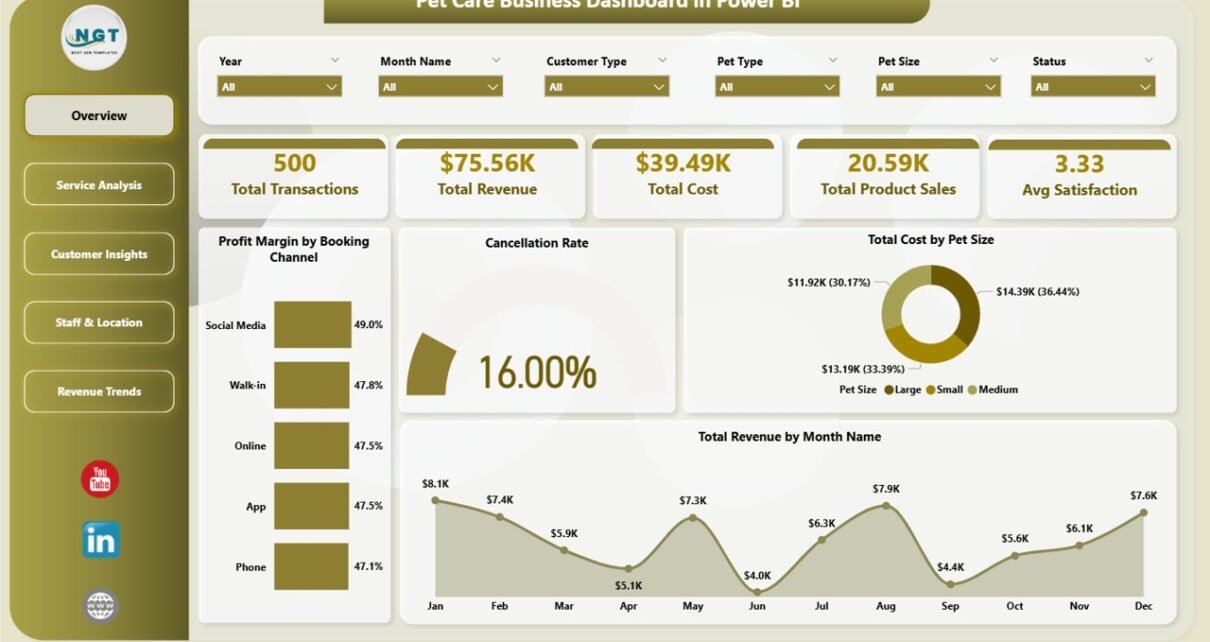
The Overview page is the command center for any pet care business. Five KPI cards across the top surface the most critical numbers: Total Transactions, Total Revenue, Total Cost, Total Product Sales, and Avg Satisfaction. Below the cards, four charts provide deeper context:
- Profit Margin by Booking Channel — reveals which channel (walk-in, online, referral) delivers the highest margin, helping you focus marketing spend on what actually converts profitably.
- Cancellation Rate — shows appointment cancellation as a trend or category breakdown, critical for identifying scheduling and retention weak points.
- Total Cost by Pet Size — breaks down operating costs by small, medium, and large pets so you can price each tier accurately.
- Total Revenue by Month Name — month-over-month revenue trend to spot seasonality and plan ahead.
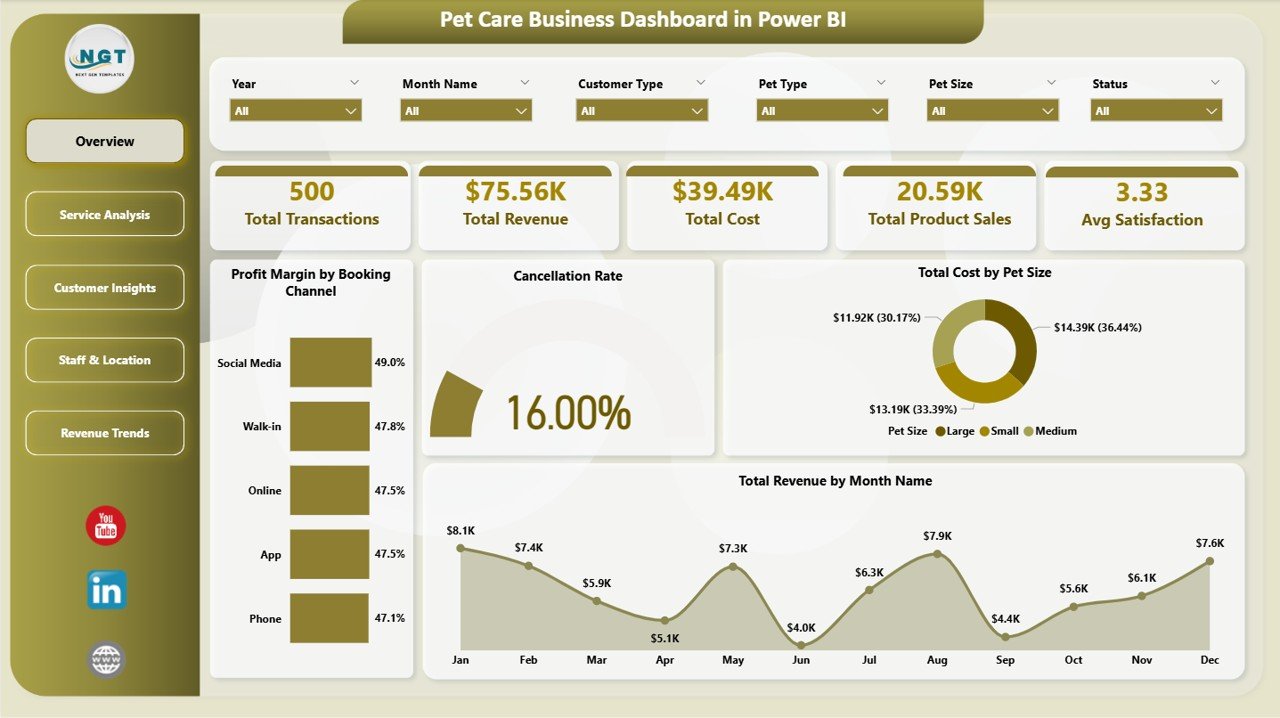
Pet Care Business Dashboard in Power BI – Overview Page
2. Service Analysis
This page answers the core business question: which services are worth offering? Three visuals break down service performance across your entire catalog:
- Total Revenue by Service Type — ranks grooming, boarding, daycare, veterinary, and retail services by gross revenue.
- Avg Satisfaction by Service Type — cross-references revenue with customer satisfaction to identify high-revenue but low-satisfaction services that need improvement.
- Avg Revenue Per Visit by Service Type — a critical pricing benchmark showing the average dollar value of each service appointment.
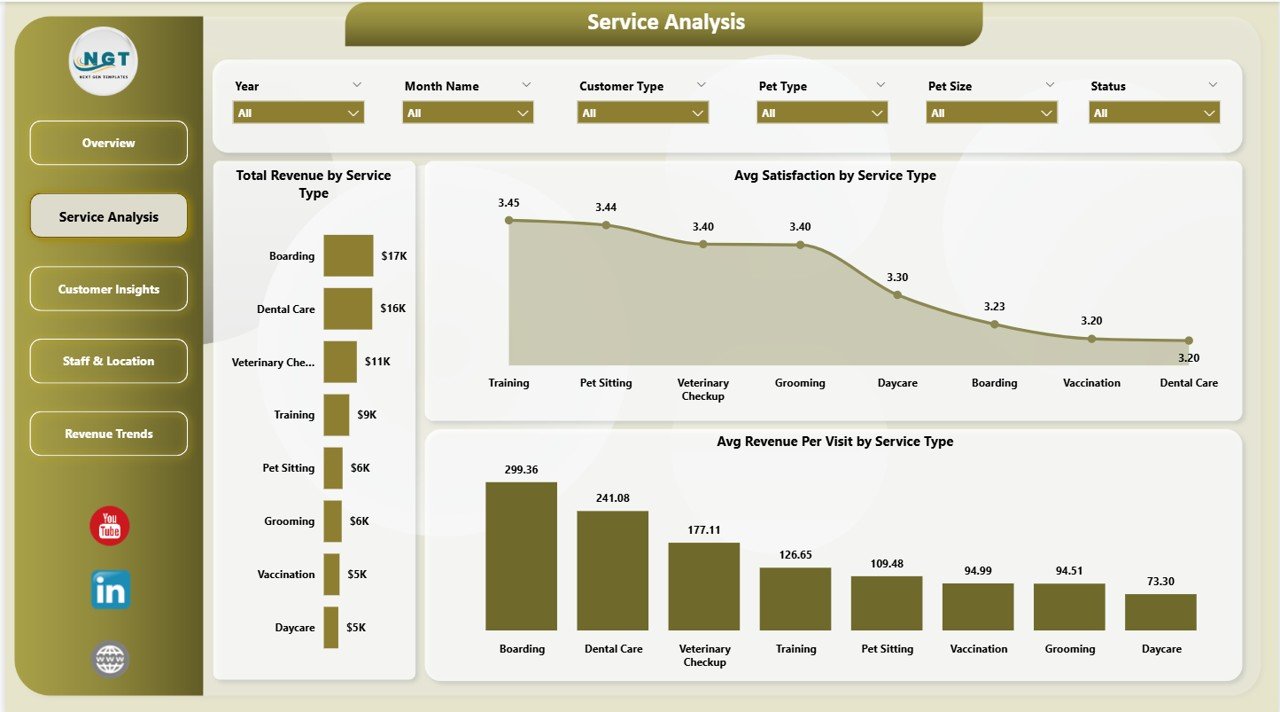
Pet Care Business Dashboard in Power BI – Service Analysis
3. Customer Insights
Understanding who your customers are and how they book determines your growth strategy. This page provides three critical insights:
- Total Transactions by Booking Channel — shows whether phone, walk-in, app, or referral drives the most business so you invest marketing dollars where customers already are.
- Avg Satisfaction by Pet Type — reveals which animals (dogs, cats, birds, exotic pets) are most satisfied, helping you tailor and promote specific services.
- Total Revenue by Customer Type — segments revenue between new and returning customers to measure loyalty and acquisition cost effectiveness.
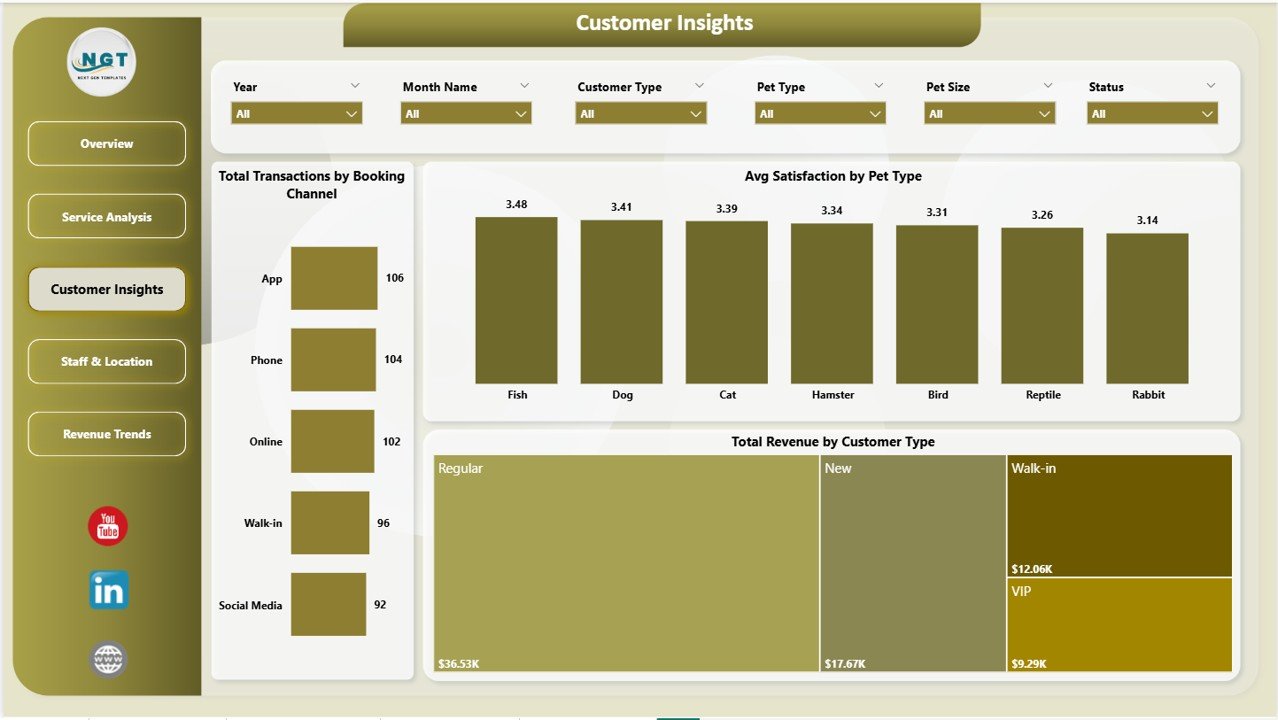
Pet Care Business Dashboard in Power BI – Customer Insights
4. Staff & Location
For multi-staff or multi-location pet care businesses, this page is indispensable:
- Completion Rate by Location — measures the percentage of scheduled appointments completed at each site, pinpointing operational gaps across your network.
- Total Revenue by Top Five Staff Member — a staff leaderboard identifying which team members generate the highest revenue so you can recognize top performers and coach others.
- Total Revenue by Location — compares revenue performance across all business locations to inform expansion or resource reallocation decisions.
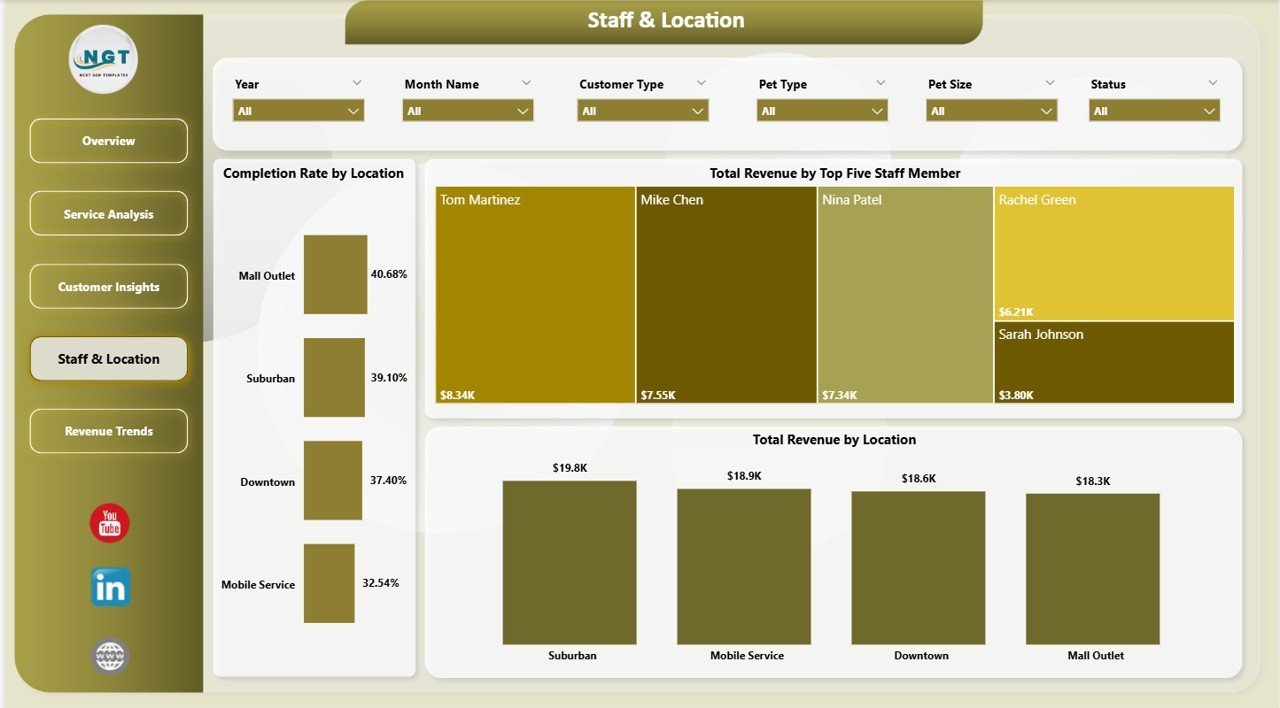
Pet Care Business Dashboard in Power BI – Staff & Location
5. Revenue Trends
The Revenue Trends page brings the long-term view into focus for strategic planning:
- Total Revenue by Pet Type — tracks how much each animal category contributes to overall revenue over time, revealing which pet segments are growing.
- Total Revenue by Status — breaks revenue by appointment status (completed, cancelled, pending) to quantify the financial cost of cancellations directly.
- Profit Margin by Month Name — tracks net margin month by month so you see exactly when profitability peaks and when costs compress margins.
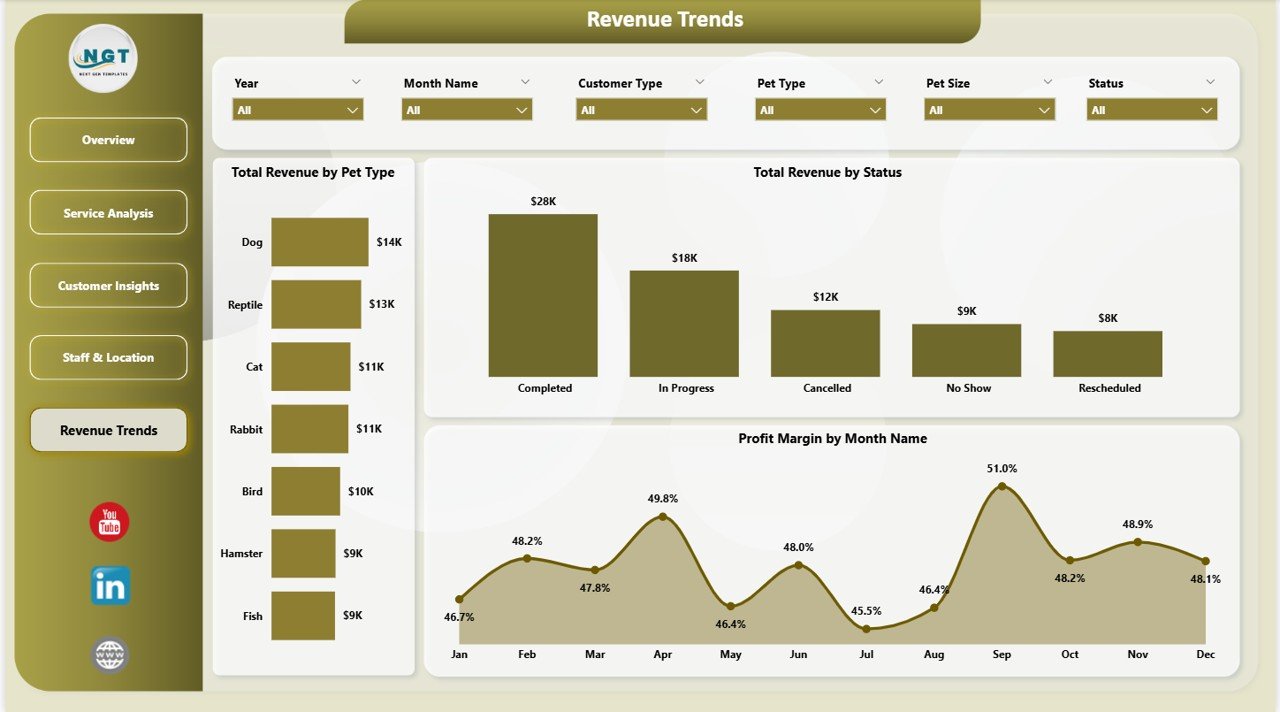
Pet Care Business Dashboard in Power BI – Revenue Trends
Pet Care Business Dashboard in Power BI vs. Microsoft Excel vs. Paid Veterinary SaaS — Feature Comparison
| Feature | Pet Care Business Dashboard in Power BI | Excel Dashboard | DaySmart Vet / VetClinic SaaS |
|---|---|---|---|
| Cost | $17.99 one-time | Included with Excel | $50–300+ / month |
| Platform | Power BI Desktop (free) | Microsoft Excel | Web browser / app |
| Setup time | Under 10 minutes | 30–60 min | 2–8 hours onboarding |
| Interactive slicers/filters | ✅ 5 slicers across all pages | Limited | ✅ Yes |
| Customizable fields | ✅ Fully editable .pbix | ✅ Yes | ❌ Fixed templates |
| Staff revenue leaderboard | ✅ Top 5 staff built-in | Manual | ✅ Yes |
| Pet type satisfaction analysis | ✅ Built-in | Manual | Partial |
| Year-1 cost (1 user) | $17.99 total | ~$0 (Excel included) | $600–3,600 |
| No subscription required | ✅ | ✅ | ❌ |
For pet care businesses that want clear revenue and satisfaction analytics without committing to expensive practice management software, the Pet Care Business Dashboard in Power BI sits in the sweet spot.
Who Should Use This Template
✅ Perfect for:
- Pet grooming salon owners tracking daily revenue, cost, and cancellation rates across booking channels
- Veterinary clinic managers who need staff performance rankings and location revenue comparisons
- Dog boarding and daycare facility operators analyzing booking channels and pet type revenue trends
- Multi-service pet businesses tracking which services deliver the highest margin per visit
- Business owners presenting monthly KPI summaries and revenue trends to partners or investors
❌ Not a fit if:
- You need real-time appointment booking and online scheduling — this is a reporting dashboard, not a booking platform
- Your business requires cloud-based multi-user simultaneous editing (Power BI Desktop is local; Power BI Service requires a separate license for sharing)
- You operate a large veterinary hospital chain needing full ERP, inventory management, and regulatory compliance modules
Real-World Use Cases
Maria runs a 3-groomer pet salon in Phoenix. At the end of each month, she loads her booking data into the dashboard and uses the Profit Margin by Booking Channel chart to discover that walk-in customers generate 22% higher margins than online bookings — so she reduces platform fees by shifting promotions to direct referrals. The Avg Satisfaction by Service Type page shows her nail trimming appointments score 15% lower than grooming. She uses that insight to retrain her junior groomer and closes the satisfaction gap within two months.
James manages a 4-location pet boarding network in the UK. He uses the Staff & Location page to identify that his Birmingham site completes 91% of booked appointments vs. 76% at his Manchester location. He investigates, discovers a staffing gap on weekend mornings, and adds a part-time hire. Monthly revenue at that site increases 18% the following quarter.
Dr. Priya operates a mixed-service veterinary and grooming clinic in Singapore. Her Revenue Trends page shows that cat grooming revenue peaks in March and October. She uses that data to run pre-peak promotions in February and September, filling her calendar before the seasonal surge and averaging 12% more monthly revenue year over year.
📥 Click here to Purchase Pet Care Business Dashboard in Power BI
Advantages of Pet Care Business Dashboard in Power BI
The biggest advantage is specificity. Generic business dashboards force pet care owners to adapt metrics designed for retail or manufacturing. This template is built exclusively around pet service operations — the KPI cards, chart selections, and slicer categories (Booking Channel, Pet Type, Pet Size, Service Type, Location) all reflect how pet businesses actually measure performance.
Power BI’s rendering engine also handles large transaction datasets far better than Excel pivot tables, keeping filters responsive even with 12 months of daily bookings loaded. And because Power BI Desktop is free to download from Microsoft, there is no additional software cost beyond the one-time template purchase of $17.99.
Opportunities for Improvement
This template uses a flat data table format. Businesses with separate normalized tables for staff, customers, and locations will need to consolidate their data into the expected structure before loading. The template does not include a native Power BI Service publishing workflow, so sharing reports across teams requires a Power BI Pro license (available from Microsoft separately). Future versions could add customer lifetime value metrics and automated booking source attribution by campaign.
Best Practices
For the most accurate insights, load at least 90 days of transaction data before drawing conclusions from the Revenue Trends page — shorter windows make normal week-to-week variation look like trends. Use the Pet Size slicer on the Overview page to separate pricing tiers before reviewing the Profit Margin by Booking Channel chart, since channel margins often differ significantly by pet size. Review the Cancellation Rate chart monthly rather than weekly — cancellation patterns are typically seasonal, and weekly reviews lead to overreactions.
For a deeper understanding of Power BI data modeling best practices, see the official Microsoft Power BI guidance documentation.
Explore Relevant Templates
Looking for the same analytics in a different platform? The Pet Care Business Dashboard in Excel delivers the same 5-page analysis in Microsoft Excel — ideal if you prefer pivot tables over Power BI visuals. The Gym Retention Dashboard in Power BI applies a similar multi-page Power BI structure to membership and attendance analytics.
Browse the complete Power BI Dashboard Templates collection on NextGenTemplates.com for 100+ industry-specific Power BI reports available for instant download.
Related tutorials on pk-anexcelexpert.com: Pet Care Business Dashboard in Excel | Gym Retention Dashboard in Power BI | Accountancy Practice Dashboard in Power BI
Frequently Asked Questions
What KPIs does the Pet Care Business Dashboard in Power BI track?
The Pet Care Business Dashboard in Power BI tracks 5 high-level KPIs on the Overview page: Total Transactions, Total Revenue, Total Cost, Total Product Sales, and Avg Satisfaction. All KPI cards recalculate instantly when slicer filters — covering Service Type, Booking Channel, Pet Type, Pet Size, and Location — are applied.
Do I need to know DAX to use this Power BI dashboard?
No DAX knowledge is required. The Pet Care Business Dashboard in Power BI comes with all measures and visuals pre-built inside the .pbix file. You simply replace the sample data table with your own transaction export and every chart updates automatically. Power BI Desktop is free from Microsoft.
How does this compare to paid pet care practice management software?
The Pet Care Business Dashboard in Power BI costs $17.99 as a one-time purchase — no monthly subscription, no per-user fees. Paid SaaS platforms like DaySmart Vet or VetClinic typically run $50–300 per month. This template focuses on business intelligence and reporting rather than appointment scheduling or invoicing.
Can I filter the dashboard by location or staff member?
Yes. The Staff & Location page shows Total Revenue by Top Five Staff Member and Completion Rate by Location. Cross-page slicers also let you filter all charts and KPI cards to a specific location simultaneously, giving site-level performance visibility across the full 5-page report.
How long does setup take?
Setup for the Pet Care Business Dashboard in Power BI takes under 10 minutes. Download the .pbix file, open it in Power BI Desktop, replace the sample data table with your own booking export (CSV or Excel format), and every visual updates automatically without any formula or layout changes.
What data format does the dashboard require?
The dashboard uses a flat transaction table with fields for date, service type, booking channel, pet type, pet size, location, staff name, revenue, cost, and satisfaction score. Most pet care booking systems export this as a CSV or Excel file that can be pasted directly into the template data table.
Is there an Excel version of this pet care dashboard available?
Yes. The Pet Care Business Dashboard in Excel is available as a separate template on NextGenTemplates.com. It covers the same 5-page analysis using Excel pivot charts and slicers, making it the right choice for businesses that prefer Microsoft Excel over Power BI.
About the Author
Built by PK — Microsoft Certified Professional with 15+ years of Excel, Google Sheets, and Power BI experience. Founder of NextGenTemplates, reaching 300K+ subscribers across YouTube channels (@PK-AnExcelExpert, @NextGenTemplates, @NeoTechNavigators). Every template is hand-built and tested before release.
Conclusion
The Pet Care Business Dashboard in Power BI gives grooming salon owners, veterinary clinic managers, and boarding facility operators a clear, fast, and affordable way to convert booking data into revenue intelligence. Five interactive pages cover every dimension of pet care business performance — from service margin to staff leaderboards to monthly profit trends — for a one-time cost that pays for itself in the first hour of use.
📥 Click here to Purchase Pet Care Business Dashboard in Power BI
✅ Instant download · One-time payment · No subscription
📅 Last updated: May 2026
🎥 Watch step-by-step tutorials: Youtube.com/@PK-AnExcelExpert