In this article, we have created the Investment Banking KPI Dashboard in Excel. This is a ready-to-use template that tracks all your investment banking KPIs in one place — covering MTD and YTD Actual, Target, and Previous Year data across 7 structured worksheets. According to Microsoft Learn, well-structured Excel models with consistent named ranges and conditional formatting significantly reduce reporting time — this template is built on exactly those principles.
Investment banking teams that rely on spreadsheet-based KPI reporting spend an average of 6–12 hours per month manually compiling and formatting performance data. This dashboard eliminates that overhead by automating Actual vs Target vs PY variance calculations, conditional arrow indicators, and trend charts from a single data input point. Setup takes under 15 minutes, and every chart and indicator updates instantly once you enter your monthly actuals.
🌍 Join 8,400+ teams in 40+ countries using NextGenTemplates to replace expensive analytics platforms with one-time-purchase Excel Finance Templates.
✅ Instant download · One-time payment · No subscription · Lifetime access
Key Features of Investment Banking KPI Dashboard in Excel
🛝 Click here to Purchase the Investment Banking KPI Dashboard in Excel
The Investment Banking KPI Dashboard in Excel is built around four non-negotiable requirements for finance teams: speed of insight, accuracy of variance reporting, flexibility of KPI definition, and clean visual output for executive presentations.
MTD and YTD dual-view monitoring — Every KPI simultaneously shows Month-to-Date and Year-to-Date Actual, Target, and Previous Year data in a single view. This eliminates the need to toggle between separate reporting tabs or build multiple pivot tables to compare time periods.
Conditional formatting variance arrows — The Target vs Actual and PY vs Actual columns display auto-formatted up/down arrows in green and red. The arrows use proper LTB/UTB logic, so metrics like deal cycle time (Lower the Better) invert their color signal compared to revenue metrics (Upper the Better).
Dynamic month selector — A single dropdown on cell D3 of the Dashboard sheet switches the entire dashboard to the selected reporting month. All MTD numbers, KPI trend charts, and variance columns recalculate instantly.
KPI Trend charts with LTB/UTB classification — The KPI Trend sheet plots MTD and YTD trend lines for Actual, Target, and PY side by side for any KPI you select.
Fully configurable KPI library — The KPI Definition sheet lets you define every KPI from scratch: name, group, unit, formula, and description. Investment banking KPIs differ by firm, desk, and coverage group — you are never locked into a predefined list.
Dashboard Pages Explanation
The Investment Banking KPI Dashboard in Excel contains 7 worksheets. Here is a detailed explanation of each:
1. Home Sheet
Home Sheet
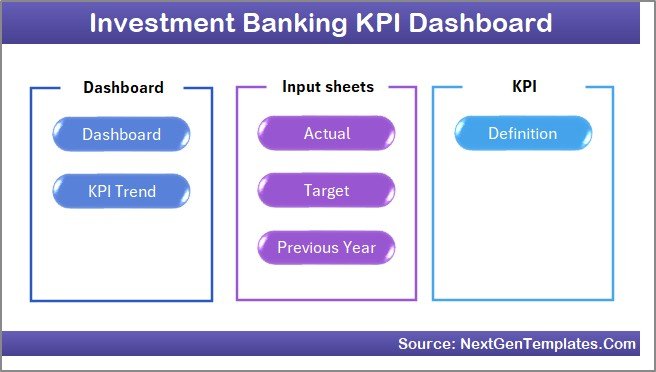
This is the index sheet with 6 navigation buttons that jump directly to each working sheet. The Home sheet is designed for client-facing presentations and internal reporting environments where clean navigation matters.
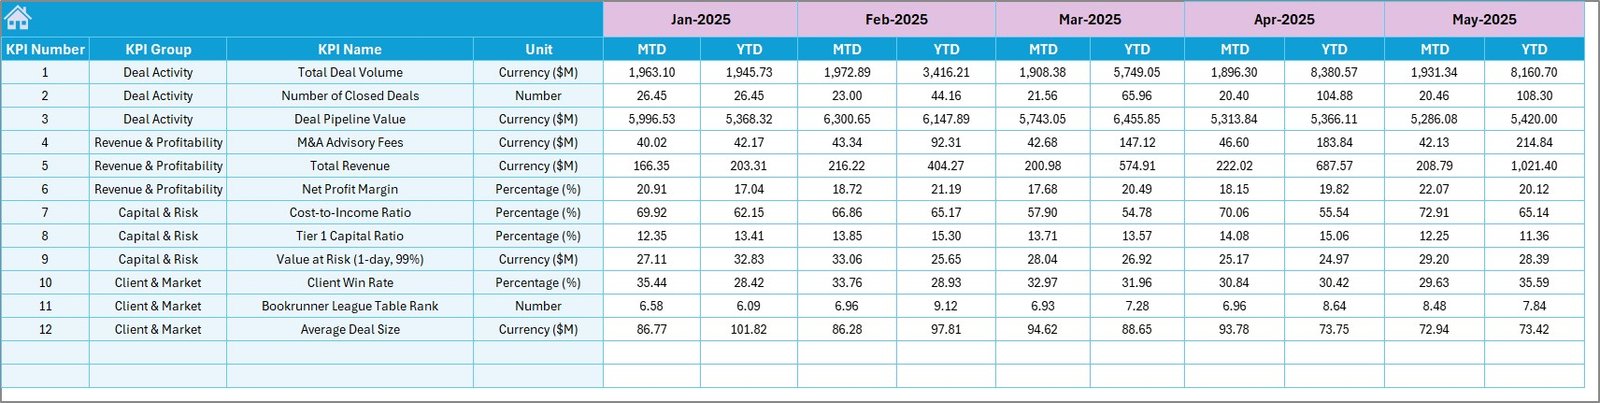
2. Dashboard Sheet
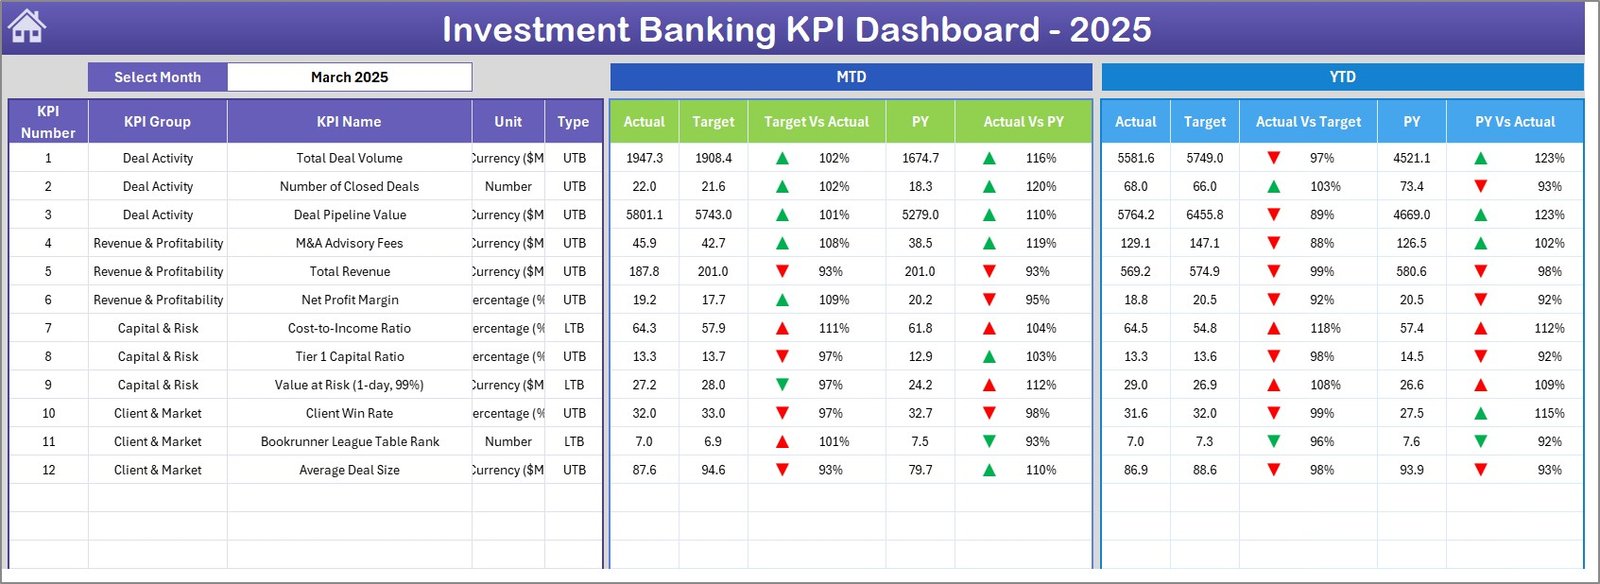
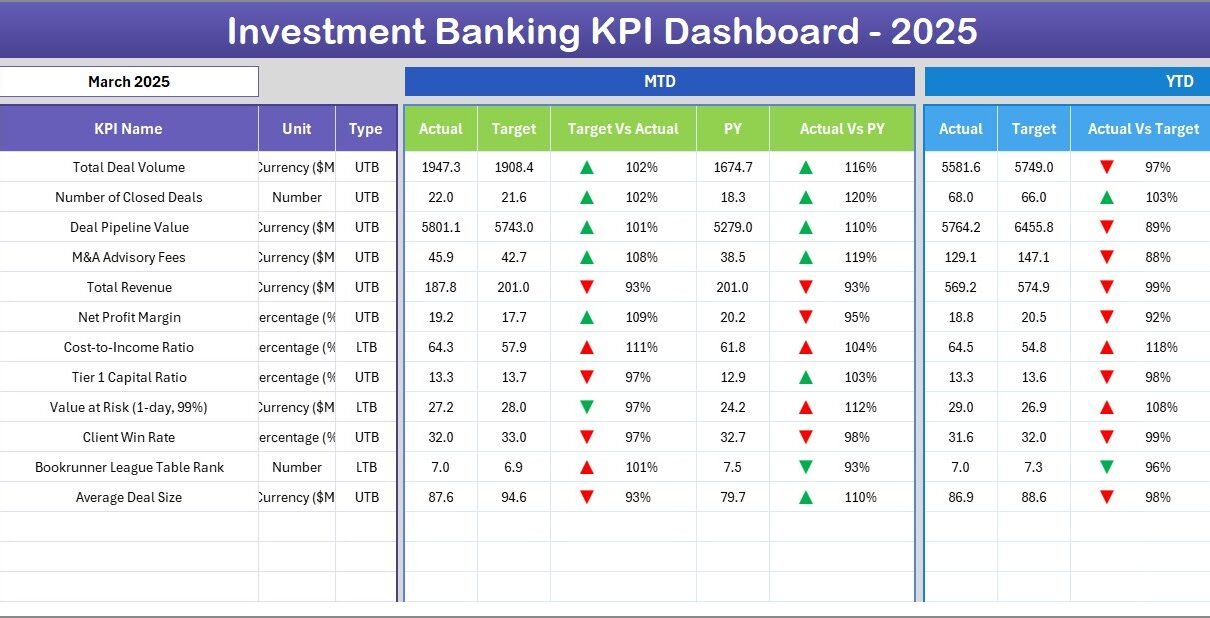
Investment Banking KPI Dashboard
This is the main reporting sheet. On cell D3, select the reporting month from a dropdown. The entire dashboard updates to show all KPIs for that month. The Dashboard displays MTD Actual, MTD Target, MTD Previous Year, plus Target vs Actual and PY vs Actual variance columns with conditional formatting arrows. The same structure repeats for YTD data, giving you a complete 6-column performance view per KPI.
3. KPI Trend Sheet
KPI Trend Sheet
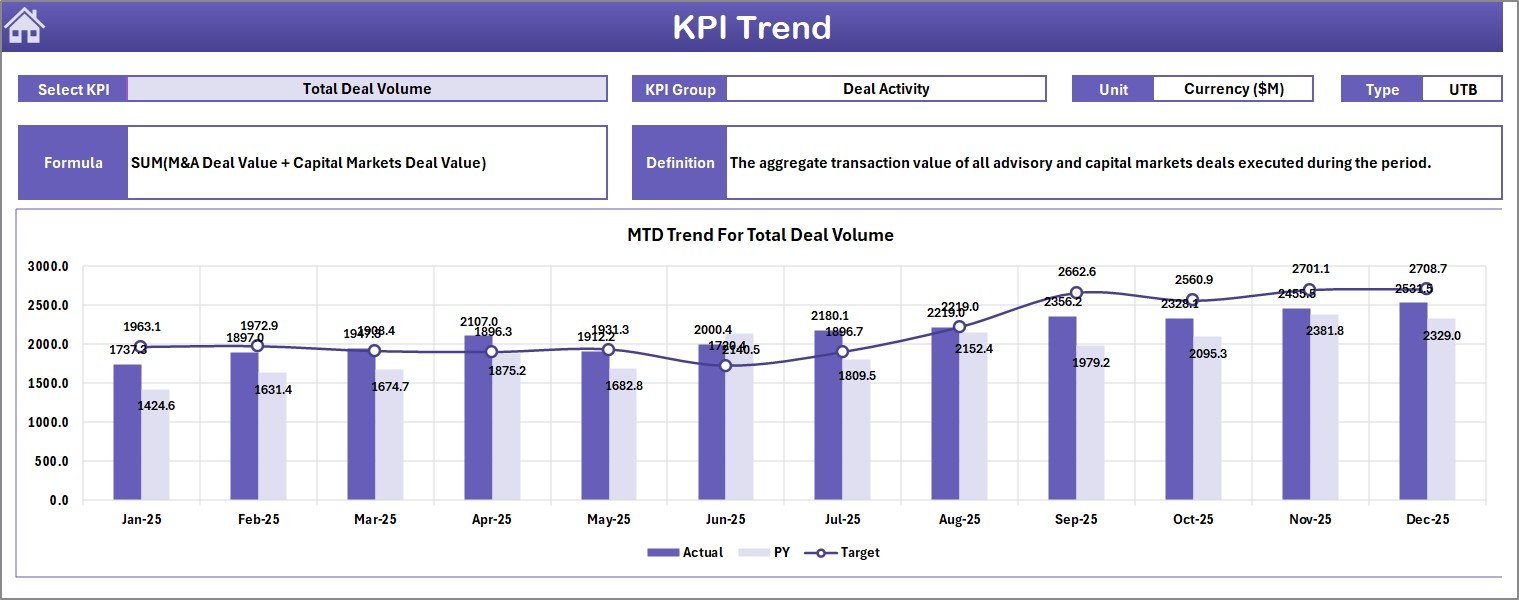
Select any KPI from the dropdown on cell C3. The sheet displays the KPI Group, Unit, Type (LTB or UTB), Formula, and Definition. Below the metadata, two trend charts display: one for MTD and one for YTD, each plotting Actual, Target, and PY values over the year.
4. Actual Numbers Input Sheet
Actual Numbers Input Sheet
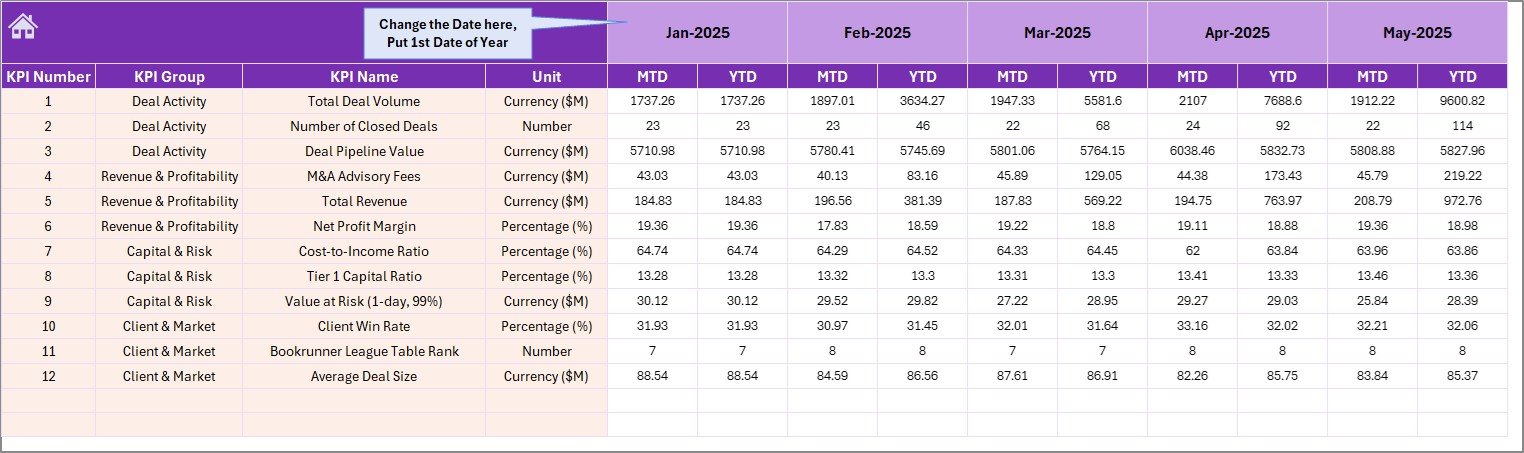
Enter actual performance numbers for each KPI here, for both MTD and YTD. Cell E1 controls the fiscal year start month — enter this once and all period labels cascade automatically.
5. Target Numbers Input Sheet
Target Number Input Sheet
Enter monthly KPI targets for both MTD and YTD. Targets power the Target vs Actual variance and conditional formatting arrows on the Dashboard sheet.
6. Previous Year Numbers Sheet
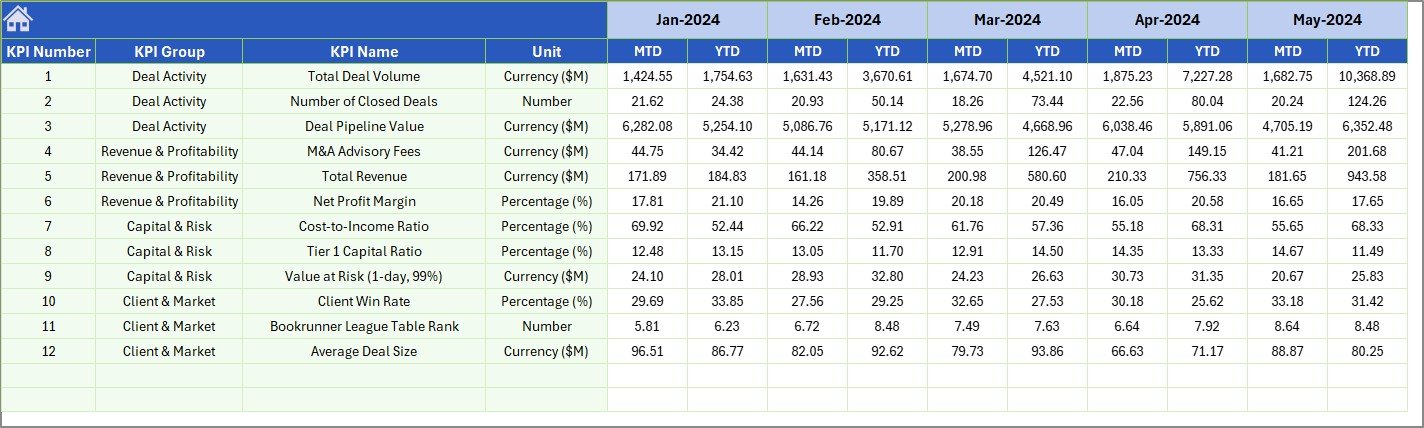
Previous Year Number Input Sheet
Enter last year’s KPI data in the same format as the Actual Numbers sheet. This powers the PY vs Actual variance columns and the PY trend lines on the KPI Trend charts.
7. KPI Definition Sheet
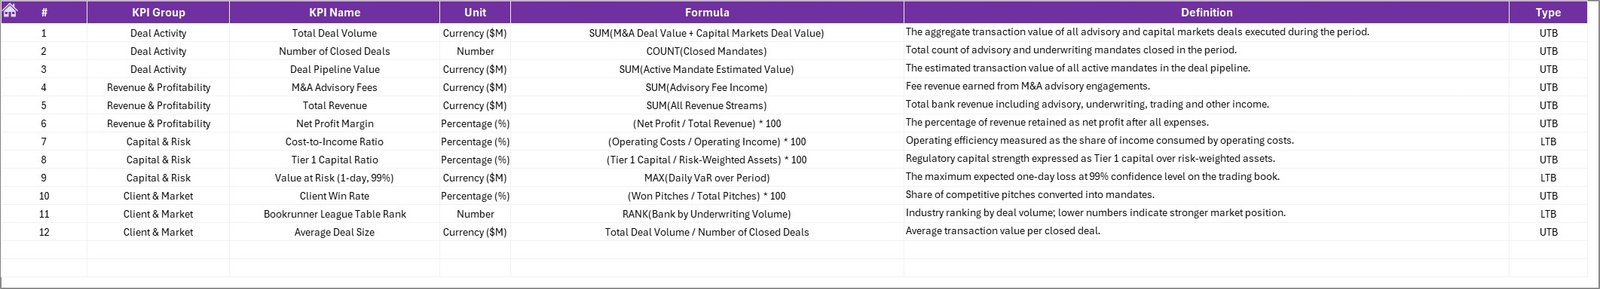
KPI Definition Sheet
Enter KPI Name, KPI Group, Unit, Formula, and KPI Definition. Mark each KPI as LTB (Lower the Better) or UTB (Upper the Better) in the final column. This classification drives the conditional formatting logic across the Dashboard and KPI Trend sheets.
Investment Banking KPI Dashboard in Excel vs. Google Sheets vs. Bloomberg Terminal — Feature Comparison
| Feature | Investment Banking KPI Dashboard (Excel) | Google Sheets Equivalent | Bloomberg Terminal |
|---|---|---|---|
| Cost | $14.99 one-time ✅ | Free (manual build) | $2,000–$24,000 per seat per year |
| MTD + YTD dual view | Built-in ✅ | Manual setup required | Custom configuration needed |
| LTB / UTB KPI logic | Pre-built ✅ | Not available by default | N/A for internal KPIs |
| Conditional variance arrows | Auto-formatted ✅ | Requires Apps Script | Limited customization |
| Works offline | Yes ✅ | Requires internet | Requires live connection |
| Setup time | Under 15 minutes ✅ | 4–8 hours DIY | Weeks of onboarding |
| Year-1 cost (5 users) | $14.99 total ✅ | $0 + significant setup time | $10,000–$120,000+ |
For investment banking teams that need structured internal KPI reporting without Bloomberg’s price tag or Google Sheets’ setup overhead, this Excel dashboard sits in the sweet spot.
Who Should Use This Template
Perfect for:
- Investment banking analysts and associates managing monthly KPI reporting for their deal desk or coverage team
- Finance managers and FP&A teams at boutique advisory firms or mid-market banks needing structured KPI oversight
- CFOs who need MTD/YTD performance data with YoY comparison for board and partner presentations
- M&A teams tracking pipeline conversion rates, fee revenue per banker, and deal closure velocity
Not a fit if:
- You need live market data feeds (Bloomberg or Refinitiv are the right tools)
- Your organization requires real-time multi-user cloud collaboration (consider Google Sheets finance templates)
- You do not have Microsoft Excel 2016 or later
Real-World Use Cases
🛝 Click here to Purchase the Investment Banking KPI Dashboard in Excel
Marcus leads analytics at a mid-market M&A advisory. He uses the Investment Banking KPI Dashboard in Excel to report deal pipeline conversion rates, fee revenue per banker, and pitch-to-close ratios to partners every month — without needing a BI developer or a Bloomberg subscription.
Priya manages FP&A at a financial services holding company. She tracks 15 investment banking KPIs including ROE, AUM growth, and deal closure rate across three subsidiaries. The KPI Trend sheet lets her present rolling trend lines to the CFO with a single dropdown selection — no manual chart updates before every meeting.
Advantages of Investment Banking KPI Dashboard in Excel
The core advantage is the combination of time-to-insight speed and reporting flexibility. Most teams spend hours each month collating KPI data from multiple sources. This dashboard eliminates that bottleneck through structured input sheets feeding an automated Dashboard with conditional formatting, variance indicators, and trend charts already built in. The LTB/UTB KPI classification system ensures correct performance direction logic for finance metrics. The template is also fully offline-capable, which is important for investment banking environments where sensitive financial data should not be stored on cloud platforms without IT approval.
Opportunities for Improvement
The template operates on manual data entry and does not integrate directly with ERP or financial systems. Teams with 50+ KPIs may find the Dashboard scroll less convenient for executive summaries and may want to build a dedicated top-10 KPI overview tab. Pre-configured trend charts may need manual style adjustments for firms with specific branding requirements.
Best Practices
Set up the KPI Definition sheet before entering any data — it is the control layer for KPI names, LTB/UTB logic, and all chart labels. Set the fiscal year start month in E1 of the Actual Numbers Input sheet once and do not change it mid-year. Update Target and Previous Year sheets at the start of each fiscal year. Use the KPI Trend sheet for executive presentations to walk through individual KPI performance stories using the dropdown-driven MTD/YTD chart pair.
Explore Relevant Templates
💎 Save 37% — Finance & Accounting Command Center Bundle — 8 premium finance templates across Excel, Power BI, and Google Sheets.
📊 Finance Summary Dashboard in Excel — Track income, expenses, and profit margins.
📈 Budget Forecasting Dashboard in Excel — Plan, forecast, and flag budget variances across departments.
Frequently Asked Questions
🛝 Click here to Purchase the Investment Banking KPI Dashboard in Excel
What KPIs does the Investment Banking KPI Dashboard in Excel track?
The template does not ship with a fixed KPI list — you define every KPI in the KPI Definition sheet. Typical investment banking KPIs include deal revenue, AUM growth, fee income, pipeline conversion rate, ROE, and deal cycle time. All metrics update automatically based on your definitions.
How does this compare to Bloomberg Terminal for KPI tracking?
Bloomberg Terminal delivers live market data; this dashboard is for internal performance KPI tracking. The Investment Banking KPI Dashboard in Excel costs a one-time $14.99 vs Bloomberg’s $2,000+ per seat per month — right-sizing the tool for internal reporting needs.
Can I add more KPIs beyond the default rows?
Yes. Add rows in the KPI Definition sheet and matching rows in the input sheets. The dashboard and trend charts reference these rows dynamically, so new KPIs appear automatically without rebuilding formulas.
Does this require macros or VBA?
No. The Investment Banking KPI Dashboard in Excel runs on native Excel formulas and conditional formatting only. No macros or VBA are used. It works on Excel 2016+ on Windows and Mac without any macro security prompts.
How long does setup take?
Under 15 minutes: define KPIs, set the fiscal year start month, enter annual targets, add prior year actuals, then input your first month’s data. The full dashboard, variance indicators, and trend charts are ready immediately.
What Excel version is required?
Microsoft Excel 2016 or later on Windows or Mac. Compatible with Microsoft 365 (cloud version). The file is in .xlsx format and uses only standard Excel conditional formatting and charting features available in Excel 2016+.
About the Author
Built by PK — Microsoft Certified Professional with 15+ years of Excel, Google Sheets, and Power BI experience. Founder of NextGenTemplates, reaching 300K+ subscribers across YouTube channels. Every template is hand-built and tested before release.
Conclusion
The Investment Banking KPI Dashboard in Excel gives finance professionals a structured, automated, and fully configurable way to track investment banking performance metrics with MTD/YTD reporting, conditional variance arrows, LTB/UTB logic, and dynamic trend charts — all in one Excel file.
🛝 Click here to Purchase the Investment Banking KPI Dashboard in Excel
✅ Instant download · One-time payment · No subscription
📅 Last updated: May 2026
Visit our YouTube channel for step-by-step video tutorials
Youtube.com/@PK-AnExcelExpert