The Franchise Performance Dashboard in Excel monitors 5 headline KPIs across 5 interactive analysis pages, with 4 pre-built charts on the Overview page alone — covering Total Revenue, Total Operating Cost, Total Royalty Fee, Avg. Satisfaction, and Profit Margin % by Region. Setup takes under 10 minutes: paste your franchise records into the Data sheet, click Refresh All, and every pivot table, KPI card, and chart updates instantly. For franchise operators who need professional analytics without a SaaS subscription, this template delivers for a one-time cost of $17.99.
👉 Click here to Purchase Franchise Performance Dashboard in Excel
Key Features of Franchise Performance Dashboard in Excel
The template ships as a single .xlsx file — pivot tables, slicers, and charts that work in Excel 2016 and later, including Microsoft 365. No macros, no VBA. Key differentiators: Royalty Fee tracking at the network level (a Total Royalty Fee KPI card on the Overview), Compliance and Satisfaction scoring by Franchise Tier and Business Type on the Operations & Quality page, and slicer-driven interactivity so Region/Franchise Tier/Status filters update every chart on the page simultaneously.
All charts and KPIs are powered by pivot tables on the Support sheet. After updating the Data sheet, click Data → Refresh All and the entire dashboard synchronizes in seconds. According to Microsoft’s Excel documentation, pivot-based dashboards are the recommended architecture for regularly updated data — and this template follows that pattern exactly.
Dashboard Pages Explanation
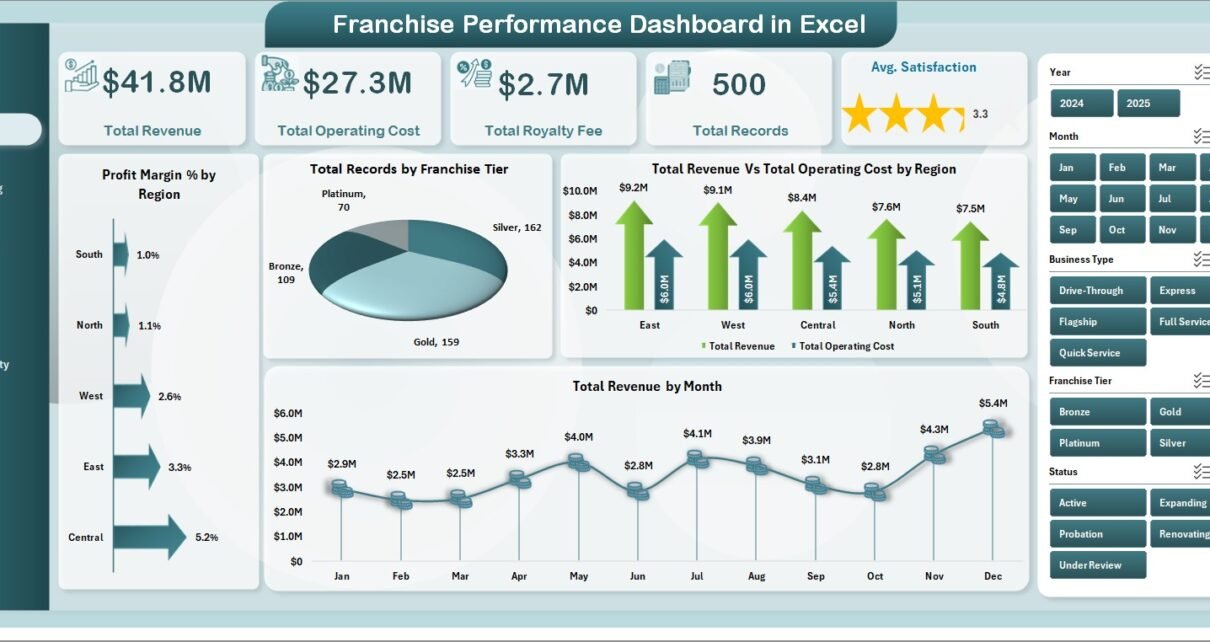
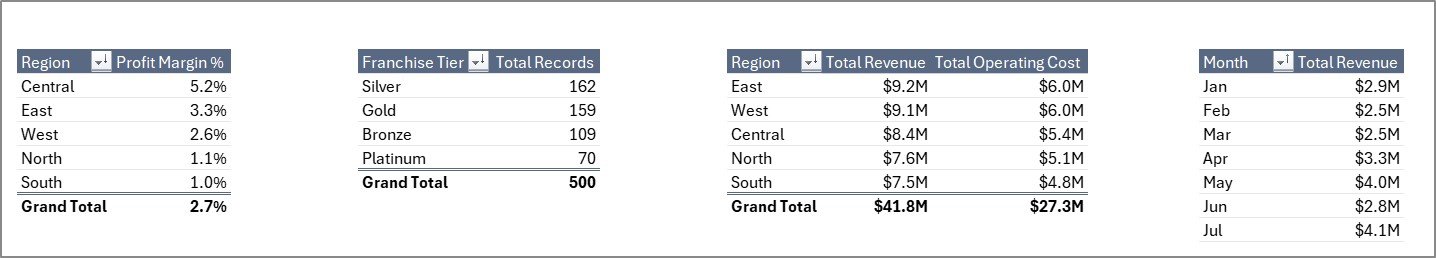
Page 1 — Overview
Five KPI cards (Total Revenue, Total Operating Cost, Total Royalty Fee, Total Records, Avg. Satisfaction) plus Profit Margin % by Region, Total Records by Franchise Tier, Total Revenue Vs Total Operating Cost by Region, and Total Revenue by Month. Slicers for Region, Franchise Tier, and Status filter all charts simultaneously.
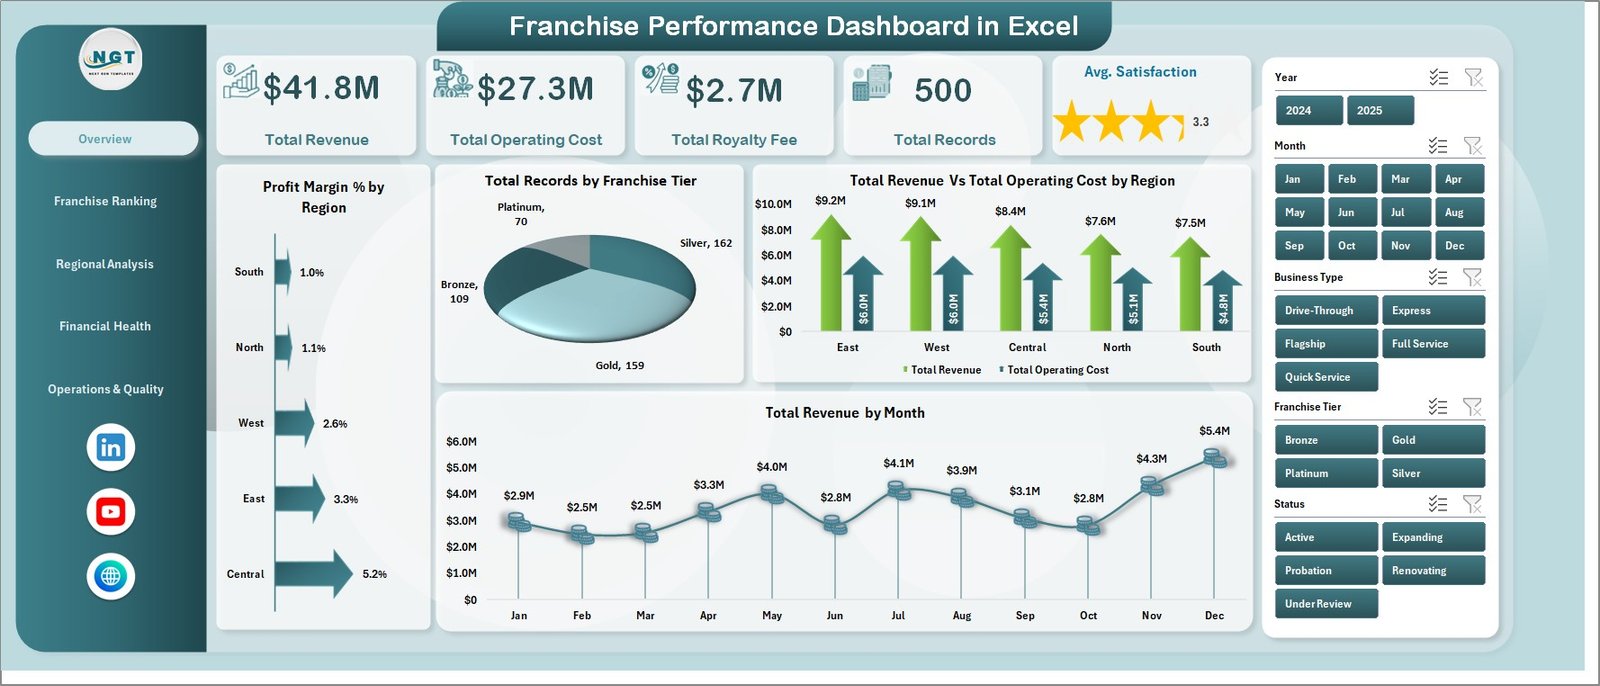
Franchise Performance Dashboard in Excel — Overview Page
Page 2 — Franchise Ranking
Ranks locations across four metrics: Total Revenue by Top Five Franchise Name, Total Footfall by Status, Avg. Compliance by Top Five Franchise Name, and Profit Margin % by Top Five Franchise Name.
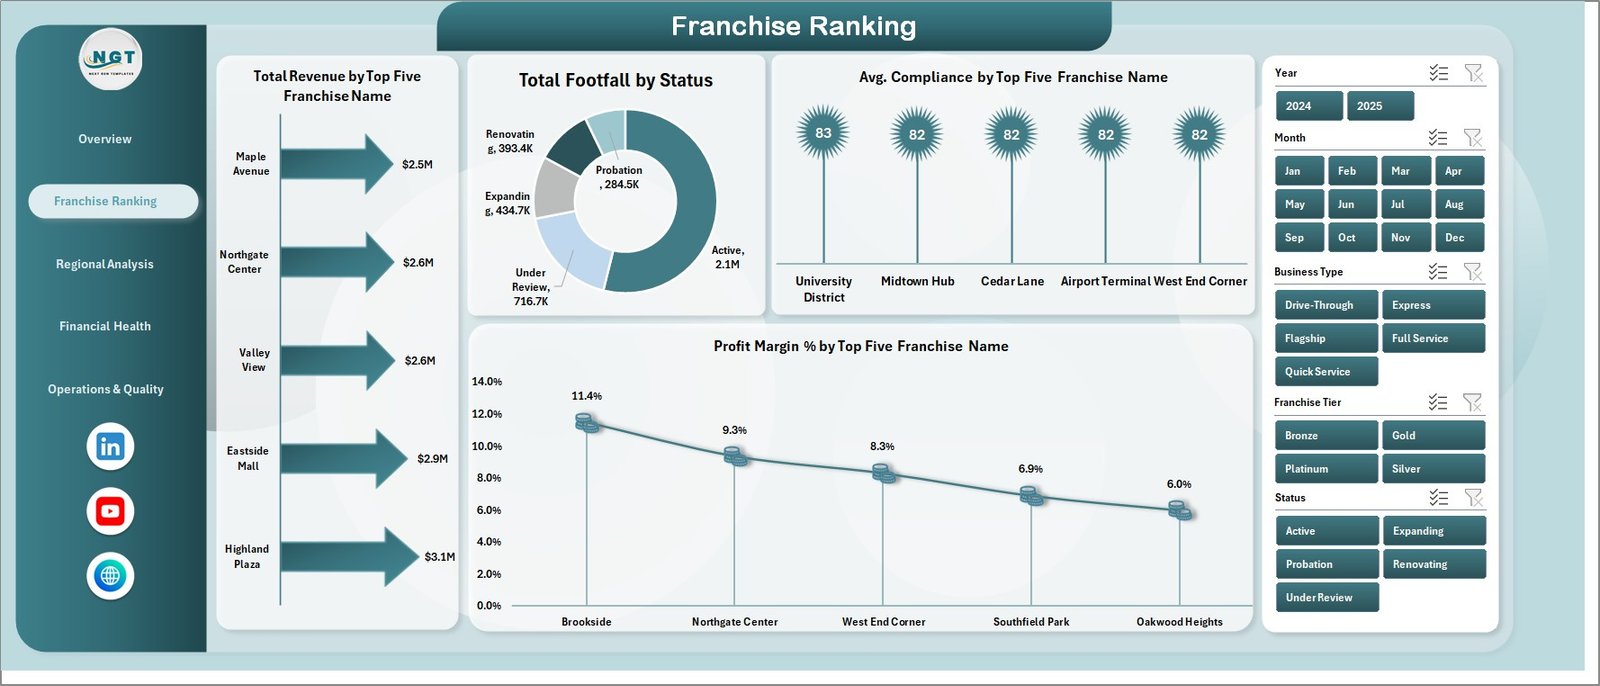
Franchise Ranking
Page 3 — Regional Analysis
Total Revenue Vs Total Marketing Spend by Region, Total Revenue by Region, Total Footfall by Region, and Total Records by Region.
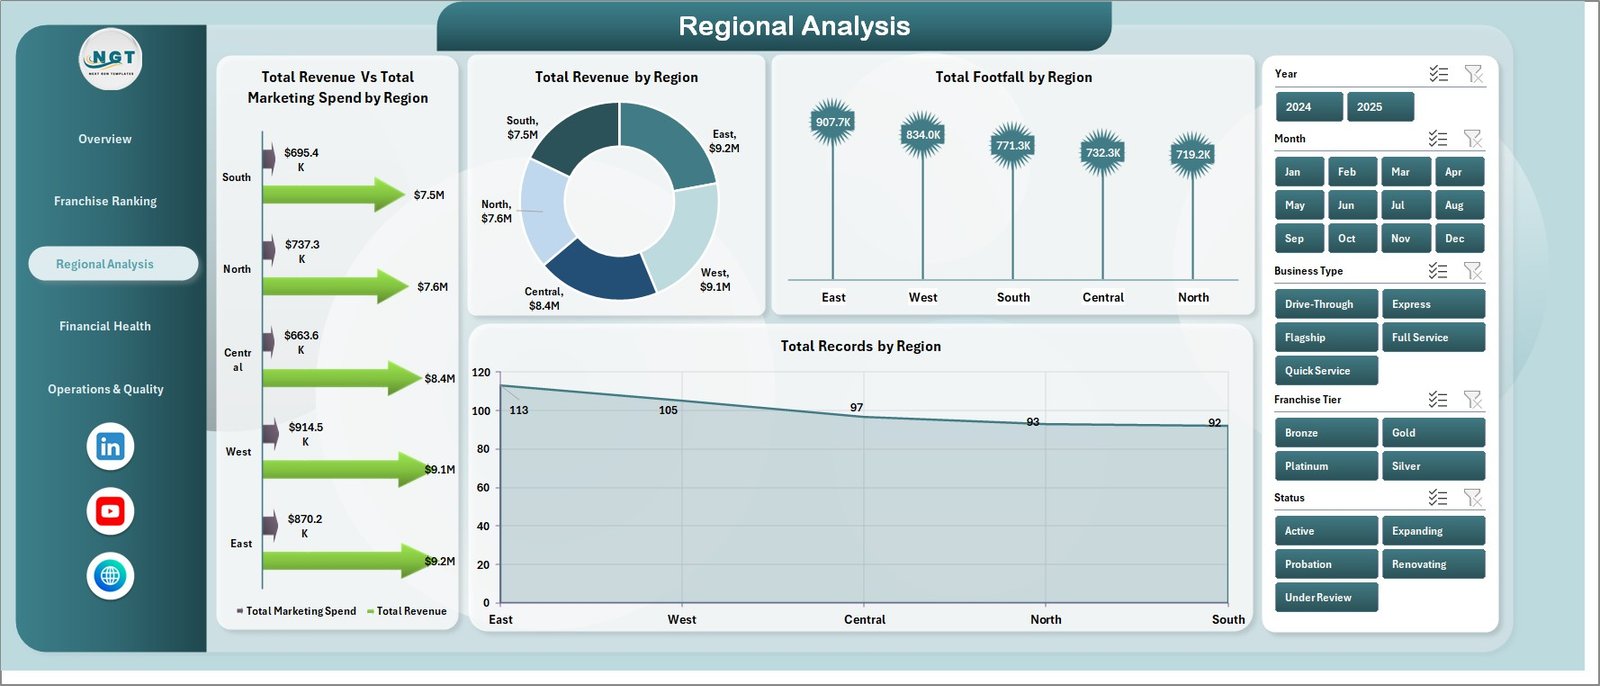
Regional Analysis
Page 4 — Financial Health
Total Revenue by Business Type, Total Revenue by Franchise Tier, Total Revenue Vs Total Operating Cost by Business Type, and Total Revenue Vs Total Operating Cost by Month.
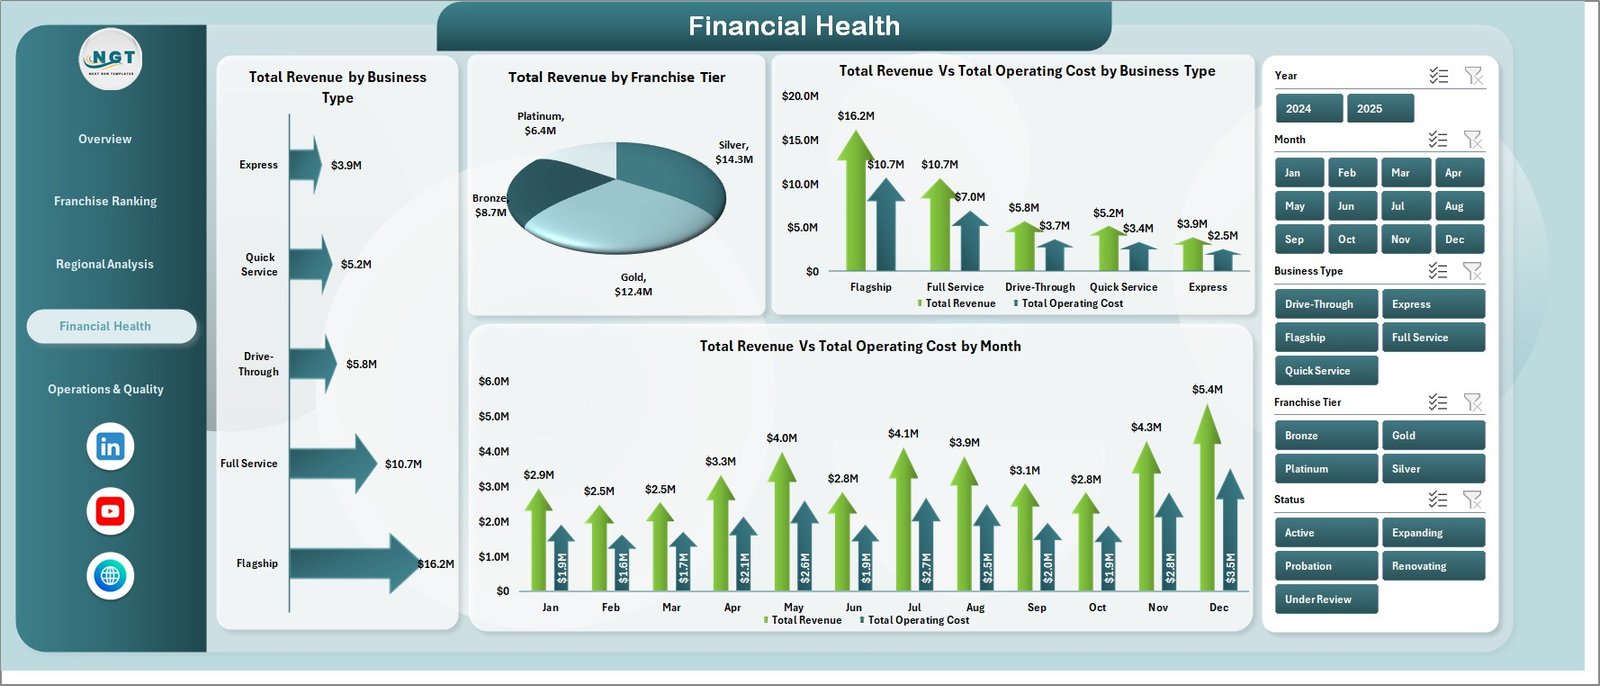
Financial Health
Page 5 — Operations & Quality
Avg. Satisfaction by Business Type, Avg. Compliance by Franchise Tier, Total Records by Status, and Avg. Revenue/Franchise by Business Type.
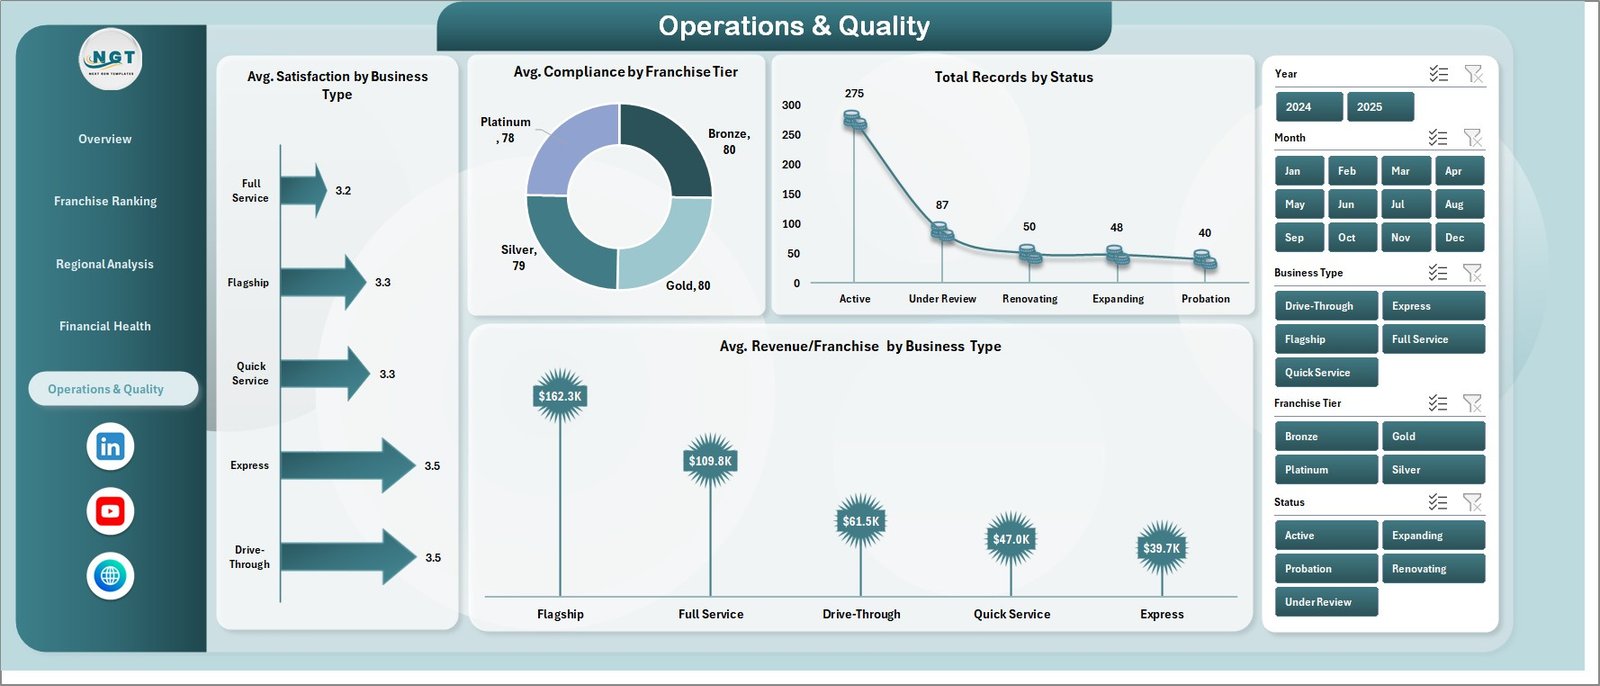
Operations & Quality
Data Sheet — Add or replace franchise records here; every connected KPI and chart updates on Refresh All.
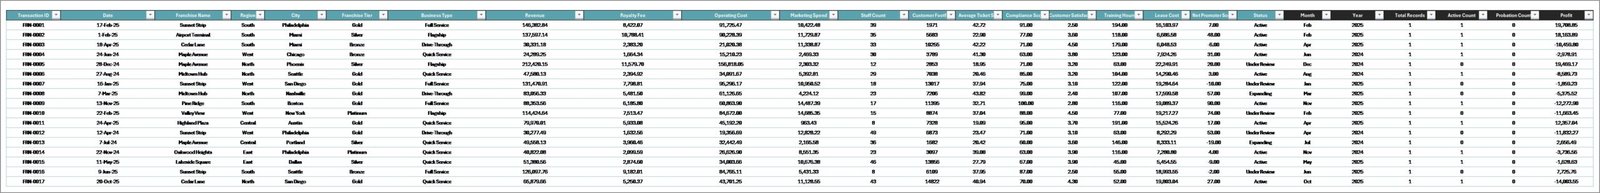
Data Sheet Tab
Support Sheet — All pivot tables that drive the dashboard. Keep hidden during presentations. Click Data → Refresh All after any data update.
Support Sheet Tab
Franchise Performance Dashboard in Excel vs. Google Sheets Version vs. Paid Franchise SaaS
| Feature | Franchise Performance Dashboard in Excel | Google Sheets Version | FranchiseConnect / Naranga |
|---|---|---|---|
| Cost | $17.99 one-time ✅ | $17.99 one-time ✅ | $200–$500 / month |
| Platform | Microsoft Excel | Google Sheets (browser) | Cloud SaaS |
| Setup time | Under 10 min ✅ | Under 10 min ✅ | 1–4 weeks |
| Works offline | ✅ Fully offline | Limited | ❌ Internet required |
| Royalty fee tracking | ✅ Built-in | ✅ Built-in | Premium tier only |
| Compliance scoring | ✅ Built-in | ✅ Built-in | Premium tier only |
| Year-1 cost (5 users) | $17.99 total ✅ | $17.99 total ✅ | $2,400–$6,000 |
For franchise operators who want revenue, royalty, and compliance analytics without a SaaS subscription, the Franchise Performance Dashboard in Excel sits in the sweet spot.
Who Should Use This Template
Perfect for:
- Franchise owners managing 2–50 locations needing a clear view of revenue and royalty flow in Excel
- Franchise network managers tracking compliance and footfall across multiple regions
- Finance teams at franchisors delivering monthly or quarterly reports to leadership
- Business consultants building franchise performance reports for Excel-using clients
Not a fit if:
- You manage 500+ locations needing real-time POS API feeds and SOC 2-compliant cloud storage
- Your team doesn’t use Microsoft Excel — see the Franchise Performance Dashboard in Google Sheets
- You need live data streaming without manual data entry
Real-World Use Cases
Marcus manages a 12-location fast food franchise. Every month he pastes updated POS export data into the Data sheet, hits Refresh All, and the Franchise Ranking page shows which locations lead on revenue, compliance, and footfall — no SaaS subscription, no per-location fees.
Priya is a franchise consultant with five clients. She keeps a copy per client and customizes Franchise Tier labels in the Data sheet. The Regional Analysis page provides a ready-made chart pack for quarterly reviews without building visuals from scratch.
David runs a regional franchise for a gym chain. He uses the Financial Health page to track revenue vs. operating cost monthly and presents findings — with charts copied directly into PowerPoint — to his franchisor brand partner each quarter.
Advantages of Franchise Performance Dashboard in Excel
The cost advantage is clear: $17.99 one-time vs. $200–$500 per month for franchise SaaS platforms. For networks with fewer than 50 locations, this template covers the same core metrics. The offline capability is a practical advantage cloud tools can’t match. Customizability is another strength — rename tiers, add business types, or extend the Data sheet without breaking anything.
Opportunities for Improvement
The dashboard requires a manual Refresh All after each data update — not suitable for real-time POS streaming. For fully automated data pulls, Power BI with a live connector is the better fit. The sample data labels (Franchise Tier, Business Type) will need updating to match your actual network structure before first use — budget about 15–20 minutes for this initial setup.
Best Practices
- Keep column headers in the Data sheet unchanged — pivot tables reference them by name
- Include a date column in your data for monthly trend visibility on the Financial Health page
- Hide the Support sheet before sharing with non-technical stakeholders
- Save a backup of the original template file before replacing the sample data
- Use OneDrive or SharePoint for collaborative team access in Excel 365
Explore Relevant Templates
🔹 Franchise Performance Dashboard in Google Sheets — same 5-page analytics for Google Workspace teams
🔹 Food Delivery Dashboard in Excel — multi-location revenue and operations analytics
🔹 Marina Dashboard in Excel — service business performance tracking
🔹 Pet Care Business Dashboard in Excel — multi-service business analytics in Excel
Browse all Excel Dashboard Templates on NextGenTemplates →
Frequently Asked Questions
What KPIs does the Franchise Performance Dashboard in Excel track?
The Franchise Performance Dashboard in Excel tracks 5 headline KPIs: Total Revenue, Total Operating Cost, Total Royalty Fee, Total Records, and Avg. Satisfaction. Deeper metrics include Profit Margin % by Region, Avg. Compliance by Franchise Tier, Total Footfall, and revenue vs. cost breakdowns by Business Type and Month.
Which Excel version is required?
Microsoft Excel 2016 or later on Windows and Mac, including Microsoft 365. Uses standard pivot tables and slicers — no VBA, no macros required.
How do I update the dashboard with new data?
Replace or append rows in the Data sheet keeping the same column structure, then click Data → Refresh All in the Excel Ribbon. All pivot tables and charts update automatically in under two minutes.
Can I customize the Franchise Tier, Region, or Business Type labels?
Yes — update values in the Data sheet and click Refresh All. All pivot tables and charts reflect your custom labels automatically without any formula editing.
How does this compare to FranchiseConnect or Naranga?
Both platforms charge $200–$500 per month. The Franchise Performance Dashboard in Excel delivers the same core analytics — revenue, royalty, compliance, footfall, satisfaction — at $17.99 one-time with no login, no per-location fees, and no internet dependency.
Is there a Google Sheets version?
Yes. The Franchise Performance Dashboard in Google Sheets covers the same 5 pages and is ideal for Google Workspace teams needing built-in sharing and browser-based access.
Is this a one-time purchase?
Yes — pay $17.99 once and own the Franchise Performance Dashboard in Excel forever. No monthly fees, no subscription, no per-user charges.
About the Author
Built by PK — Microsoft Certified Professional with 15+ years of Excel, Google Sheets, and Power BI experience. Founder of NextGenTemplates, reaching 300K+ subscribers across YouTube channels (@PK-AnExcelExpert, @NextGenTemplates). Every template is hand-built and tested before release.
Conclusion
The Franchise Performance Dashboard in Excel delivers 5 pages of franchise analytics in one offline-capable Excel file that updates with a single click. At $17.99 one-time, it replaces the core reporting functionality of franchise SaaS platforms that charge $200–$500 per month.
👉 Click here to Purchase Franchise Performance Dashboard in Excel
✅ Instant download · One-time payment · No subscription · Lifetime access
For video tutorials, visit Youtube.com/@PK-AnExcelExpert
📅 Last updated: May 2026