The Power BI Dashboard Mega Collection is the easiest way to equip your entire organization with professional analytics in a single purchase. It bundles 15 premium, ready-to-use Power BI dashboards — spanning manufacturing, construction, finance, HR, IT, healthcare, logistics, insurance, supply chain, security, education, and REITs — for just $79.99. Bought individually these dashboards cost $269.85, so the bundle saves you $189.86 (70% off). Browse the full pack on the product page or explore all our Power BI dashboards.
Why a Power BI Dashboard Bundle Makes Sense
Building a Power BI dashboard from scratch is deceptively expensive. Correct DAX measures, a clean star-schema model, slicers, and drill-throughs can take a developer 40–80 hours per report. The Power BI Dashboard Mega Collection removes that cost entirely: every file is already built, tested, and shipped with realistic sample data. You open it in Power BI Desktop, swap in your own data through Power Query, and publish to the Power BI Service the same day. Instead of paying $17.99 fifteen times, you pay once and own all 15 dashboards for life.
Key Features of the Mega Collection
Each of the 15 .pbix files in this Power BI template pack includes pre-built DAX measures for the KPIs that matter in its domain — OEE for manufacturing, attrition for HR, claims ratio for insurance, OTIF for supply chain, FFO for REITs, and revenue growth for finance. Every page has interactive slicers and drill-throughs so users can filter by date, region, department, or category in a single click. The underlying star-schema data models make it straightforward to repoint queries at SQL Server, Excel, CSV, or your ERP, and because everything is native Power BI, every visual, color, and layout is fully editable.
What’s Included in the Power BI Dashboard Mega Collection
Here is every dashboard in the bundle, with a quick note on what each one tracks.
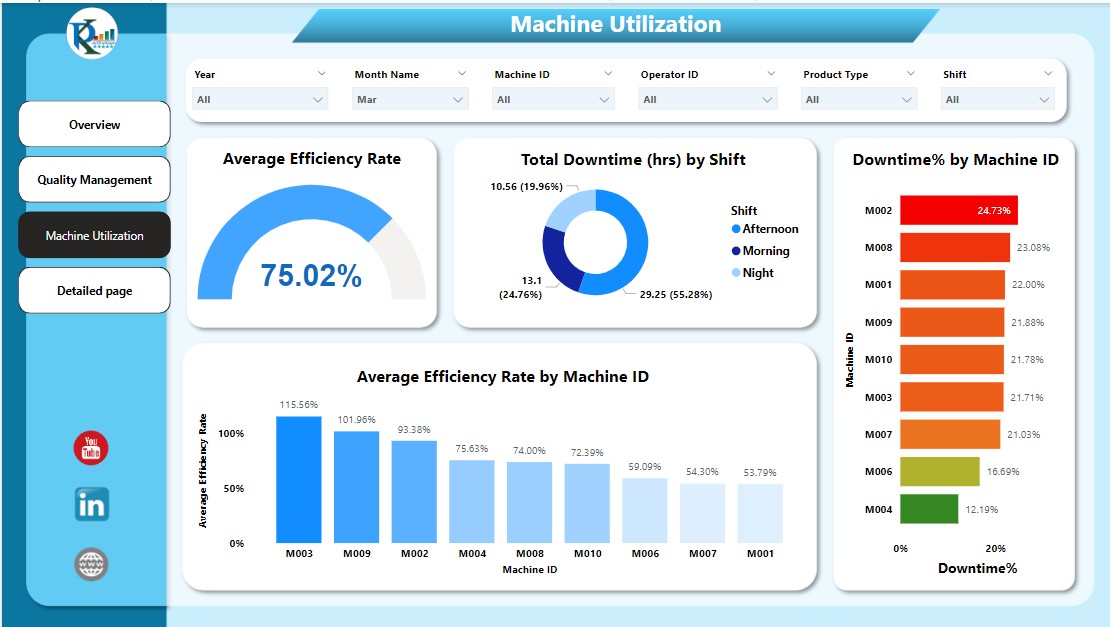
1. Manufacturing Efficiency Dashboard
Tracks OEE, machine utilization, downtime analysis, throughput, and cost-per-unit. See the Manufacturing Efficiency Dashboard in Power BI.

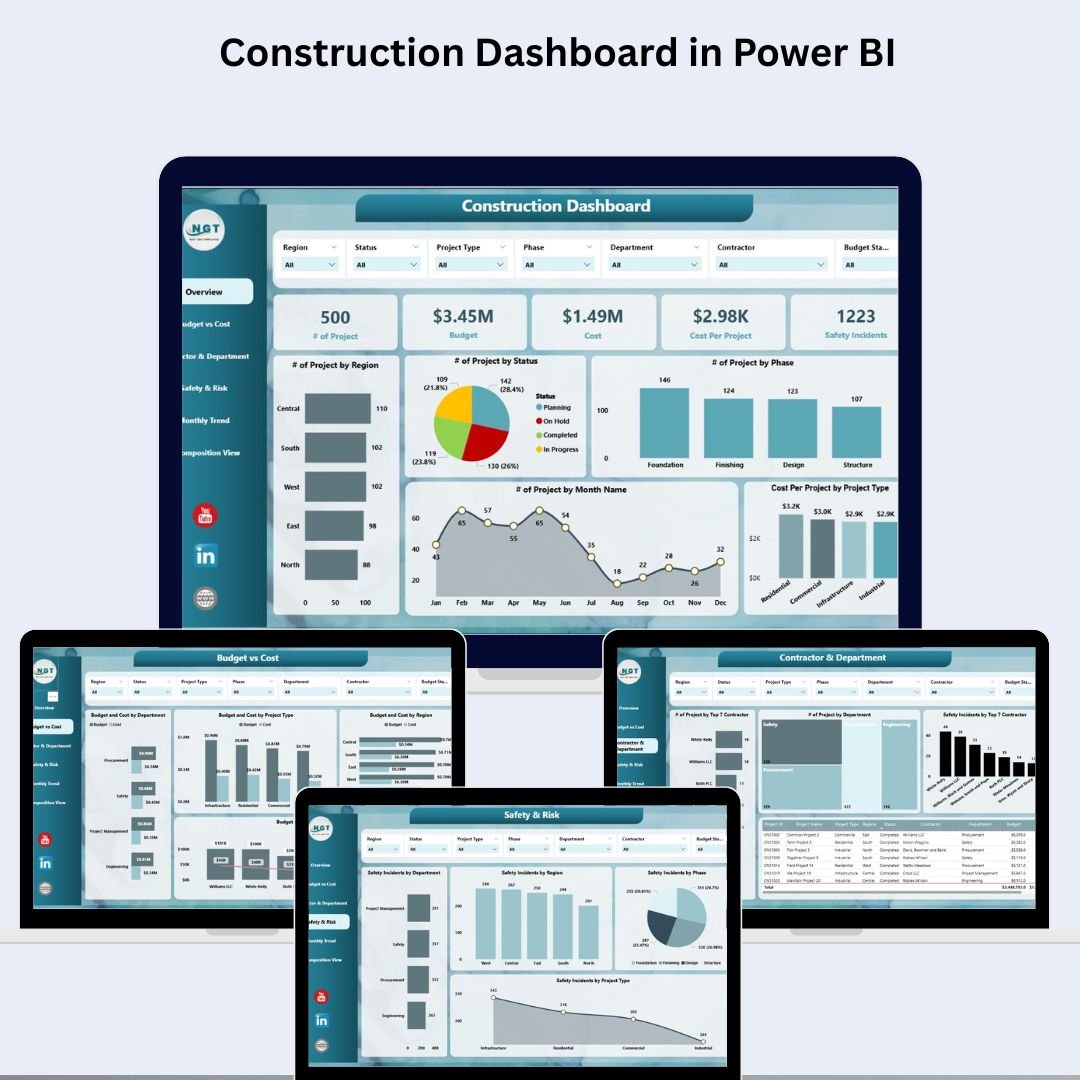
2. Construction Dashboard
Monitors project cost, schedule progress, resource allocation, and safety. See the Construction Dashboard in Power BI.
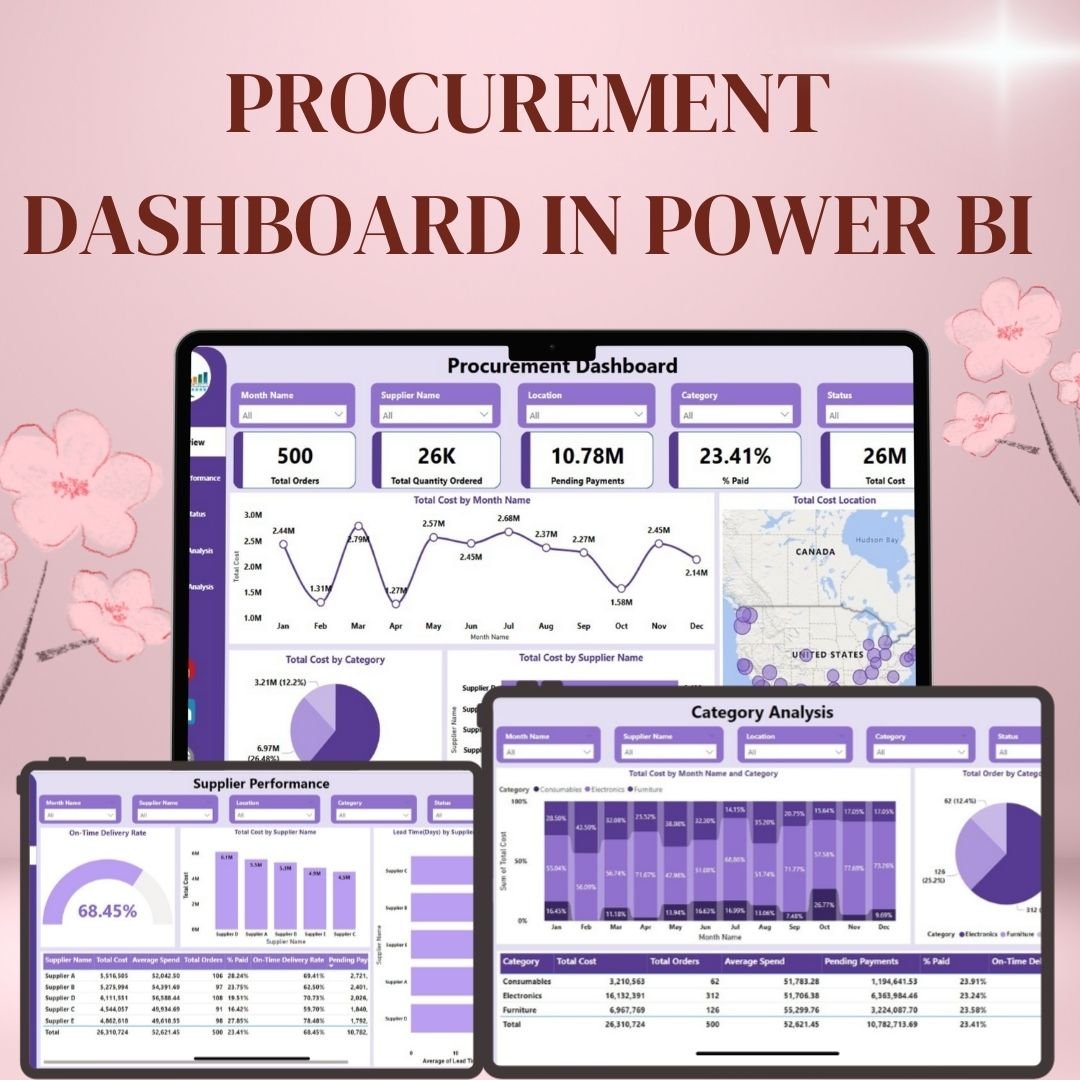
3. Procurement Dashboard
Covers spend analysis, supplier performance, PO cycle time, and savings. See the Procurement Dashboard in Power BI.
4. Expense Tracking Dashboard
Shows budget vs actual, category spend, and expense trends. See the Expense Tracking Dashboard in Power BI.
5. Employee Turnover Dashboard
Analyzes attrition rate, retention, exit reasons, and headcount movement. See the Employee Turnover Dashboard in Power BI.

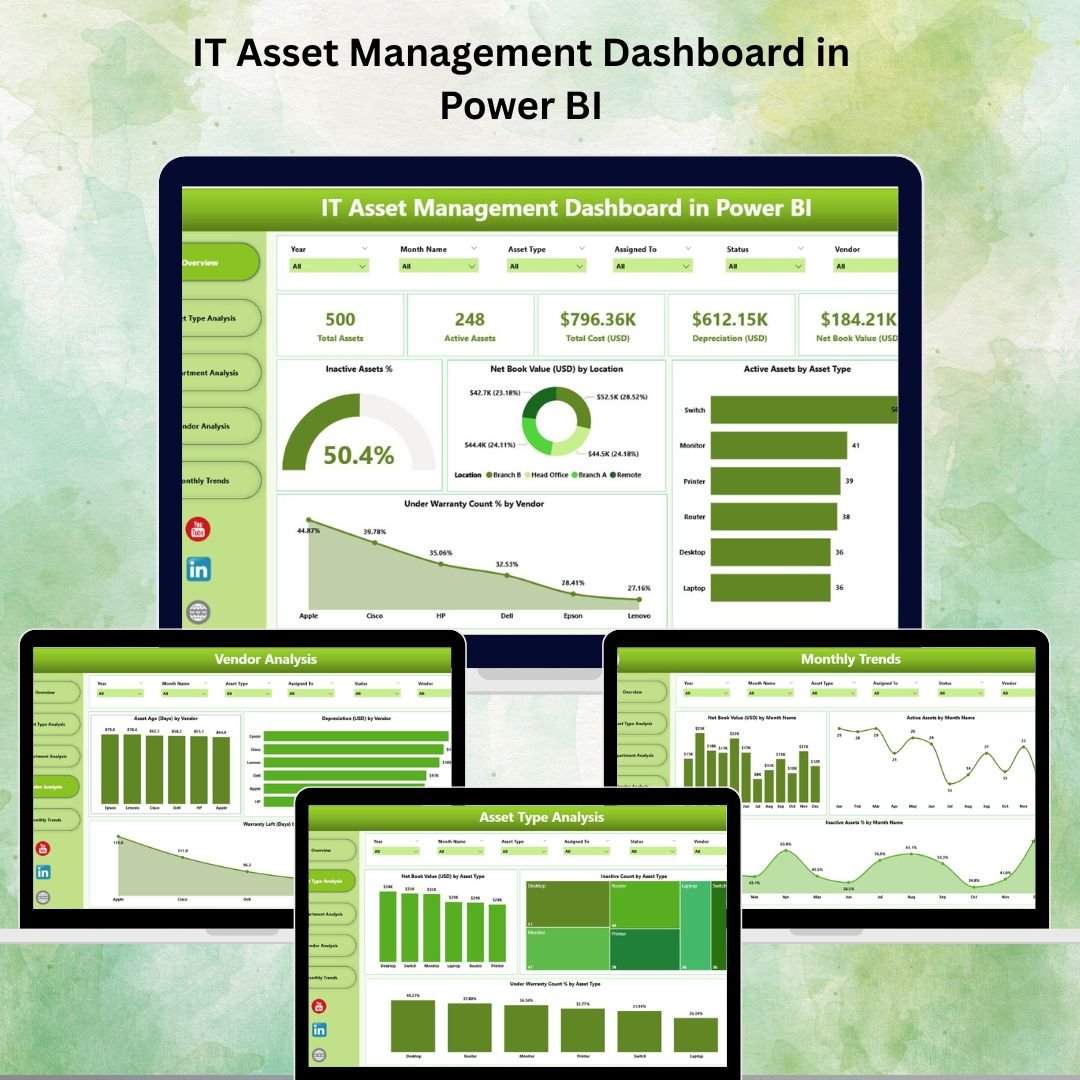
6. IT Asset Management Dashboard
Tracks asset lifecycle, license usage, depreciation, and support tickets. See the IT Asset Management Dashboard in Power BI.
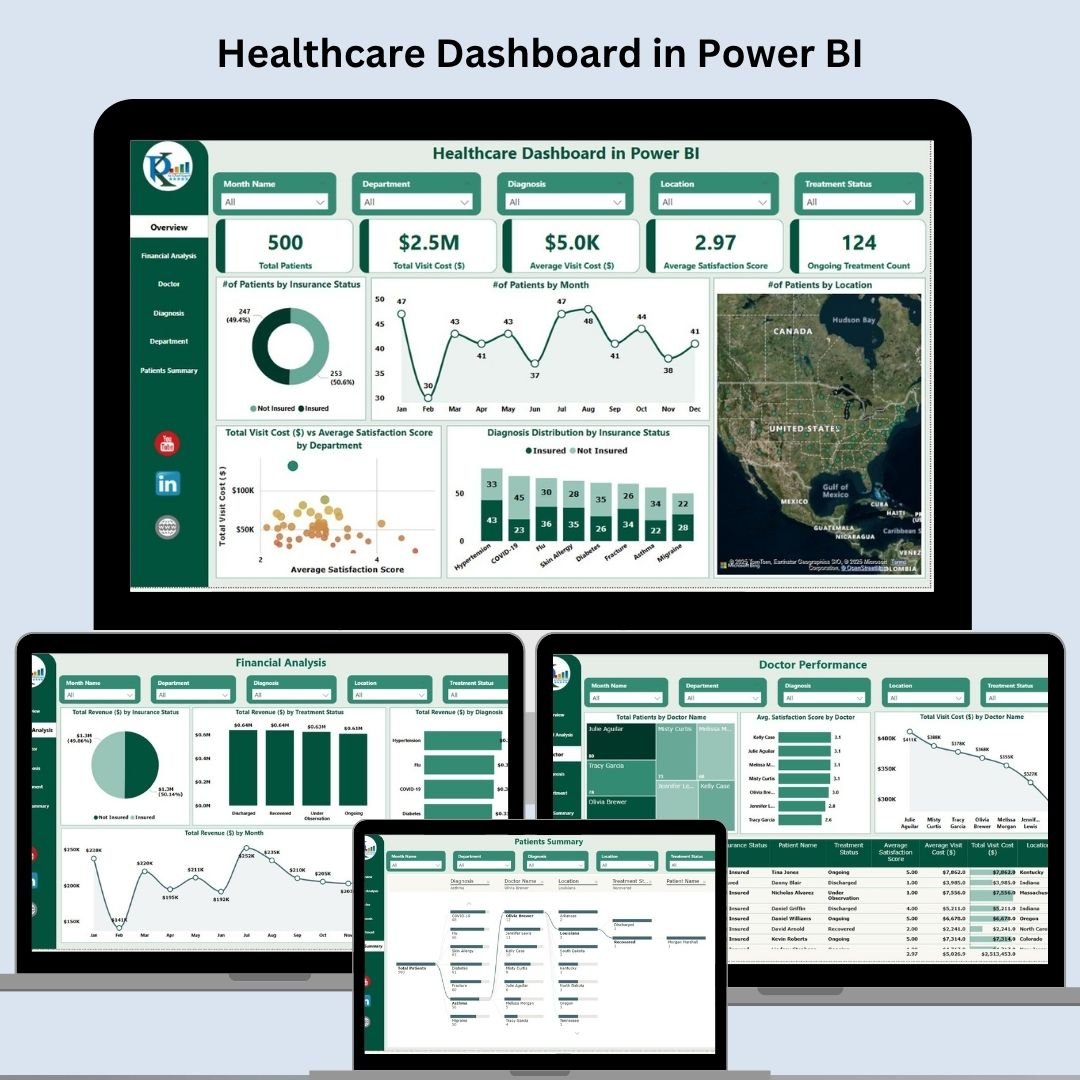
7. Healthcare Dashboard
Covers patient flow, bed occupancy, revenue, and clinical KPIs. See the Healthcare Dashboard in Power BI.
8. Transportation & Logistics Dashboard
Monitors fleet utilization, on-time delivery, freight cost, and routes. See the Transportation & Logistics Dashboard in Power BI.

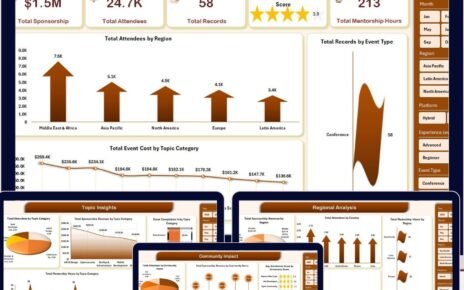
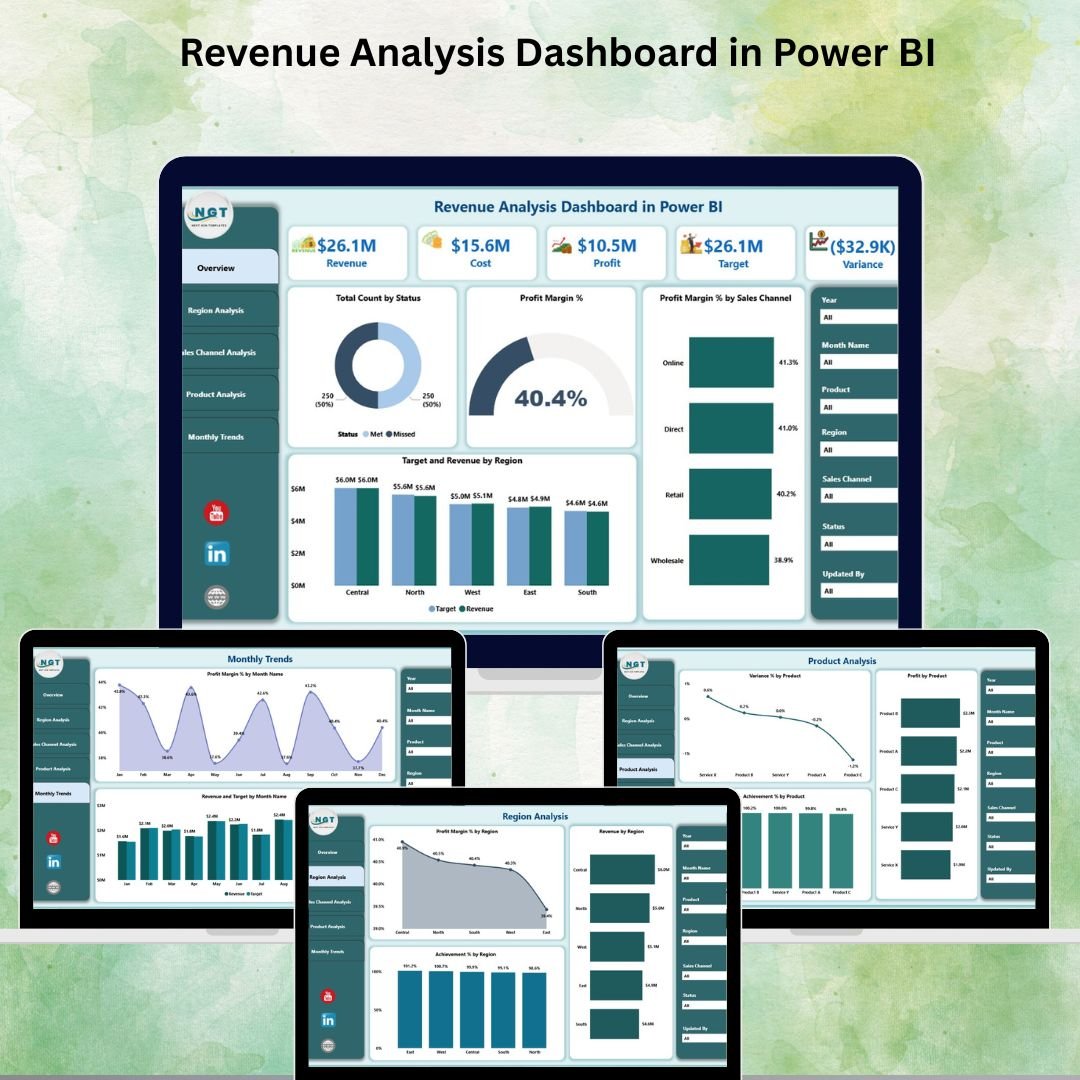
9. Revenue Analysis Dashboard
Visualizes revenue trends, product and region mix, and growth. See the Revenue Analysis Dashboard in Power BI.
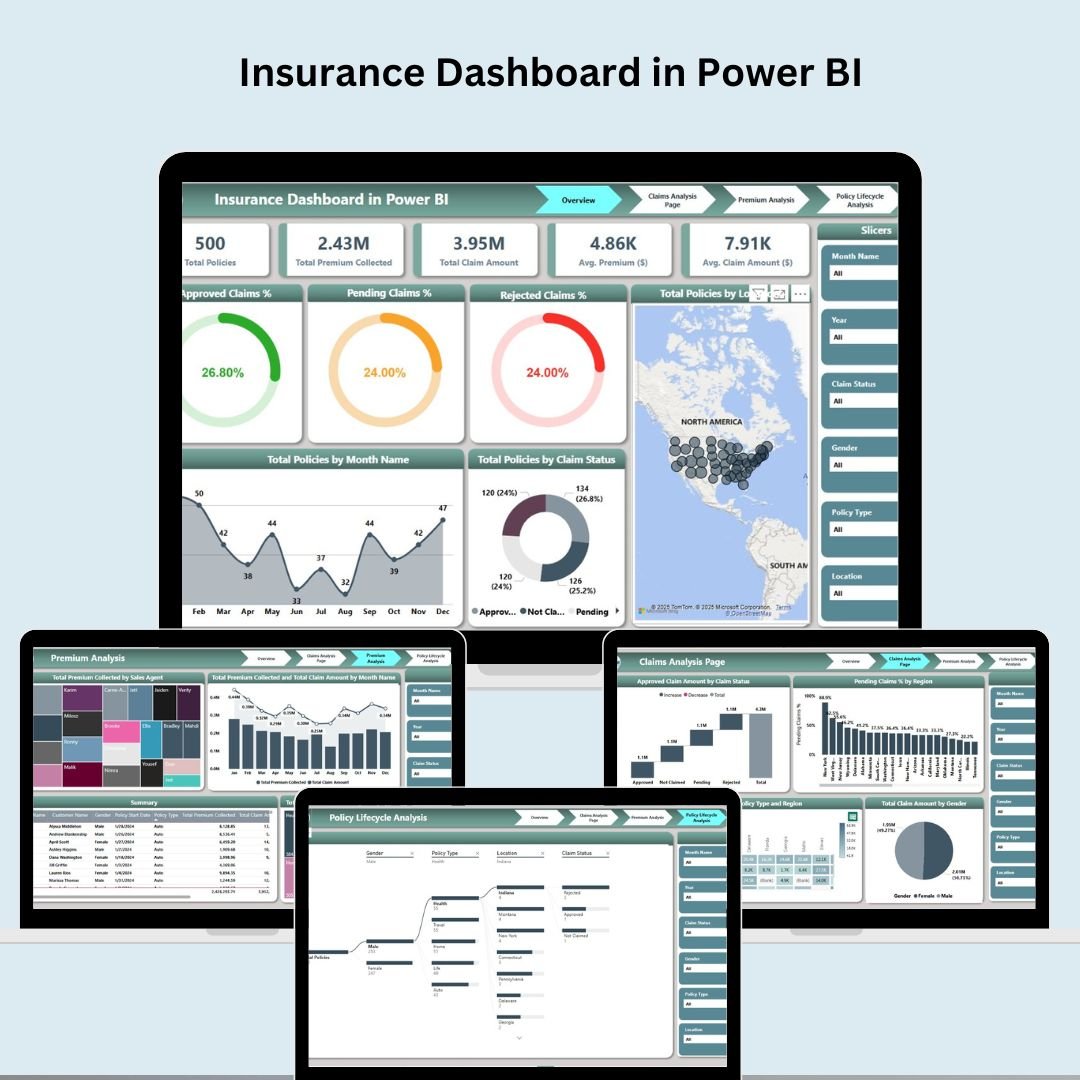
10. Insurance Dashboard
Tracks policies, claims ratio, premium income, and renewals. See the Insurance Dashboard in Power BI.
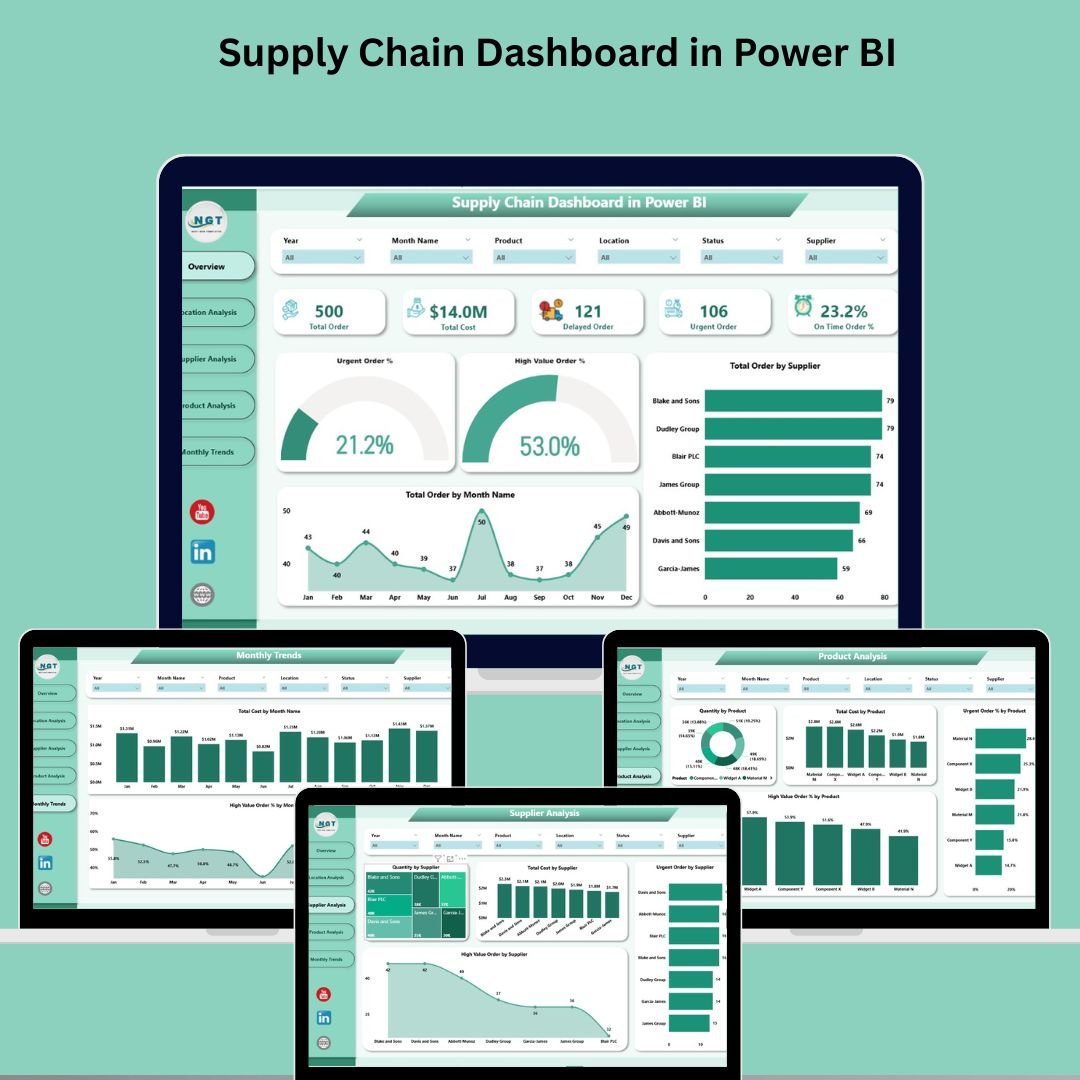
11. Supply Chain Dashboard
Covers inventory levels, OTIF, lead time, and supplier risk. See the Supply Chain Dashboard in Power BI.
12. Training and Development Dashboard
Measures course completion, skills coverage, and training ROI. See the Training and Development Dashboard in Power BI.

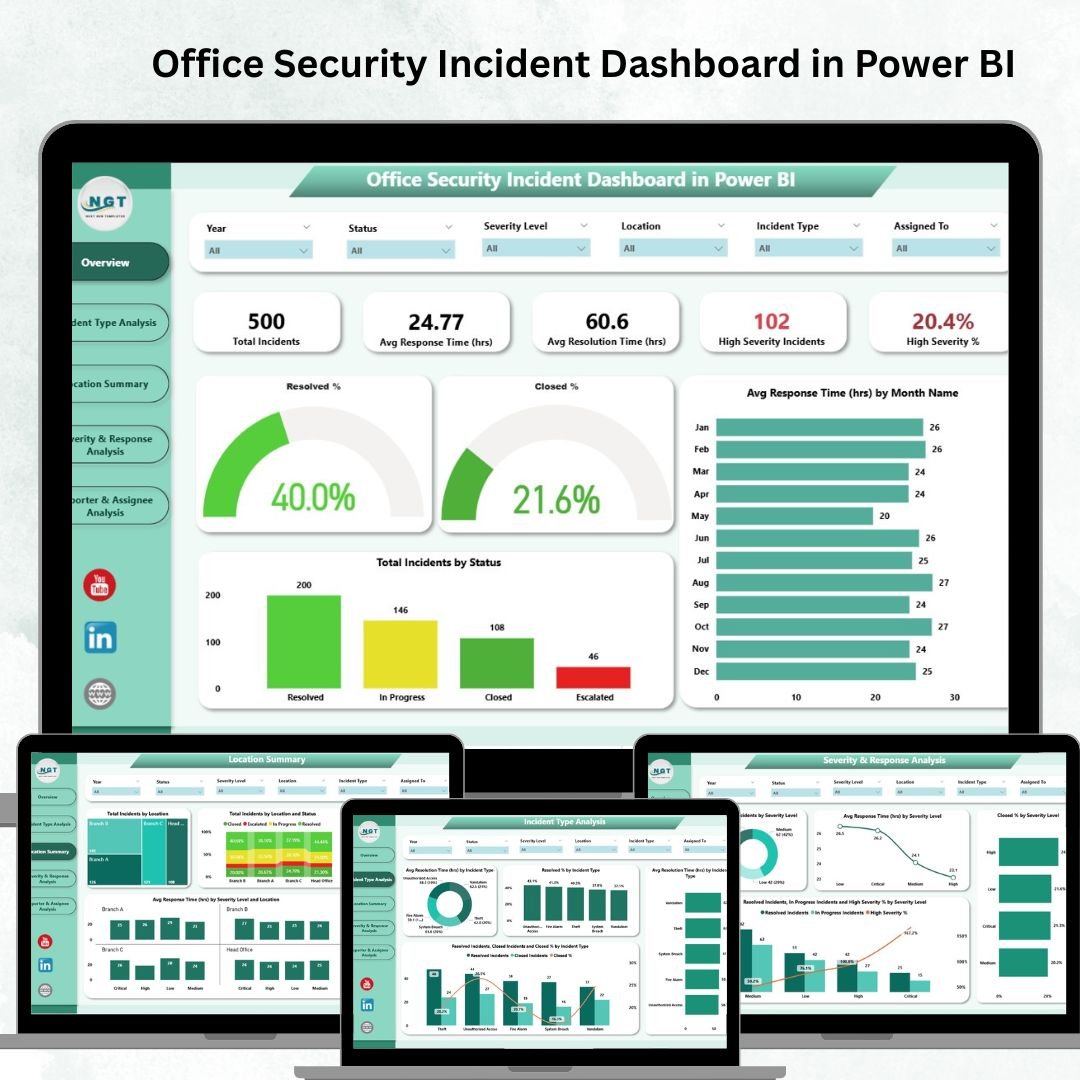
13. Office Security Incident Dashboard
Logs incidents, severity, response time, and trends. See the Office Security Incident Dashboard in Power BI.
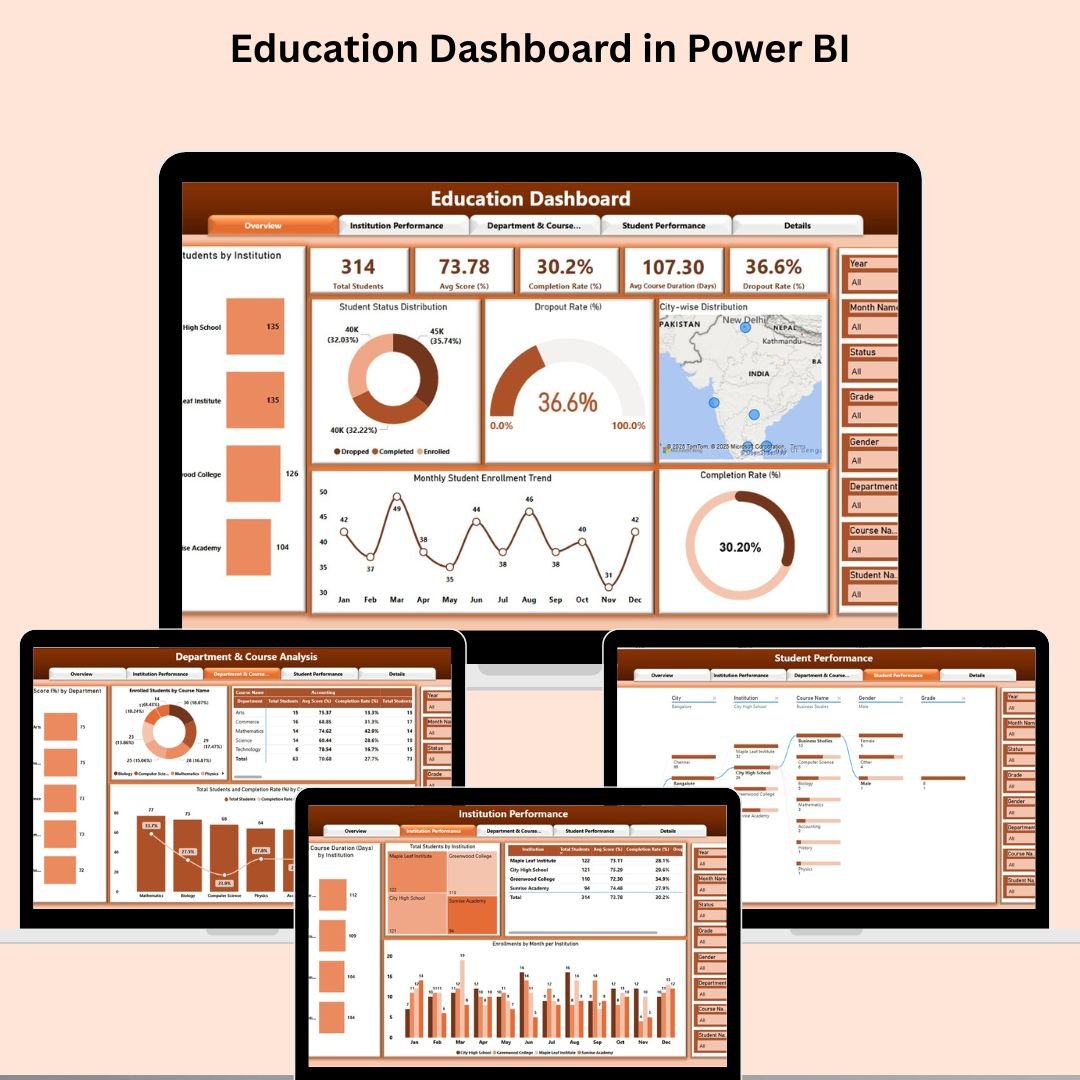
14. Education Dashboard
Tracks enrollment, attendance, student performance, and finance. See the Education Dashboard in Power BI.
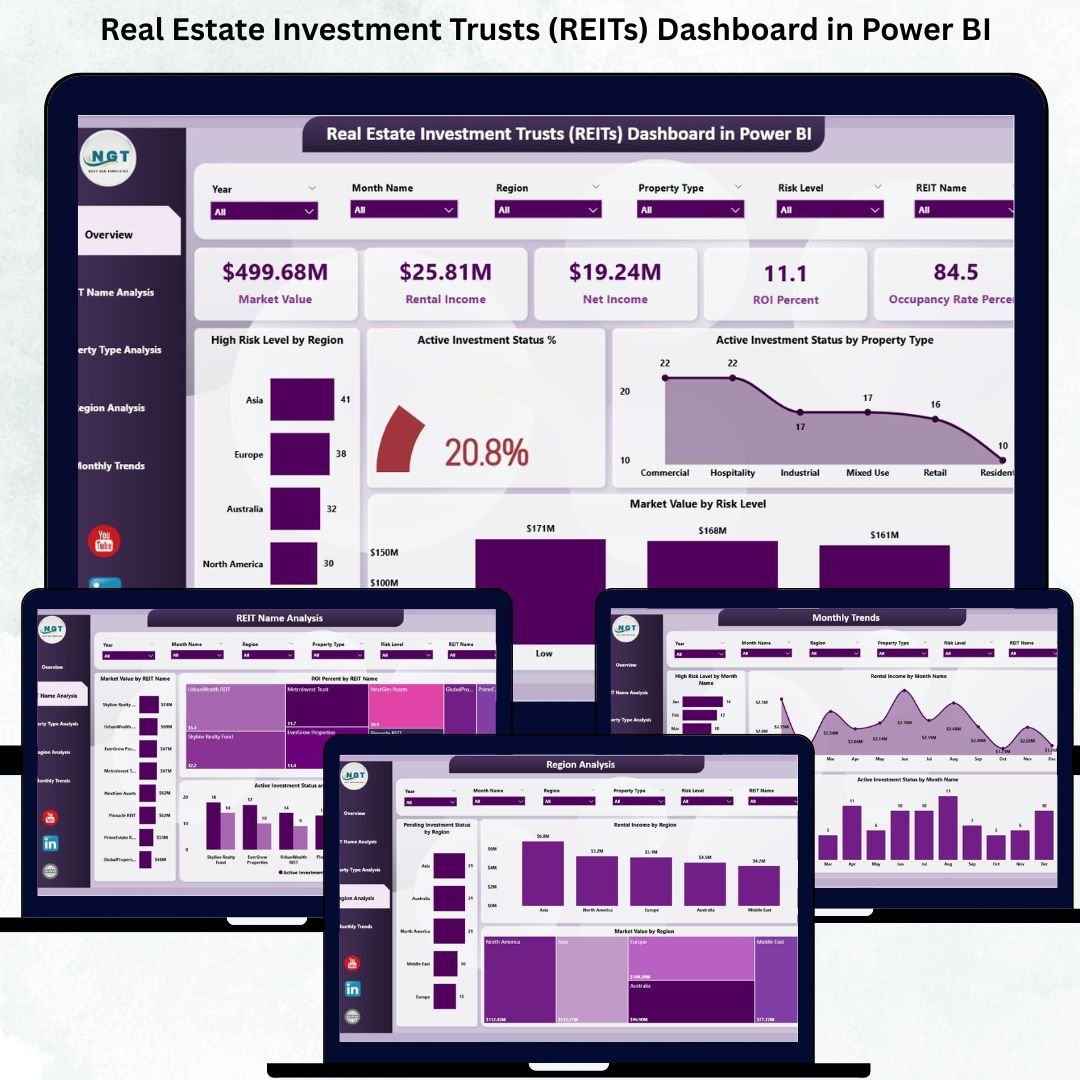
15. Real Estate Investment Trusts (REITs) Dashboard
Covers NAV, FFO, occupancy, dividend yield, and portfolio performance. See the REITs Dashboard in Power BI.
Smart Comparison — Individual vs Bundle
| Option | What You Pay | What You Get |
|---|---|---|
| Buying individually | $269.85 | 15 separate purchases at $17.99 each |
| Mega Collection Bundle | $79.99 | All 15 dashboards, one download, save $189.86 (70%) |
Advantages of Buying the Bundle
Beyond the obvious price saving, the bundle gives you a consistent analytics foundation across departments. Every dashboard follows the same design language and modeling conventions, so a report that an analyst learns in one domain transfers directly to another. For consultants and agencies, the pack doubles as a branded template library you can customize per client. And because it is a one-time purchase with lifetime use, there is no recurring per-seat cost to NextGenTemplates — you own the files outright.
Best Practices for Deploying the Dashboards
Start by deploying two or three dashboards that map to your most pressing reporting needs rather than all 15 at once. Publish them to a dedicated Power BI workspace, set scheduled refresh, and apply row-level security so each team sees only its own data. Standardize your reason-code and category lists before importing historical data so trend analysis stays clean, and review each dashboard on a regular cadence — an unviewed dashboard quickly becomes an unmaintained one.
Explore More Templates
Discover more in our Power BI Dashboards collection, browse all Excel & Power BI Dashboards, or see other Template Bundles.
Frequently Asked Questions
What’s included in the Power BI Dashboard Mega Collection?
Fifteen complete .pbix Power BI dashboards covering manufacturing efficiency, construction, procurement, expense tracking, employee turnover, IT asset management, healthcare, transportation & logistics, revenue analysis, insurance, supply chain, training & development, office security incidents, education, and REITs.
How much do I save compared to buying separately?
Each dashboard is $17.99, so 15 of them cost $269.85 individually. The bundle is $79.99 — a saving of $189.86, or about 70%.
Do I need a Power BI license?
You can open and edit every file in Power BI Desktop, which is free. To publish and share with your team you’ll need Power BI Pro (about $14/user/month) or Microsoft 365 E5, which includes Pro.
Can I use my own data?
Yes. Each dashboard ships with sample data in a star-schema model. You replace it with your own data in Power Query, or repoint the queries at SQL Server, Excel, CSV, or your ERP.
Is this a one-time purchase?
Yes — it’s a one-time purchase with lifetime use of the files. There’s no recurring subscription to NextGenTemplates.
Can consultants resell or rebrand these dashboards?
You can customize and brand them for use in client engagements. They make an excellent baseline template library for delivery work.
Conclusion
If your organization runs on Power BI — or wants to — the Power BI Dashboard Mega Collection is the fastest, most cost-effective way to roll out professional analytics across every department. Fifteen dashboards, pre-built DAX, and a 70% saving in one download.
Get All 15 Power BI Dashboards — $79.99
Save $189.86 (70% off the $269.85 individual price)
For weekly Power BI and Excel dashboard tutorials, subscribe to YouTube.com/@PKAnExcelExpert.