Environmental Law Firms Dashboard in Power BI is built for environmental law firms, compliance attorneys, legal operations teams, and practice managers that need a clear way to analyze matters, matter value, legal fees, closed matters, risk score, penalty avoided, compliance cost, client type, region, priority, status, practice area, firm, and regulator exposure. Environmental legal work often combines regulatory, financial, and risk data, so a flat spreadsheet or case export can become difficult to review quickly. This Power BI dashboard turns structured matter data into KPI cards, slicers, and focused report pages for faster decision-making.
The template is especially useful when your firm already exports matter records from another system and wants a ready Power BI reporting layer. You can open the PBIX file in Power BI Desktop, replace the sample source with your own data, refresh the model, and review the analysis pages. Microsoft provides official guidance for getting started with Power BI Desktop in its Power BI Desktop documentation.
Click to Purchase Environmental Law Firms Dashboard in Power BI
Key Features of Environmental Law Firms Dashboard in Power BI
- 5 Power BI report pages covering Overview, Case Trends, Client Analysis, Practice Mix, and Risk Review.
- Executive KPI cards for Total Matters, Total Matter Value, Total Legal Fees, Closed Matters, and Average Risk Score.
- Interactive slicers that let users filter the dashboard quickly without rebuilding visuals.
- Legal matter analysis by year, month, status, case stage, client type, priority, region, industry, firm, practice area, and regulator.
- Risk and compliance views for penalty avoided, compliance cost, risk score, and matter value by status.
- Editable PBIX file for users who want to adjust report pages, visuals, relationships, Power Query steps, or DAX measures.
- One-time download with no recurring template subscription fee.
Dashboard Pages Explanation
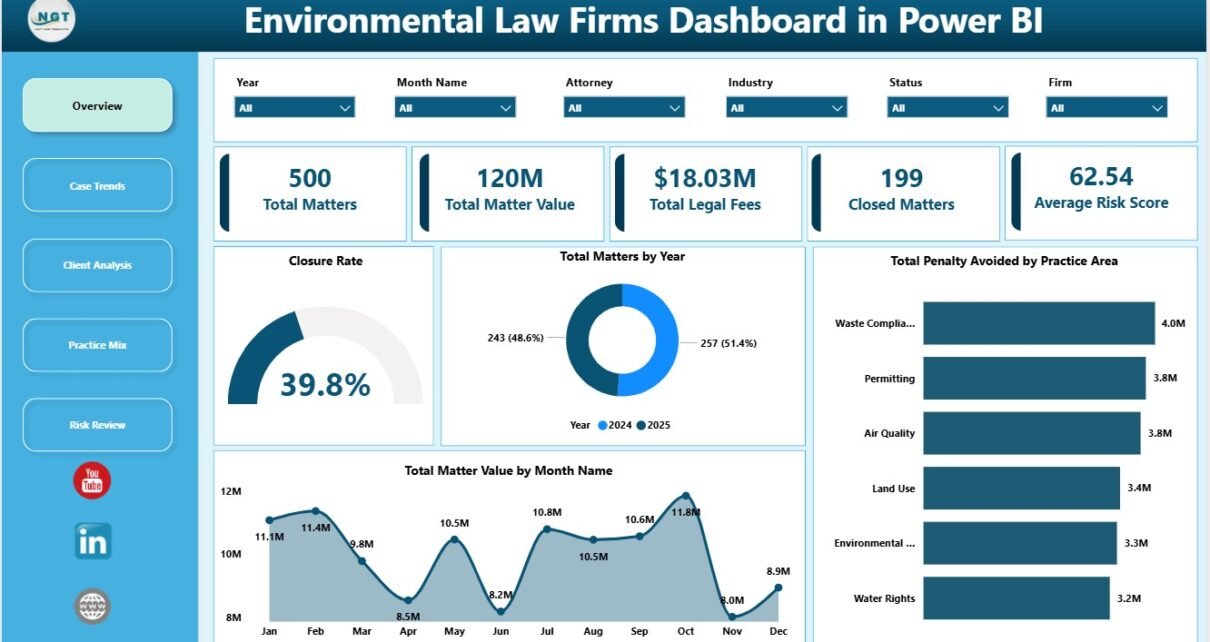
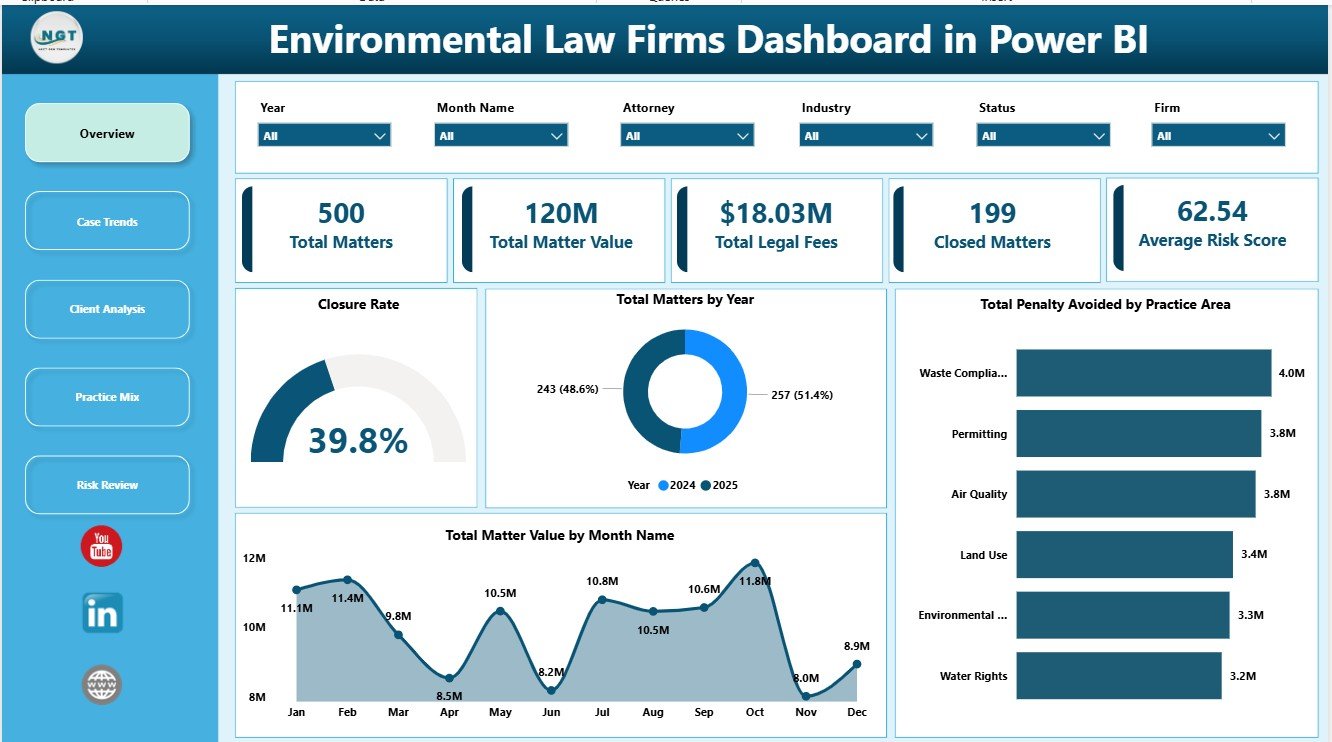
1. Overview Page
The Overview Page provides a top-level view of environmental legal matter performance. The KPI cards summarize Total Matters, Total Matter Value, Total Legal Fees, Closed Matters, and Average Risk Score, making it easier to review workload, commercial value, billing impact, closure progress, and risk level in one place.
Closure Rate by Status: This chart compares closure performance across matter status groups. It helps partners and managers identify whether matters are moving forward or staying unresolved in specific status buckets.
Total Matters by Year: This visual shows annual matter volume. It is useful for long-term practice review, staffing discussions, and year-over-year workload planning.
Total Penalty Avoided by Practice Area: This chart shows which environmental law practice areas produce the highest avoided penalty value. It helps communicate client impact in a measurable way.
Total Matter Value by Month Name: This chart tracks matter value by month. It helps identify high-value periods, seasonal movement, and months that may need closer operational review.
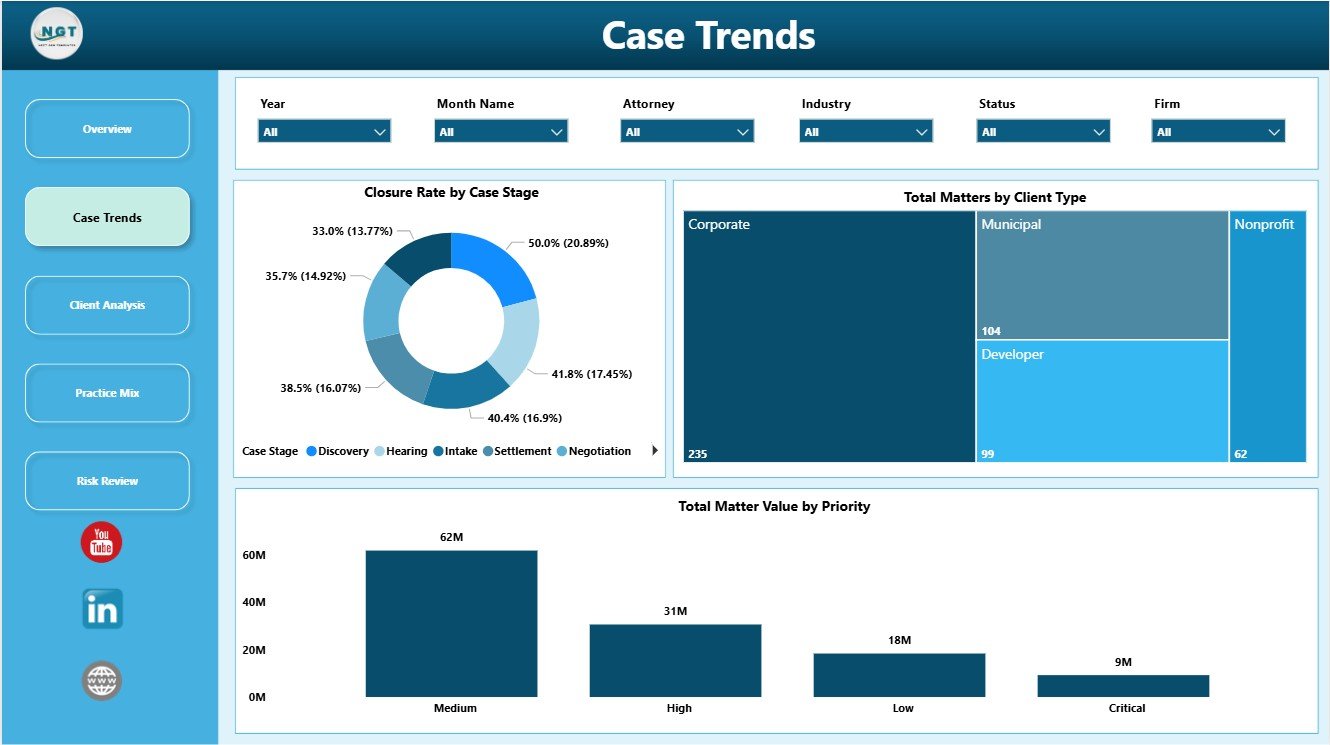
2. Case Trends
The Case Trends page focuses on matter movement by case stage, client type, and priority. This page helps legal teams understand where matter volume is concentrated and whether high-priority work is aligned with matter value.
Closure Rate by Case Stage: This chart shows how closure performance differs by stage. It helps reveal bottlenecks where matters may need follow-up, staffing, or workflow changes.
Total Matters by Client Type: This chart compares matter volume by client category. It helps firms see whether corporate, municipal, nonprofit, individual, or other client segments are creating the most environmental law work.
Total Matter Value by Priority: This visual connects value with priority. It helps partners confirm whether urgent matters also represent meaningful financial or operational exposure.
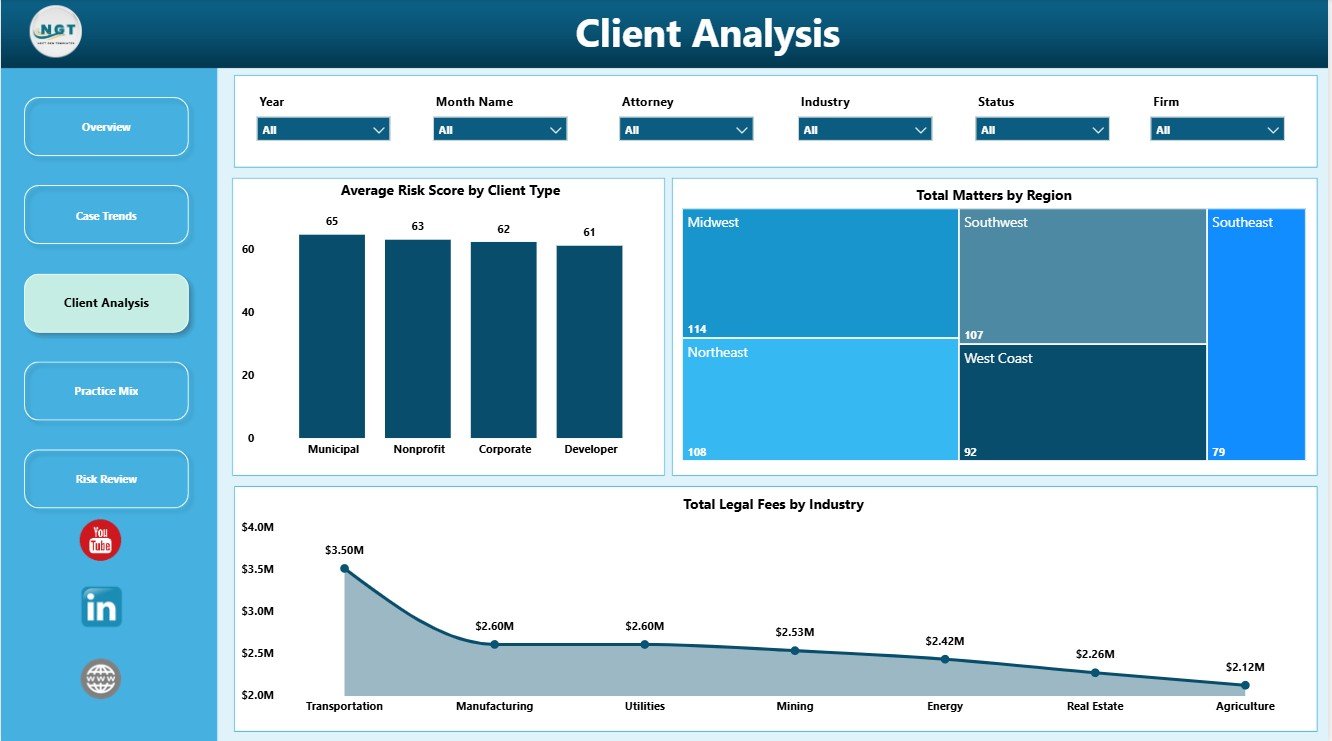
3. Client Analysis
The Client Analysis page reviews the client side of the practice. It is useful for understanding client risk, regional matter distribution, and the industries that create the largest legal fee contribution.
Average Risk Score by Client Type: This chart compares risk levels across client groups. It helps firms identify client categories that may require stronger compliance review or more frequent advisory support.
Total Matters by Region: This visual shows where environmental law matters are concentrated geographically. It supports regional planning, jurisdiction review, and client coverage decisions.
Total Legal Fees by Industry: This chart identifies the industries generating the highest legal fees. It helps leadership understand the revenue mix and focus business development on the right sectors.
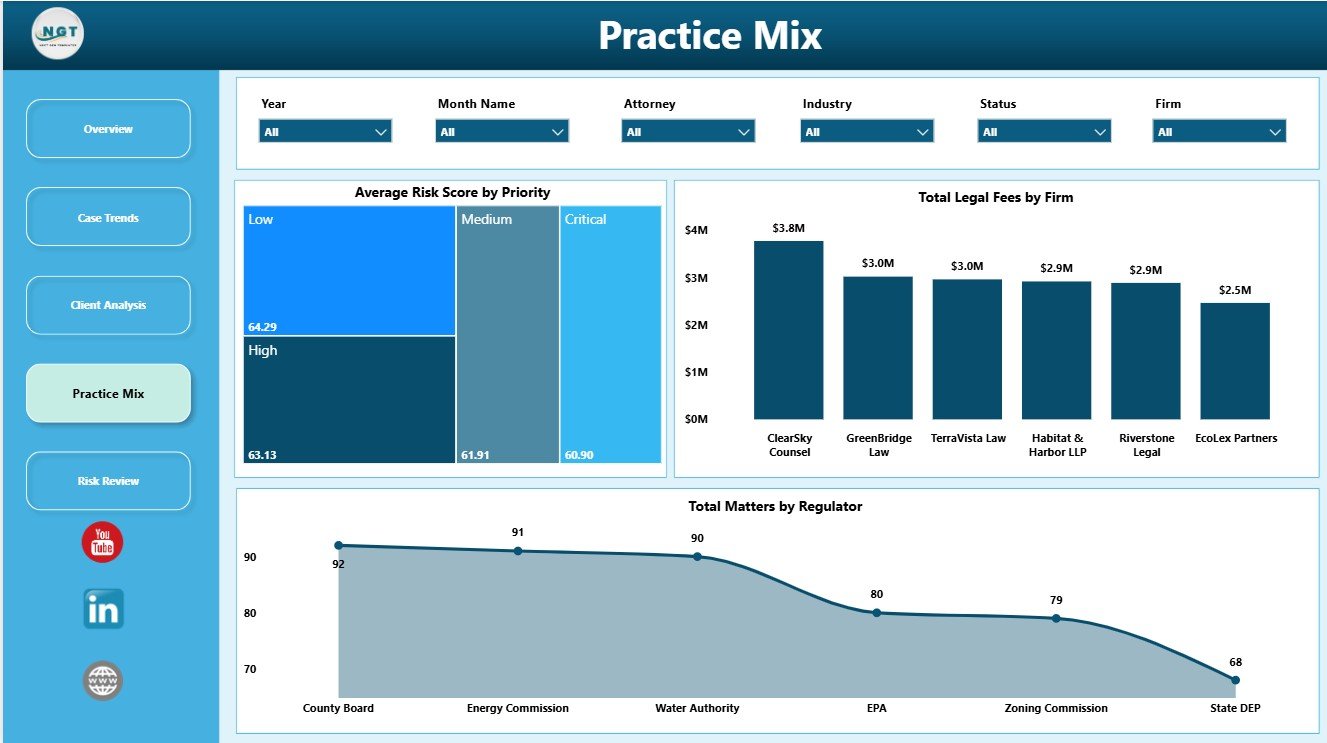
4. Practice Mix
The Practice Mix page helps leadership review risk, firm-level fees, and regulator exposure. It is useful for understanding the structure of the environmental law practice and the agencies that appear most often in the data.
Average Risk Score by Priority: This chart compares risk scores across priority groups. It helps confirm whether high-priority matters are also carrying higher risk exposure.
Total Legal Fees by Firm: This visual compares fee contribution by firm, office, or practice group. It helps partners understand where fee value is being generated.
Total Matters by Regulator: This chart shows matter volume by regulator. It helps attorneys prepare for agency-specific reviews and identify repeated regulatory exposure.
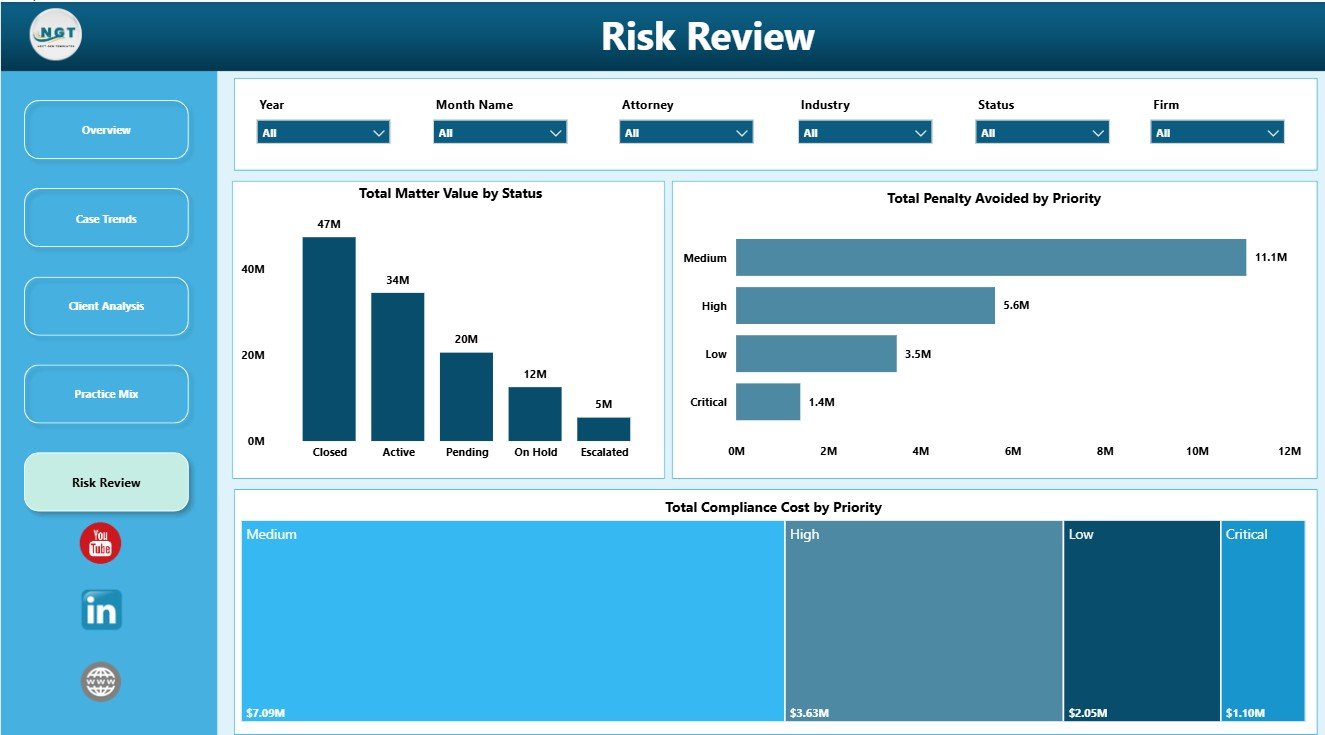
5. Risk Review
The Risk Review page is designed for financial exposure, avoided penalties, and compliance cost analysis. It helps connect matter status and priority with the financial and risk impact of environmental legal work.
Total Matter Value by Status: This chart shows how matter value is distributed across status groups. It helps leaders see how much value is open, closed, pending, or delayed.
Total Penalty Avoided by Priority: This visual compares avoided penalties by priority level. It helps show whether high-priority matters are delivering strong compliance benefit.
Total Compliance Cost by Priority: This chart compares compliance cost by priority. It helps teams understand whether urgent matters consume more resources and where cost control may be needed.
Environmental Law Firms Dashboard in Power BI vs. Tableau vs. Paid Legal CRM/SaaS – Feature Comparison
| Feature | This Power BI Template | Tableau Alternative | Paid Legal CRM/SaaS |
|---|---|---|---|
| Cost | $17.99 one-time | License or custom build cost | Monthly or annual subscription |
| Platform | Power BI Desktop / Power BI Service | Tableau Desktop / Tableau Cloud | Vendor cloud platform |
| Setup time | Open PBIX, map data, refresh | Build model and visuals manually | Onboarding and configuration required |
| Real-time team collaboration | Available through Power BI Service depending on licensing | Available through Tableau Cloud | Depends on vendor plan |
| Mobile access | Available through Power BI mobile options if published | Available through Tableau mobile options | Depends on vendor plan |
| Customizable fields | Editable report pages, visuals, model, and measures | Editable with Tableau skills | Limited by vendor settings |
| Environmental law analytics | Matters, value, fees, risk, penalties, compliance cost, clients, regions, regulators | Requires custom design | May require reporting add-ons |
| Year-1 cost at 5 users | $17.99 plus Microsoft licensing if needed | Usually much higher | Often hundreds or thousands |
Who Should Use This Template
This dashboard is best for environmental law firms, compliance attorneys, environmental legal consultants, corporate legal departments, practice administrators, and legal operations managers that already collect structured matter data. It is also useful for boutique practices that want Power BI reporting without building a model and visuals from scratch.
It is not meant to replace a secure case management system, billing system, document repository, e-discovery tool, court filing tool, or client portal. Use it as a reporting and analytics layer for structured data.
Real-World Use Cases
Environmental law partner: Reviews Total Matter Value, Total Legal Fees, Closed Matters, and Penalty Avoided before monthly practice meetings.
Legal operations manager: Uses status, stage, region, priority, and regulator views to find bottlenecks and rebalance workload.
Compliance counsel: Reviews risk score, penalty avoided, compliance cost, and priority analysis before preparing client updates.
Advantages of Environmental Law Firms Dashboard in Power BI
- It gives legal teams a clear view of matter value, fees, risk, and regulatory exposure in one PBIX file.
- It uses Power BI visuals and slicers for fast filtering and presentation-ready reporting.
- It supports practice planning by comparing status, year, month, region, industry, firm, priority, and regulator data.
- It can be customized in Power BI Desktop for teams that want to adapt pages, fields, and measures.
- It is a one-time download, so teams avoid a recurring template subscription.
Opportunities for Improvement
Teams can extend this dashboard by connecting it to a live matter database, adding user-level security in Power BI Service, creating drill-through pages for attorney-level review, or adding more detailed DAX measures for realization rate, margin, or open matter aging. Larger firms may also want to connect the dashboard to billing, timekeeping, or document management systems.
Best Practices
- Keep matter IDs unique so visuals do not double-count records.
- Standardize status, priority, client type, region, industry, practice area, and regulator names before refreshing the model.
- Refresh the dashboard on a fixed weekly or monthly schedule.
- Review risk score definitions with attorneys so everyone interprets the metric consistently.
- Use Power BI Service permissions carefully if the report contains sensitive legal or client data.
Explore Relevant Templates
- Environmental Law Firms Dashboard in Power BI
- Environmental Law Firms Dashboard in Excel
- Employment Law Services Dashboard in Power BI
- Cyber Law Advisory Dashboard in Power BI
Frequently Asked Questions
What does the Environmental Law Firms Dashboard in Power BI track?
It tracks total matters, matter value, legal fees, closed matters, average risk score, closure rate, penalty avoided, compliance cost, client type, region, priority, status, industry, firm, practice area, and regulator analysis.
Can I replace the sample data?
Yes. You can replace the sample source or connect the PBIX file to your own structured environmental law matter data, then refresh the report.
Do I need advanced Power BI skills?
Basic Power BI Desktop knowledge is helpful for replacing data and refreshing the report. Advanced skills are only needed if you want to change the model, measures, or report design.
Does this replace legal practice management software?
No. It is a Power BI dashboard template for reporting, not a legal CRM, billing system, document repository, client portal, or court filing workflow.
Can I customize the report pages?
Yes. Because it is an editable PBIX file, you can adjust visuals, fields, relationships, Power Query steps, and DAX measures in Power BI Desktop.
Is this a subscription?
No. This is a one-time downloadable Power BI template purchase.
About the Author
Built by PK – Microsoft Certified Professional with 15+ years of Excel, Google Sheets, and Power BI experience. Founder of NextGenTemplates, reaching 300K+ subscribers across YouTube channels. Every template is hand-built and tested before release.
Conclusion
The Environmental Law Firms Dashboard in Power BI gives legal teams a practical way to turn environmental matter records into clear reporting. With 5 report pages, KPI cards, slicers, and visuals for matter value, legal fees, risk, penalties avoided, compliance cost, client type, region, priority, status, and regulators, it helps firms review performance without starting from a blank Power BI file.
Visit our YouTube channel to learn step-by-step Excel, Power BI, and dashboard tutorials.