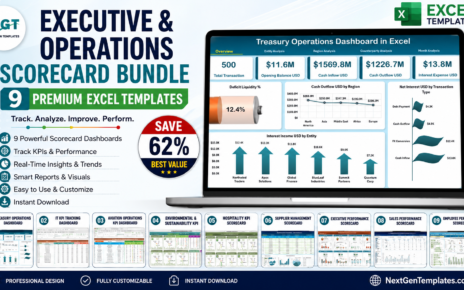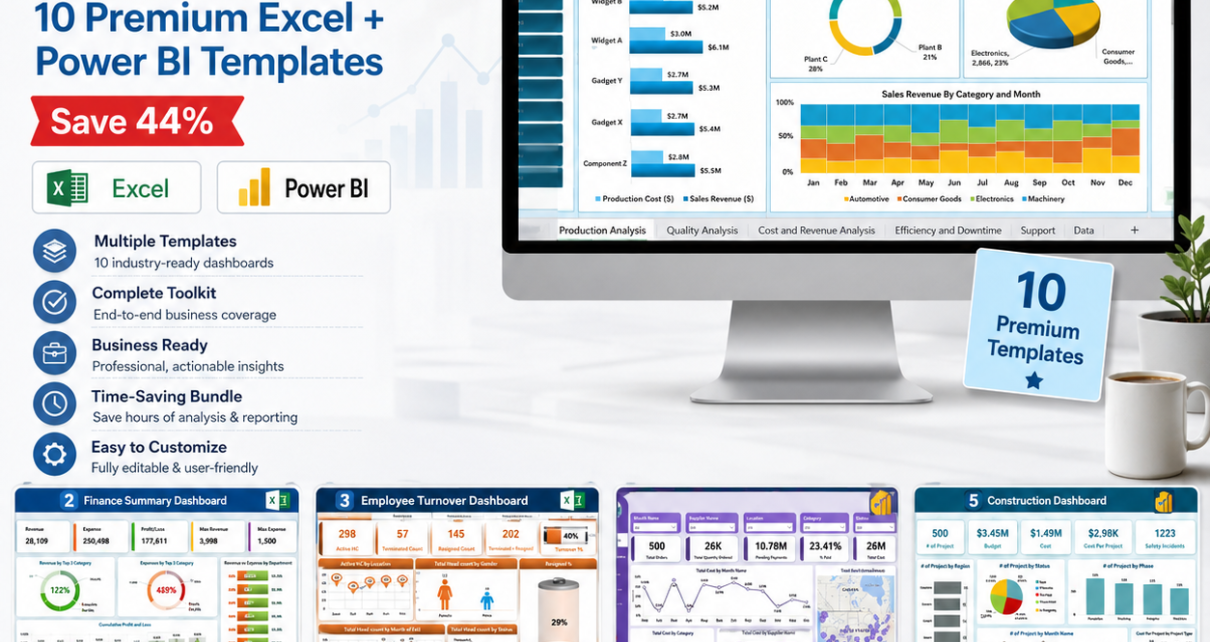
If you’re a management consultant, business analyst, or operations leader who regularly presents data across multiple industries and departments, building dashboards from scratch for every client engagement is one of the most time-consuming parts of the job. The Consultant’s Toolkit solves this permanently. It bundles 10 of our best-selling, production-ready Excel and Power BI dashboard templates into a single download — covering the ten domains most commonly requested in consulting projects. Instead of spending $179.90 buying each template separately, get everything for just $99.99 (saving $79.91 — 44% off).
🎯 Get the Consultant’s Toolkit Now
10 Premium Templates | Excel + Power BI | Save $79.91 (44% Off)
$179.90 → $99.99
Purchase the Consultant’s Toolkit →
🔑 Key Features of the Consultant’s Toolkit
Each of the 10 templates in this bundle has been purpose-built for its domain and tested with real-world datasets. Together they give you a complete multi-industry reporting system:
- ✅ 10 Production-Ready Dashboards – all individually crafted, battle-tested, and consultant-grade
- ✅ Excel + Power BI – 8 Excel files and 2 Power BI .pbix files with matching Excel data models
- ✅ 40+ Dashboard Pages – KPI cards, trend charts, slicers, drill-downs, and summary views
- ✅ Plug-and-Play Setup – replace sample data and every chart, KPI, and analysis updates automatically
- ✅ Works Offline – no cloud dependency, no subscriptions, no add-ins required
- ✅ Fully Editable – customize labels, targets, colour schemes, and layouts to match any client brand
📦 What’s Inside the Consultant’s Toolkit
1. Manufacturing Dashboard in Excel
Seven analysis pages covering OEE, throughput, First Pass Yield, downtime (planned vs. unplanned), MTBF, MTTR, scrap rate, and inventory. For plant managers, operations directors, and manufacturing consultants who need factory analytics without a BI licence. View product

Manufacturing Dashboard in Excel
2. Finance Summary Dashboard in Excel
Track income, expenses, profit margins, cash flow, and financial forecasting in one interactive Excel file. Pre-built charts and slicers make it ready for finance manager reviews, investor presentations, and client quarterly briefings. View product
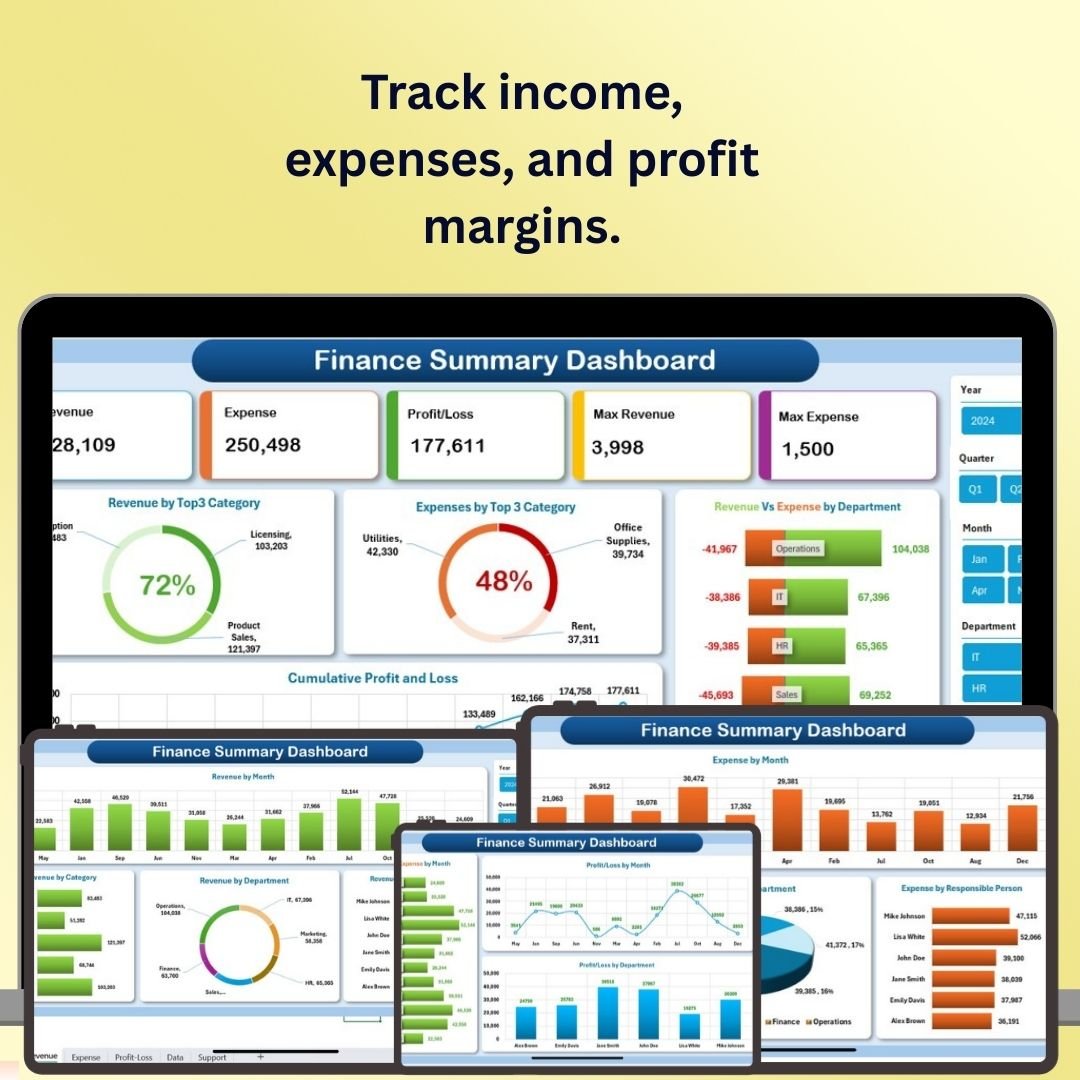
Finance Summary Dashboard in Excel
3. Employee Turnover Dashboard in Excel
Five analysis tabs covering overview KPIs, exit insights, departmental turnover, gender-based trends, and joining vs. exit patterns. Auto-calculated turnover %, resignation %, and headcount metrics from a single data entry sheet. View product
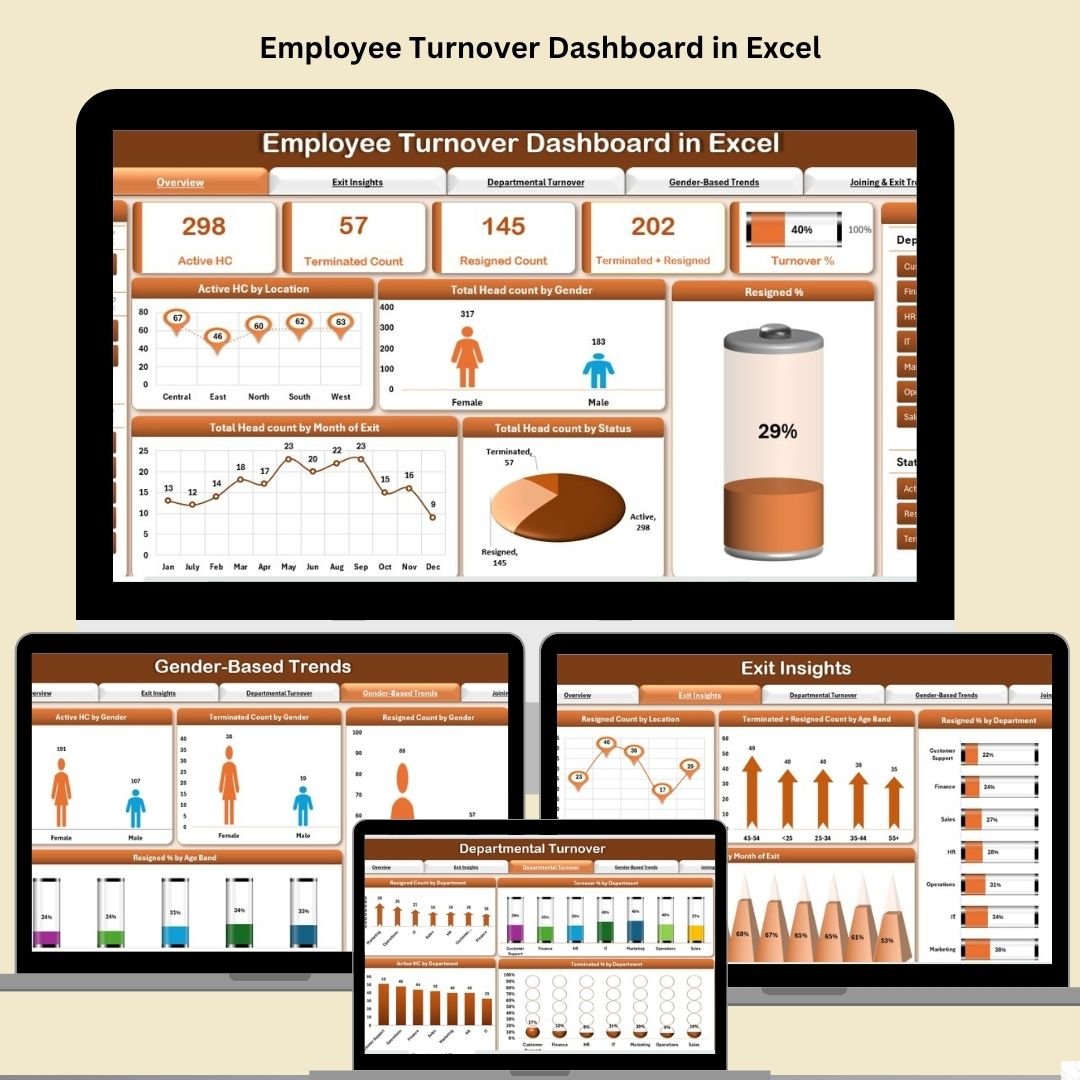
Employee Turnover Dashboard in Excel
4. Procurement Dashboard in Power BI
Five dynamic Power BI pages: Overview, Supplier Performance, Order Status, Payment Analysis, and Category Analysis. Geo-mapping, dynamic slicers, and drill-through visuals deliver a standout tool for supply chain and procurement consulting engagements. View product
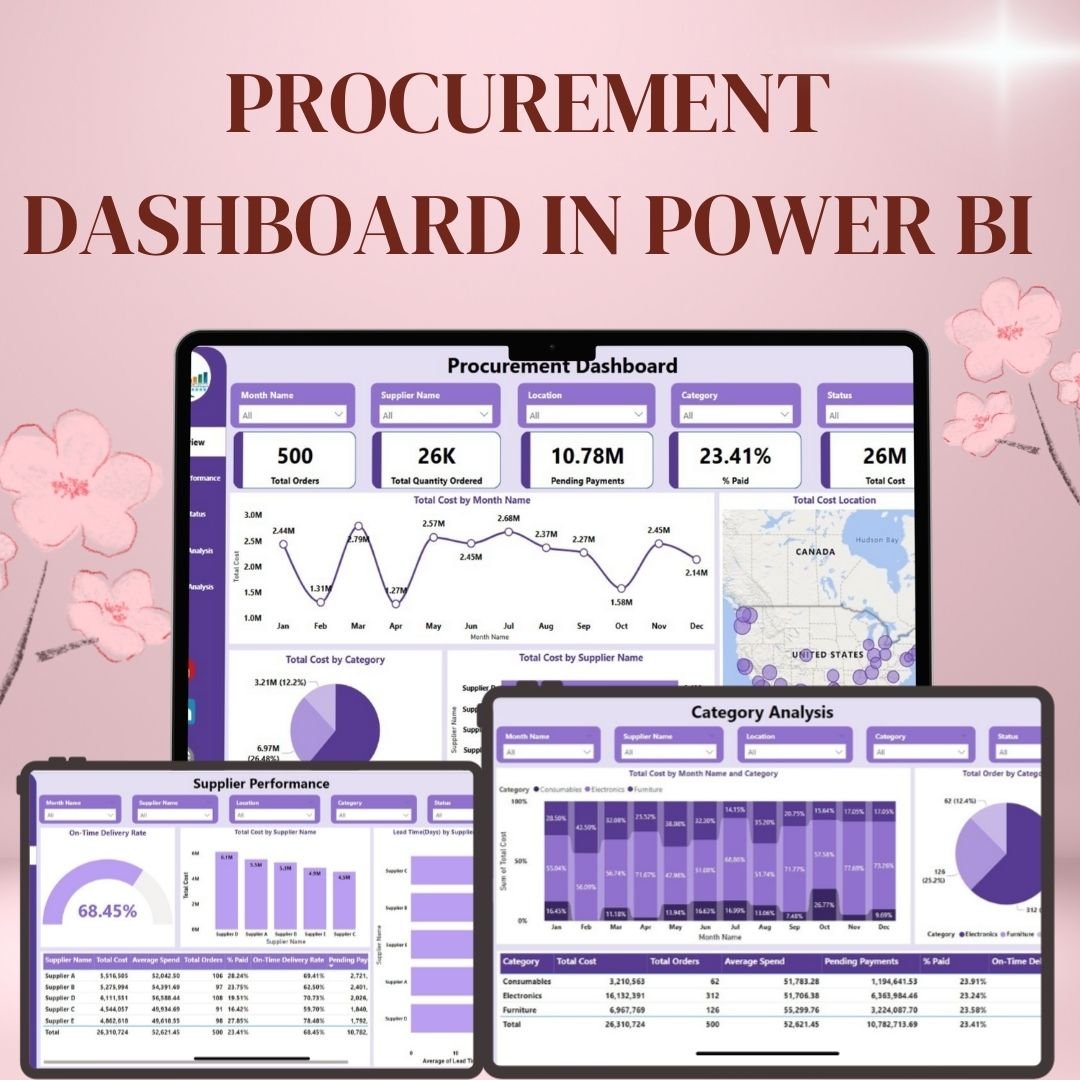
Procurement Dashboard in Power BI
5. Construction Dashboard in Power BI
Six Power BI pages: Project Overview, Budget vs. Cost, Contractor & Department Performance, Safety & Risk, Monthly Trends, and Decomposition View. Built for PMO leaders, capital project consultants, and construction executives managing multi-site operations. View product
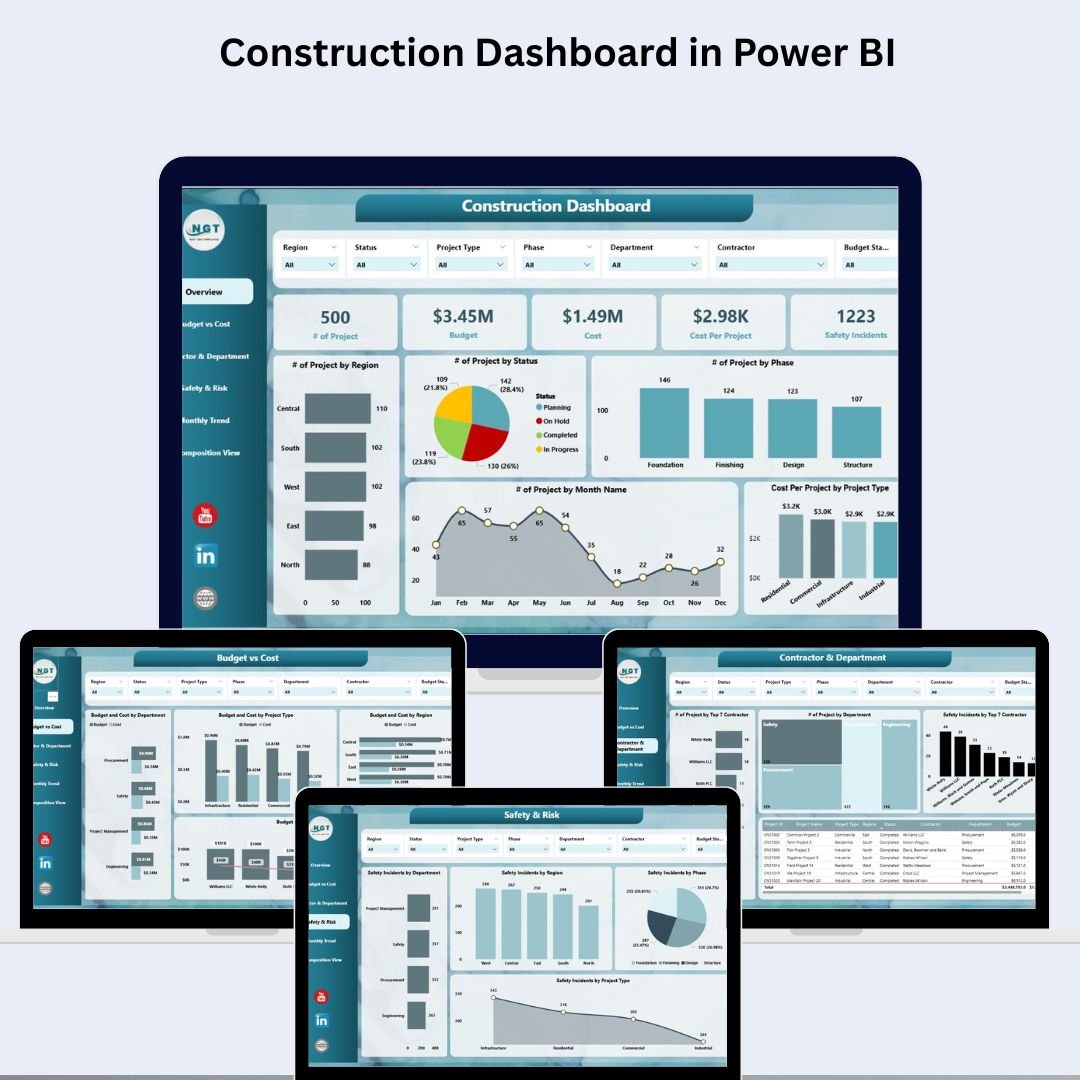
Construction Dashboard in Power BI
6. Healthcare Dashboard in Excel
Six worksheet pages tracking patient data, financial performance, doctor performance, diagnosis analysis, and departmental efficiency. An essential tool for healthcare management consultants and hospital administrators presenting clinical and operational data to boards. View product

Healthcare Dashboard in Excel
7. Transportation & Logistics Dashboard in Excel
Five PivotTable-powered pages covering carrier performance, route analysis, product shipment analytics, and time-based trend tracking. KPI cards auto-update from a structured data table — ready for logistics strategy reviews and supply chain optimization projects. View product
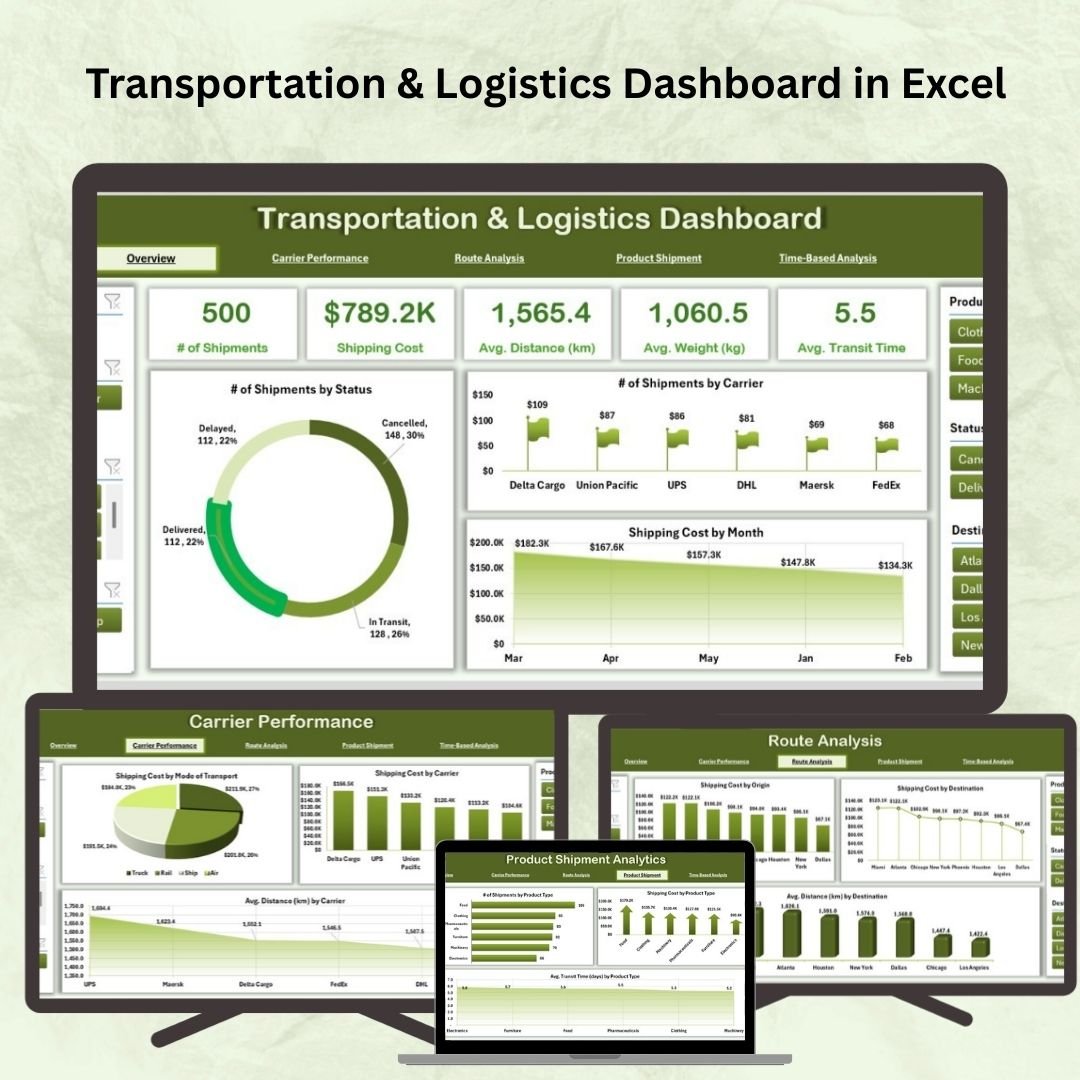
Transportation & Logistics Dashboard in Excel
8. IT Support Ticket Dashboard in Excel
Six worksheet tabs: Overview KPIs, Issue Analysis, Priority Analysis, Technician Performance, Location-Based Analysis, and Data Entry. Tracks total tickets, resolution time, satisfaction scores, and open vs. closed trends. Built for IT managers, MSPs, and helpdesk optimization projects. View product
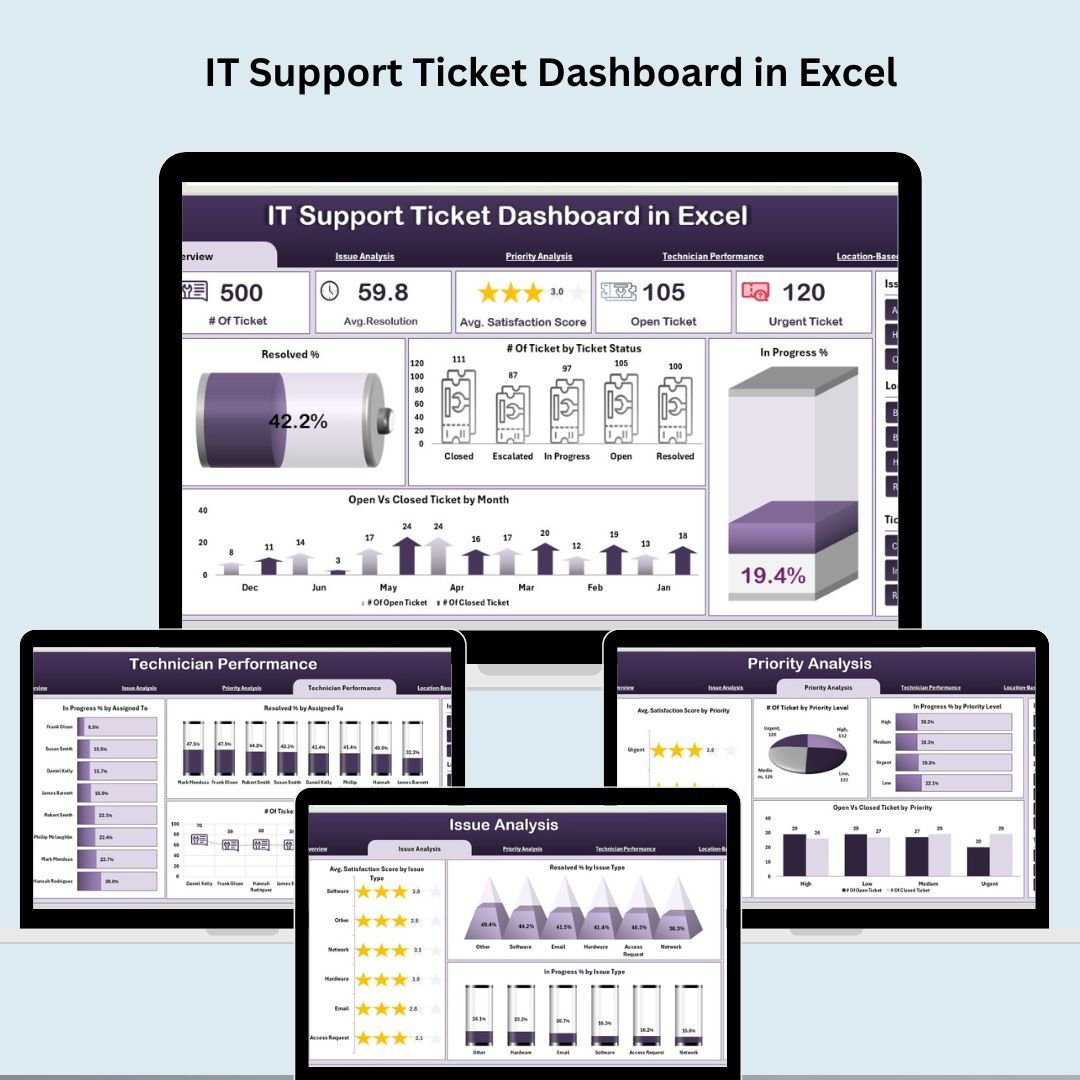
IT Support Ticket Dashboard in Excel
9. Insurance Dashboard in Excel
KPI trend analysis for claim approval rates, processing times, and payout accuracy — with dynamic month selection, target-setting, and historical comparisons built in. Designed for insurance companies and consulting firms serving the financial services sector. View product

Insurance Dashboard in Excel
10. Risk Management Dashboard in Excel
Six dashboard tabs: Overview KPIs, Risk Severity Analysis, Owner Tracking, Departmental Distribution, Monthly Trends, and Data Entry. Centralized risk logging with escalation alerts, probability scoring, and overdue tracking. Essential for GRC consulting, internal audit, and risk committee presentations. View product
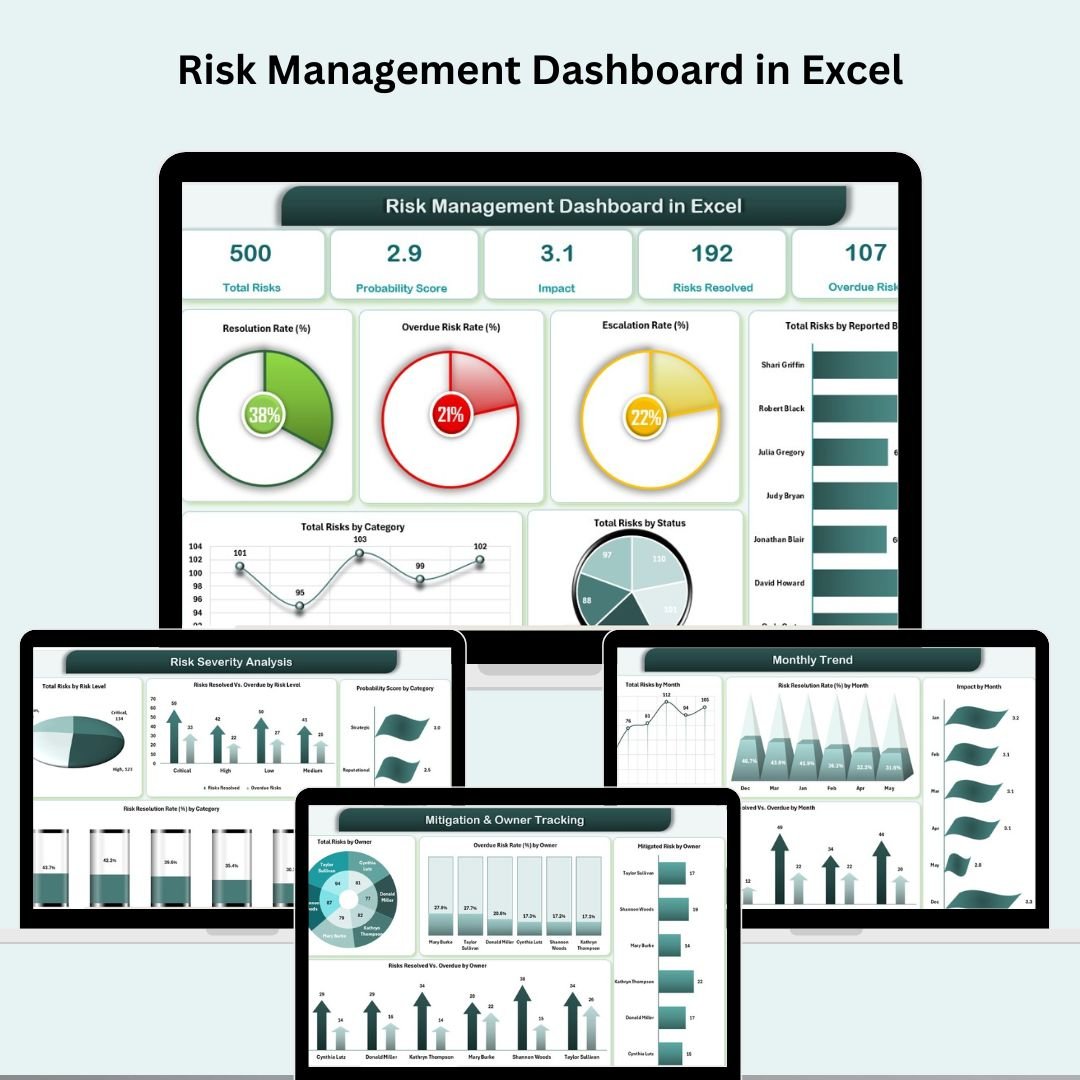
Risk Management Dashboard in Excel
💡 Smart Comparison — Individual vs Bundle
| # | Template | Platform | Individual |
|---|---|---|---|
| 1 | Manufacturing Dashboard in Excel | MS Excel | $17.99 |
| 2 | Finance Summary Dashboard in Excel | MS Excel | $17.99 |
| 3 | Employee Turnover Dashboard in Excel | MS Excel | $17.99 |
| 4 | Procurement Dashboard in Power BI | Power BI | $17.99 |
| 5 | Construction Dashboard in Power BI | Power BI | $17.99 |
| 6 | Healthcare Dashboard in Excel | MS Excel | $17.99 |
| 7 | Transportation & Logistics Dashboard in Excel | MS Excel | $17.99 |
| 8 | IT Support Ticket Dashboard in Excel | MS Excel | $17.99 |
| 9 | Insurance Dashboard in Excel | MS Excel | $17.99 |
| 10 | Risk Management Dashboard in Excel | MS Excel | $17.99 |
| Individual Total | $179.90 | ||
| Consultant’s Toolkit (Save 44%) | $99.99 | ||
🚀 Strategic Advantages of the Consultant’s Toolkit
Cover Any Client Industry Instantly. Whether your next engagement is in manufacturing, healthcare, logistics, or financial services, you have a presentation-ready dashboard already waiting. No build time. No custom development. Load the template, paste the client data, and walk into the meeting.
Cross-Functional Reporting in One Package. The toolkit spans operational, financial, HR, risk, and IT functions. For projects requiring a holistic view of a business — such as due diligence, organizational health assessments, or transformation programs — you can pull insights from multiple dashboards simultaneously.
Excel + Power BI Flexibility. Eight Excel files work offline, on any device, without a Power BI licence. The two Power BI files deliver enterprise-grade interactivity for clients with existing Power BI infrastructure. The combination covers the full spectrum of client technical environments.
🛠️ Best Practices for Deploying the Consultant’s Toolkit
- Start with a structured data extract from the client’s ERP, HRIS, or ticketing system and paste it directly into the Data sheet of the relevant template.
- Lock the Support or Config sheets before handing off to a client team to prevent accidental formula edits.
- Use the sample data as a demo — show the client what the dashboard looks like with data before they provide their own, which helps manage expectations and speeds up data collection.
- Create a client folder with renamed copies of each relevant template. Use naming conventions like ClientName_Manufacturing_Dashboard_v1.xlsx for version control.
- Combine dashboards for board packs by exporting PDF snapshots of key pages from each template and assembling them into a single presentation-ready document.
📚 Explore More Template Collections
❓ Frequently Asked Questions
What is the Consultant’s Toolkit?
It’s a bundle of 10 premium dashboard templates in Excel and Power BI, covering Manufacturing, Finance, HR, Procurement, Construction, Healthcare, Logistics, IT Support, Insurance, and Risk Management. All 10 are included in one download at a 44% discount vs. buying individually.
What formats are included?
Eight templates are Microsoft Excel (.xlsx) files. Two — the Procurement Dashboard and Construction Dashboard — are Power BI (.pbix) files with matching Excel data models. All Excel files are compatible with Excel 2016, 2019, 2021, and Microsoft 365 on Windows and Mac.
Do I need Power BI to use all 10 templates?
Only for the two Power BI dashboards. Power BI Desktop is a free download from Microsoft. The other 8 templates are 100% native Excel and work completely offline without any additional software.
Can I use these templates for multiple clients?
Yes. The templates are purchased as a single-user licence. You can use them across as many of your own client engagements as you need — simply create a new copy for each client and replace the data.
How long does setup take?
Most users are up and running within 5 minutes. Extract the ZIP, open the relevant template, paste your data into the Data sheet, and the dashboard updates automatically. All formulas, charts, and KPI cards are pre-built.
What if I only need some of the templates?
If you need just one or two specific dashboards, you can purchase them individually from our catalog. But at $99.99 for all 10 — versus $17.99 each — the bundle pays for itself the moment you need a second template.
Is there a Money-Back Guarantee?
We stand behind every product in the Consultant’s Toolkit. If you have any issues with a template, contact us at info@nextgentemplates.com and our support team will help you resolve it.
🎯 Conclusion
The Consultant’s Toolkit is the most efficient investment a consultant or business analyst can make in their reporting infrastructure. Ten dashboards. Ten industries. One download. Whether you’re presenting to a board, closing a project, or setting up recurring reporting for a retainer client, you now have the right tool ready for every scenario. Get the Consultant’s Toolkit for $99.99 and save $79.91 today.
💼 Add the Consultant’s Toolkit to Your Arsenal
10 Templates | Excel + Power BI | Only $99.99 (Save 44%)
🎥 For step-by-step video tutorials on dashboard templates, visit: youtube.com/@PKAnExcelExpert