The flooring and tiles business depends on fast, accurate reporting. A showroom may sell hundreds of tile sizes, finishes, product categories, installation types, and regional orders every month. Without a structured dashboard, teams often spend hours combining sales, cost, delivery, customer, product, and fulfillment data before they can make one useful decision.
The Flooring and Tiles Dashboard in Excel solves that problem with a ready-to-use 7-sheet Excel reporting workbook. It includes 5 executive cards, 20 analysis charts, slicers, a data sheet, and a pivot-backed support sheet. You can replace the sample data, refresh the workbook, and review revenue, gross profit, area sold, orders, quality rating, products, regions, sales reps, delivery cost, and installation margins in one place.
Click here to get the Flooring and Tiles Dashboard in Excel.
Flooring and Tiles Dashboard in Excel
Key Features of Flooring and Tiles Dashboard in Excel
This Excel dashboard is designed for people who need practical business reporting without building charts, formulas, or pivot tables from scratch.
- 7 worksheet tabs covering Overview, Sales, Products, Costs, Fulfillment, Data, and Support.
- 5 KPI cards for Total Revenue, Gross Profit Value, Total Area Sold, Total Orders, and Avg. Quality Rating.
- 20 ready-made charts for order status, revenue, region, month, product category, material cost, margin, delivery cost, sales rep, and installation analysis.
- Slicer-based filtering so users can move from total business view to a filtered view quickly.
- Editable data sheet where the sample records can be replaced with your own flooring and tiles data.
- Pivot-backed support sheet that can be refreshed from the Excel Data tab after updating the records.
- Microsoft Excel format for local control, easy customization, and one-time ownership.
Dashboard Pages Explanation
1. Overview Page
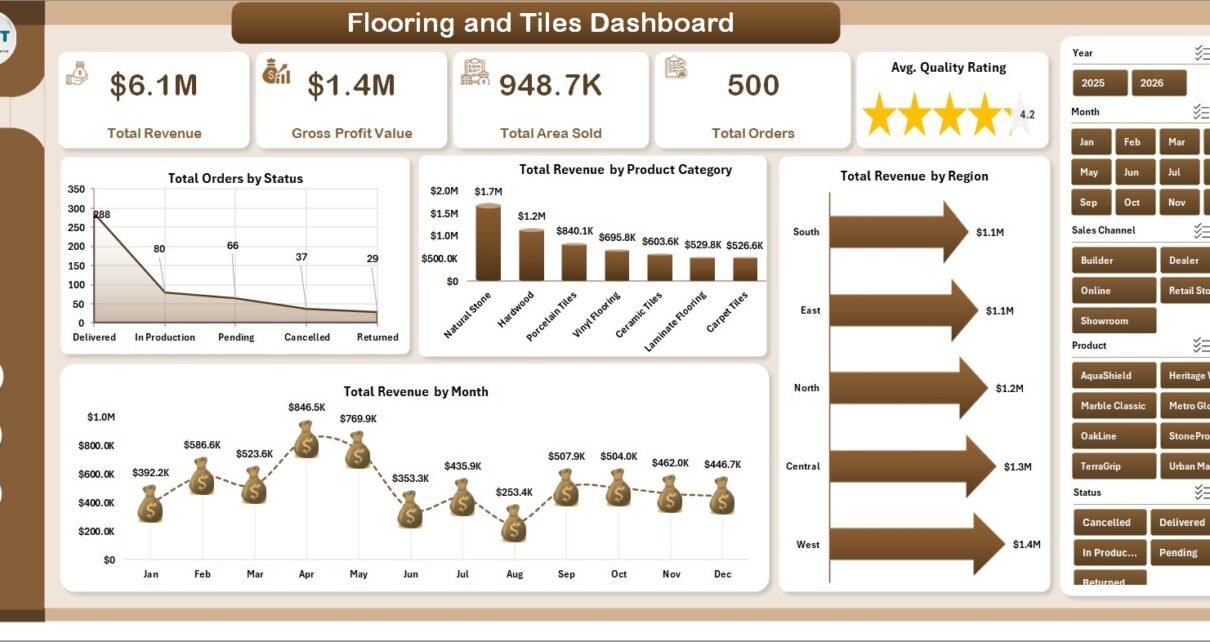
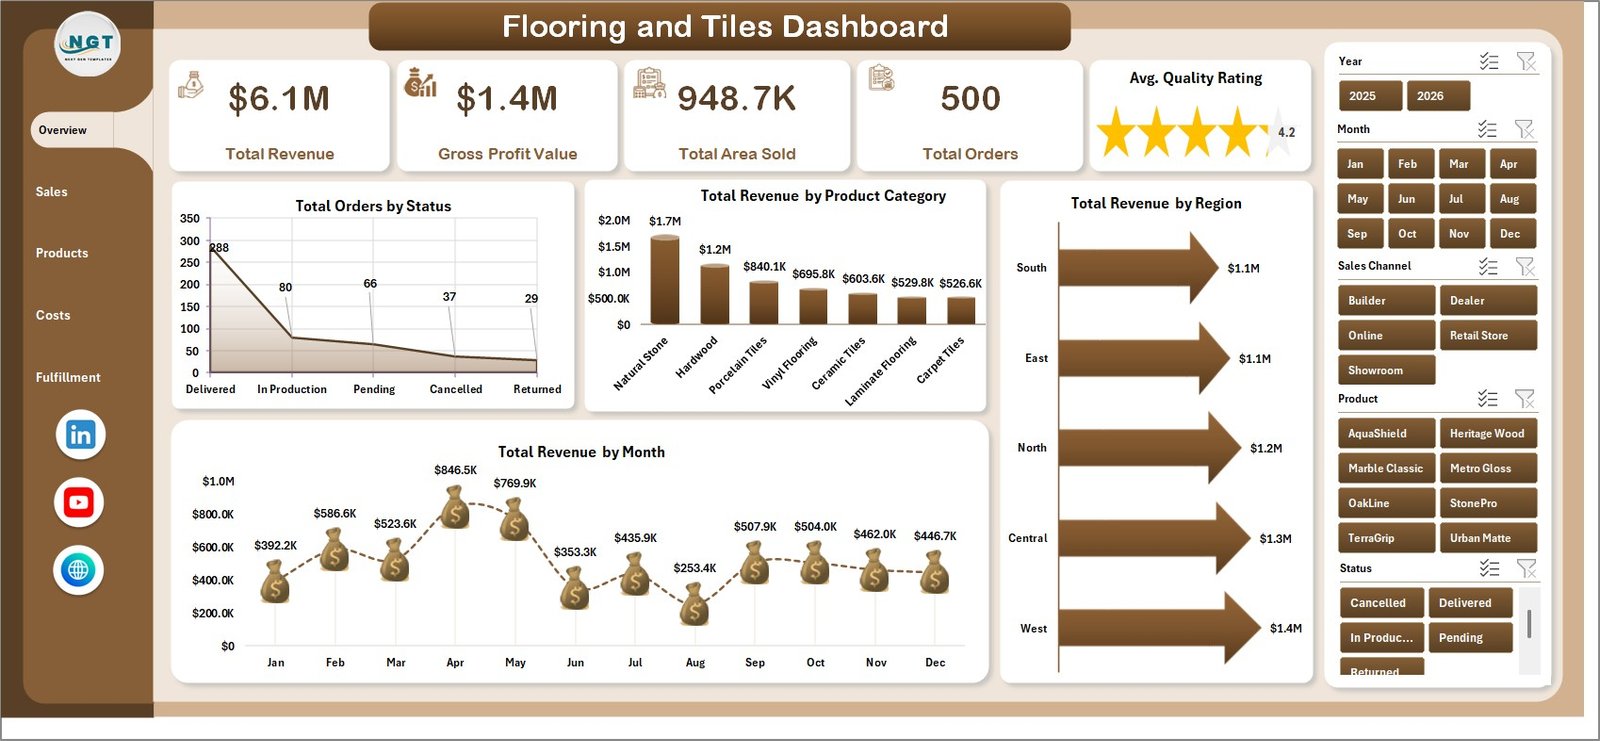
The Overview Page gives a senior-level snapshot of the flooring and tiles business. At the top, the dashboard shows Total Revenue, Gross Profit Value, Total Area Sold, Total Orders, and Avg. Quality Rating. These cards help leaders see financial performance, volume, order count, and service quality before reviewing detailed charts.
The Overview Page also includes slicers so you can filter the entire dashboard quickly. For example, you can filter by period, product, region, sales channel, or other available fields depending on the workbook structure.
Total Orders by Status: This chart shows how orders are distributed across statuses such as completed, pending, cancelled, or in progress. It helps managers understand whether order flow is healthy or whether fulfillment issues need attention.
Total Revenue by Product Category: This chart compares revenue across product categories. It helps owners and managers identify which flooring or tile categories create the most sales and which categories may need promotion, stock review, or pricing changes.
Total Revenue by Region: This chart compares regional revenue performance. It is useful for territory planning, regional sales reviews, and understanding which markets are growing or underperforming.
Total Revenue by Month: This chart shows monthly sales movement. It helps teams see seasonality, campaign impact, slow months, and growth trends across the year.
Overview Page
2. Sales Page
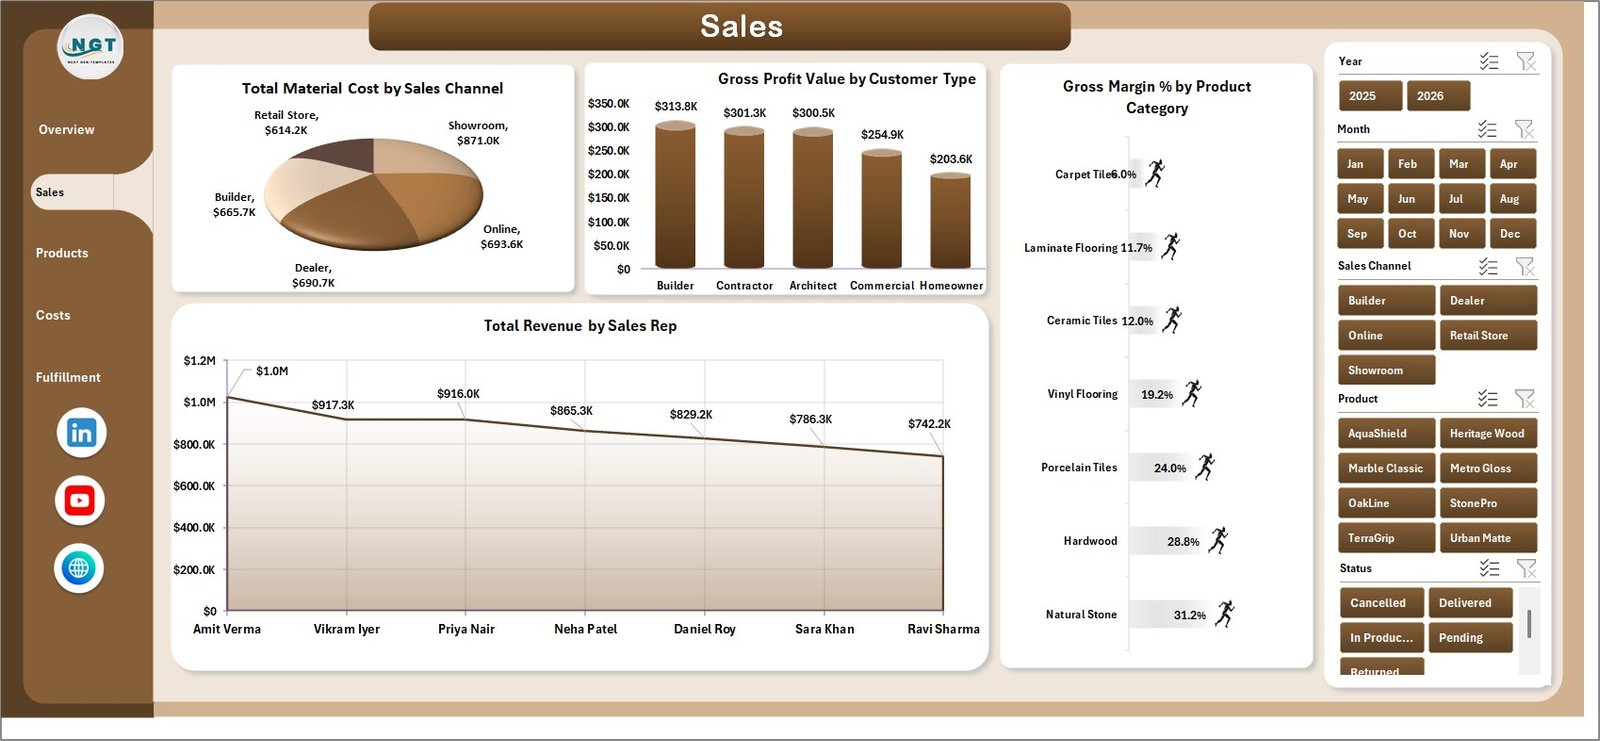
The Sales Page focuses on sales channel, customer type, product category, and sales representative performance. It helps commercial teams understand where revenue and margin are coming from.
Total Material Cost by Sales Channel: This analysis compares material cost across channels such as showroom, dealer, online, contractor, or wholesale sales. It helps teams see which channels carry higher material cost and where pricing discipline may be needed.
Gross Profit Value by Customer Type: This chart shows gross profit contribution by customer type. It helps users compare retail, contractor, wholesale, or commercial customers and identify the most profitable segments.
Gross Margin % by Product Category: This analysis shows which categories deliver stronger or weaker margin percentages. It is useful for product mix decisions and supplier negotiation.
Total Revenue by Sales Rep: This chart compares sales performance by representative. It helps managers review individual contribution and plan coaching or incentive discussions.
Sales Page
3. Products Page
The Products Page helps users understand product-level performance by finish, tile size, product category, and individual product. This is especially helpful when a business sells many SKUs and needs a quick way to see which products deserve more attention.
Gross Margin % by Finish: This chart compares margin by finish type. It helps teams understand whether glossy, matte, textured, polished, or other finishes are more profitable.
Total Area Sold by Tile Size: This chart measures area sold by tile size. It helps purchasing and sales teams understand which sizes are moving faster.
Total Material Cost by Product Category: This analysis compares material cost by product category. It helps finance and operations teams monitor cost pressure by category.
Total Revenue by Product: This chart identifies top revenue products. It supports stock planning, product promotion, and sales focus.

Products Page
4. Costs Page
The Costs Page is built for cost control and margin visibility. It connects delivery cost, product-level margin, order status, and sales channel gross profit.
Total Delivery Cost by Region: This chart compares delivery cost across regions. It helps managers identify areas where transport, distance, or logistics complexity may be reducing profitability.
Gross Margin % by Product: This chart compares margin percentage by product. It helps teams find products that sell well but may not be profitable enough.
Total Revenue by Status: This analysis shows revenue tied to order statuses. It helps users understand how much revenue is completed, pending, or at risk.
Gross Profit Value by Sales Channel: This chart compares gross profit by sales channel. It shows which channels contribute the most profit, not just the most revenue.
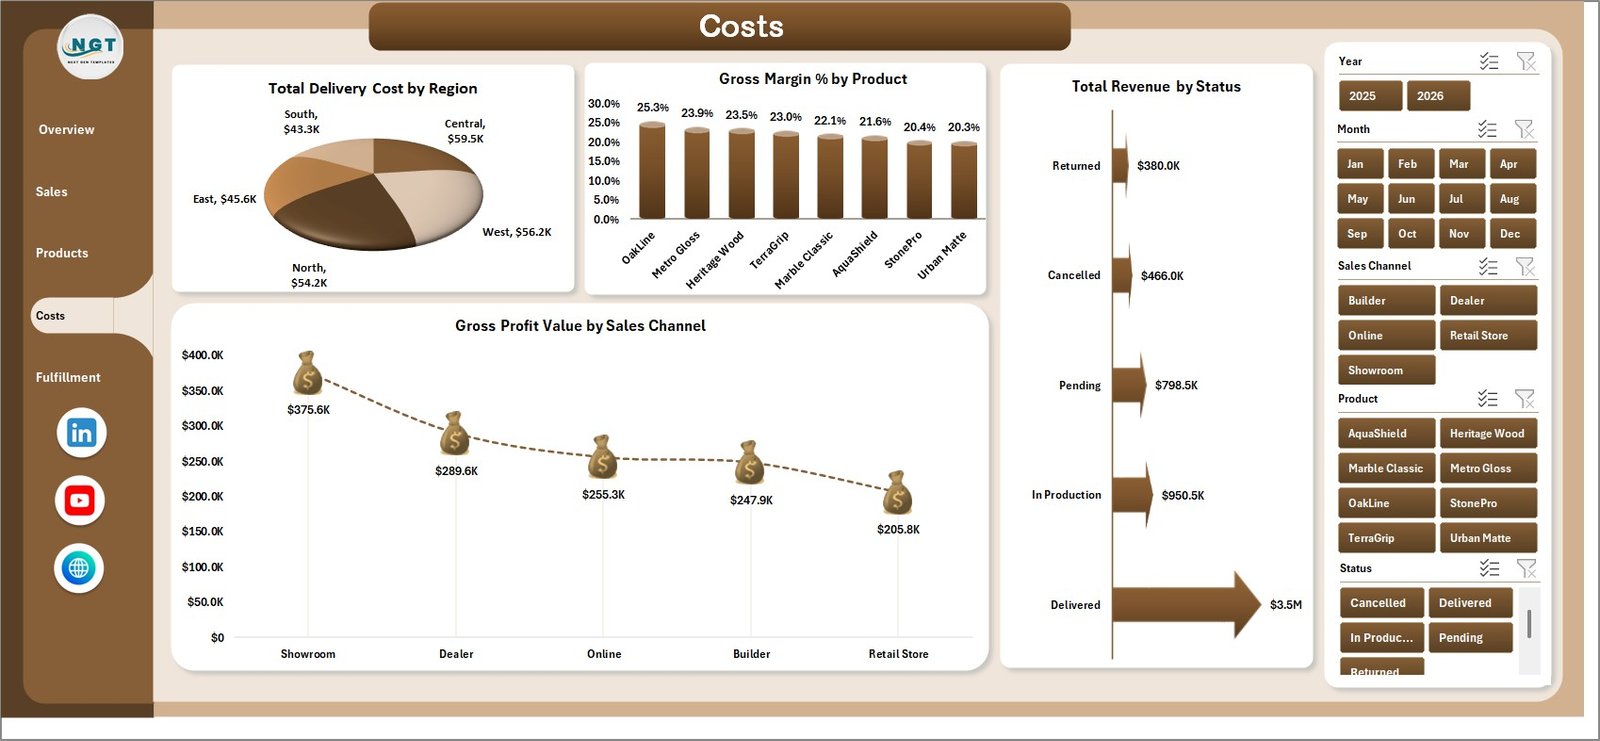
Costs Page
5. Fulfillment Page
The Fulfillment Page connects operational delivery and installation performance with margin and regional profitability. It is useful for teams that manage both product sales and installation services.
Gross Margin % by Installation Type: This chart compares margin by installation type. It helps identify which job types are more profitable and which need better pricing or cost control.
Total Material Cost by Region: This chart shows where material cost is concentrated. It supports regional cost review and procurement planning.
Gross Profit Value by Region: This chart compares gross profit across regions. It helps leaders understand where the business is creating the strongest contribution.
Gross Margin % by Month: This chart shows monthly margin movement. It helps users see whether profitability is improving, declining, or fluctuating during seasonal periods.
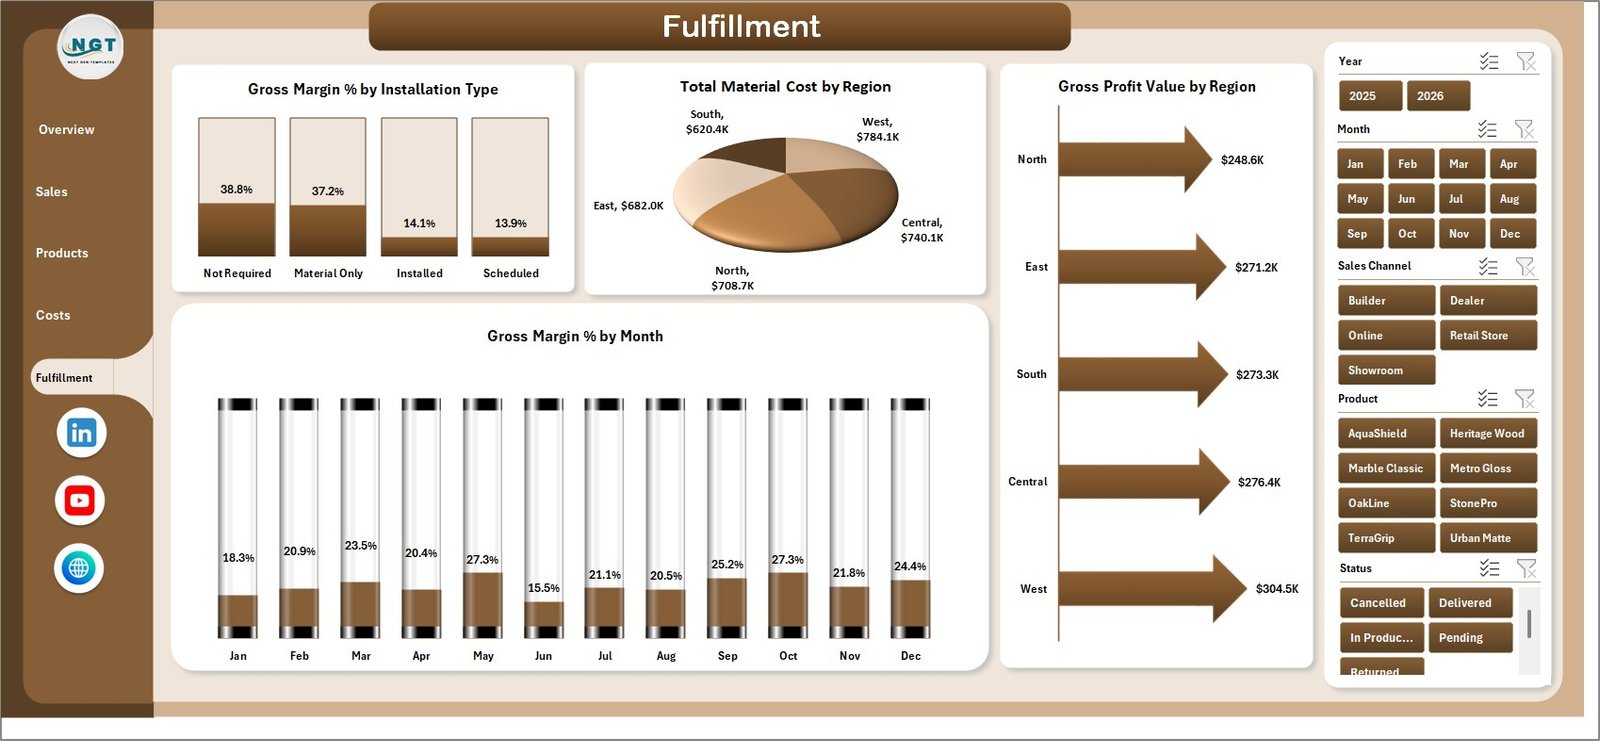
Fulfillment Page
6. Data Sheet Tab
The Data Sheet is where you add or paste your own records in the same format. This is the input layer of the workbook. After you update the records, the dashboard can refresh based on the new data.
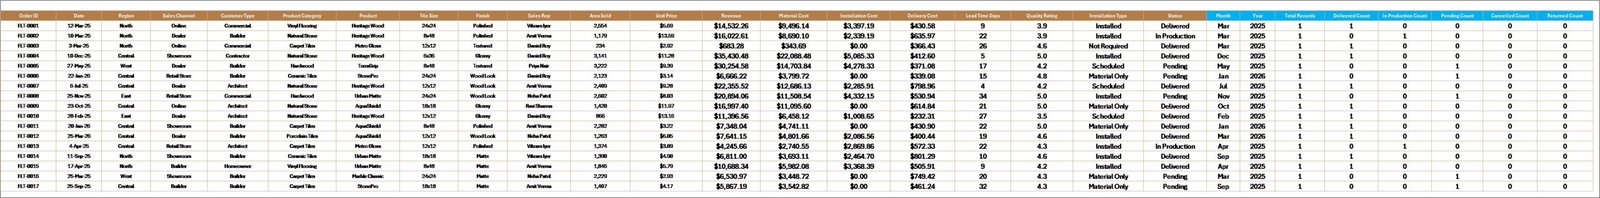
Data Sheet tab
7. Support Sheet Tab
The Support Sheet contains the pivot tables used to create the entire dashboard dynamically. After updating the Data Sheet, go to the Data tab in the Excel Ribbon and click Refresh All. All pivots and related charts will refresh. You can keep this sheet hidden after setup.
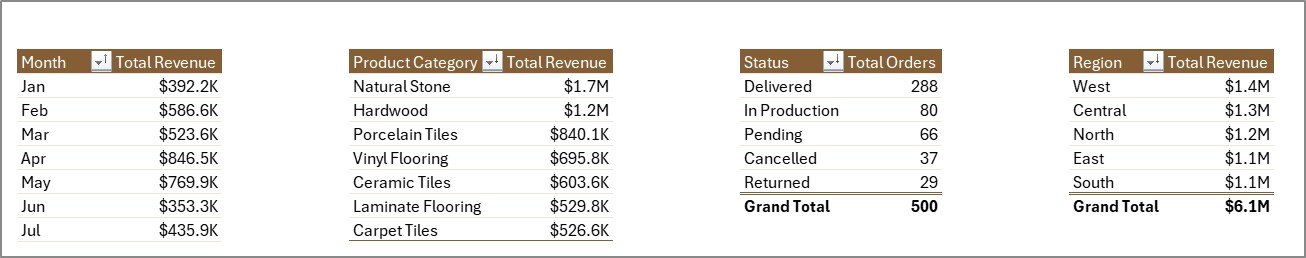
Support sheet tab
Flooring and Tiles Dashboard in Excel vs. Google Sheets vs. Paid CRM/SaaS – Feature Comparison
| Feature | Flooring and Tiles Dashboard in Excel | Google Sheets Alternative | Paid CRM/SaaS |
|---|---|---|---|
| Cost | One-time purchase | Usually one-time or free file copy | Monthly subscription |
| Platform | Microsoft Excel | Browser-based Google Sheets | Cloud system |
| Setup time | Replace data and refresh | Copy file and replace data | Implementation and configuration |
| Real-time team collaboration | Possible through OneDrive or SharePoint | Native Google Drive sharing | Built in |
| Mobile access | Excel app or browser | Google Sheets app or browser | Vendor app |
| Customizable fields | High for Excel users | High for spreadsheet users | Limited by plan and permissions |
| Share with link | Possible with OneDrive | Native sharing | Usually role-based |
| Year-1 cost at 5 users | Template cost only | Low template cost | Often hundreds or thousands of dollars |
| Best use case | Sales, cost, product, and fulfillment reporting | Collaborative spreadsheet reporting | Full CRM, ERP, or operational workflow |
Who Should Use This Template
This template is a strong fit for flooring showrooms, tile distributors, building-material suppliers, installation contractors, regional sales teams, and business owners who want practical reporting in Excel.
It is also useful for analysts who need a reusable structure for monthly reporting. Instead of rebuilding charts every month, they can paste new data, refresh pivots, and review the updated dashboard pages.
This template is not designed to replace a full ERP, inventory system, point-of-sale system, or CRM. It does not automate stock movements, create invoices, track live warehouse bins, or sync accounting transactions.
Real-World Use Cases
Showroom Sales Review: A showroom manager uses Total Revenue by Product Category, Total Revenue by Sales Rep, and Gross Margin % by Product to prepare a weekly sales review.
Distributor Regional Planning: A regional distributor uses Total Revenue by Region, Total Delivery Cost by Region, and Gross Profit Value by Region to compare territory profitability.
Installation Profitability Review: An installation coordinator uses Gross Margin % by Installation Type and Gross Margin % by Month to decide which job types need better pricing or cost control.
Advantages of Flooring and Tiles Dashboard in Excel
It saves reporting time. The workbook already includes cards, slicers, charts, and pivot logic, so users do not need to build a dashboard from scratch.
It connects revenue with cost and margin. Many reports focus only on sales. This template also reviews material cost, delivery cost, gross profit, and gross margin percentage.
It supports product and regional decisions. Product, category, finish, tile size, region, and channel views help managers make better pricing, stocking, and sales decisions.
It stays inside Excel. Many teams already use Excel every day, so adoption is easier than moving directly to a new reporting system.
Opportunities for Improvement
The dashboard is file-based, so it depends on users updating the Data Sheet correctly. If the business needs live integration with POS, accounting, or inventory software, a custom automation or SaaS system may be needed.
Advanced users may also want to add more fields, such as supplier, brand, project type, payment status, or lead source. Since it is an Excel file, these changes are possible, but they require Excel knowledge.
Best Practices
- Keep the Data Sheet column structure consistent.
- Refresh all pivots after every data update.
- Review margin charts before making pricing decisions.
- Use slicers during sales meetings to focus on one region, product category, or period at a time.
- Hide the Support Sheet after setup to reduce accidental edits.
- Save a backup copy before making structural changes to the workbook.
For help with Excel table and PivotTable basics, you can also review Microsoft Learn’s Excel documentation here: Microsoft Excel help and learning.
Explore Relevant Templates
If you need KPI-based tracking, see the Flooring and Tiles KPI Dashboard in Excel. You may also like the Construction and Real Estate Inventory Management KPI Dashboard in Excel and the Fertilizer Manufacturing Dashboard in Excel.
Frequently Asked Questions
What is the Flooring and Tiles Dashboard in Excel?
It is a ready-to-use Excel dashboard template for tracking revenue, gross profit, area sold, orders, product performance, costs, regions, sales reps, and fulfillment metrics.
Can I replace the sample data?
Yes. You can replace the sample records in the Data Sheet, keep the same format, and refresh all pivots from the Excel Data tab.
How many worksheet tabs are included?
The workbook includes 7 tabs: Overview, Sales, Products, Costs, Fulfillment, Data, and Support.
Does it include slicers?
Yes. The dashboard includes slicers so users can apply filters and review filtered dashboard views quickly.
Can I hide the Support Sheet?
Yes. The Support Sheet contains pivot tables and can be hidden after setup to keep the workbook clean for users.
Do I need advanced Excel skills?
No advanced skills are needed for normal use. You mainly update the Data Sheet, refresh all pivots, and review the dashboard pages.
Is this a full inventory system?
No. It is a reporting dashboard, not a full inventory, accounting, POS, CRM, or ERP system.
About the Author
Built by PK – Microsoft Certified Professional with 15+ years of Excel, Google Sheets, and Power BI experience. Founder of NextGenTemplates, reaching 300K+ subscribers across YouTube channels. Every template is hand-built and tested before release.
Conclusion
The Flooring and Tiles Dashboard in Excel gives flooring and tile businesses a practical way to monitor revenue, gross profit, orders, area sold, quality rating, product performance, cost movement, regional results, and fulfillment profitability. It keeps reporting inside Excel while giving managers a structured dashboard they can refresh and reuse every month.
Download the Flooring and Tiles Dashboard in Excel from NextGenTemplates and start turning your sales, product, cost, and fulfillment data into clear insights.
Visit our YouTube channel to learn step-by-step Excel dashboard tutorials.