Flooring and tile businesses handle revenue, orders, material cost, delivery cost, installation cost, product categories, finishes, regions, customer types, sales channels, and sales representatives at the same time. When that data stays in separate files, a monthly review can easily take hours before leaders see the real performance story.
The Flooring and Tiles Dashboard in Power BI is built to reduce that reporting work. It gives flooring retailers, tile distributors, construction material suppliers, and installation teams 5 ready report pages for overview, sales, products, costs, and fulfillment analysis. You can review Total Revenue, Total Orders, Total Material Cost, Total Area Sold, Total Delivery Cost, and Gross Margin from one Power BI report.
Click here to get the Flooring and Tiles Dashboard in Power BI.
Flooring and Tiles Dashboard in Power BI
Key Features of Flooring and Tiles Dashboard in Power BI
- 5 Power BI report pages for Overview, Sales, Products, Costs, and Fulfillment.
- 6 top-level KPI cards for Total Revenue, Total Orders, Total Material Cost, Total Area Sold, Total Delivery Cost, and Gross Margin.
- Multiple slicers for quickly filtering report pages and reviewing selected business segments.
- Sales performance analysis by sales channel, customer type, and sales representative.
- Product performance analysis by finish, product category, material cost, and product revenue.
- Cost and margin analysis by product, status, sales channel, delivery region, category, and installation month.
- Power BI Desktop compatibility so users can customize visuals, data fields, relationships, and measures as needed.
Dashboard Pages Explanation
1. Overview Page
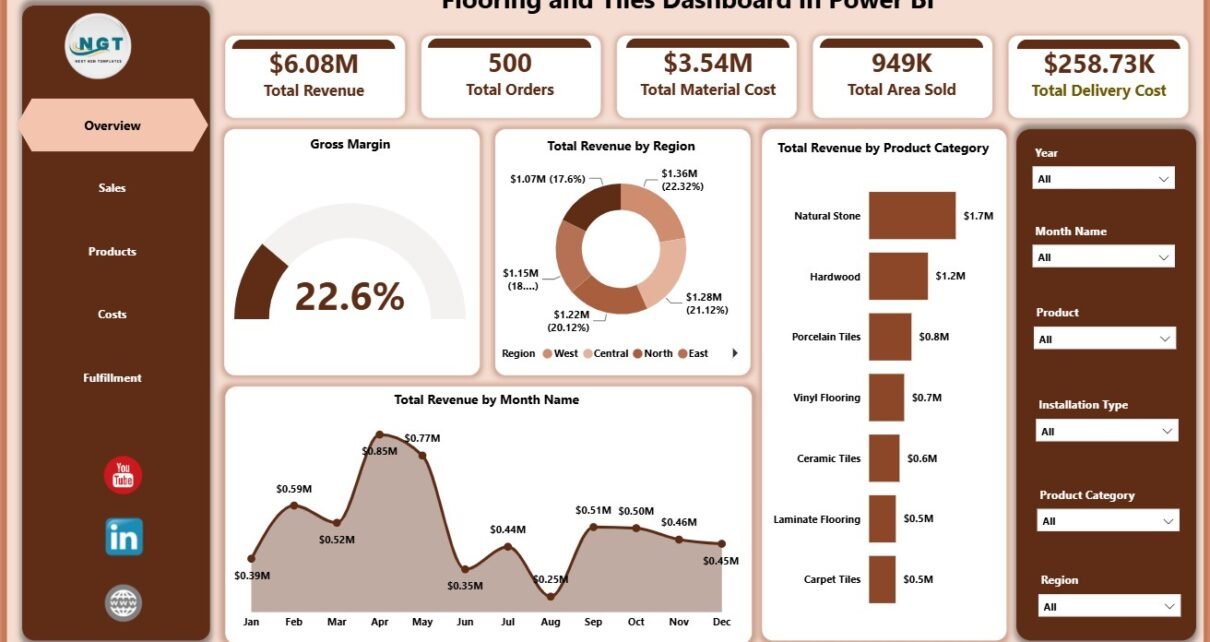
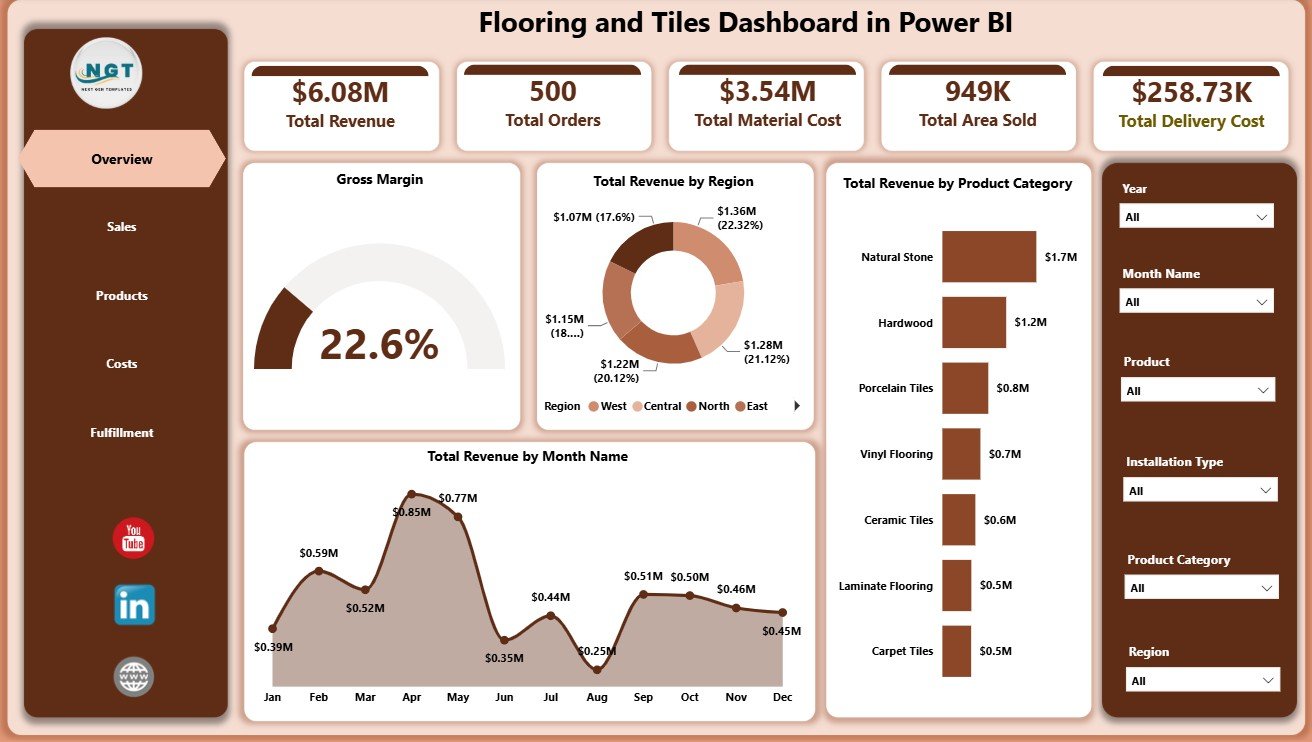
The Overview page gives the high-level business summary. The top cards show Total Revenue, Total Orders, Total Material Cost, Total Area Sold, Total Delivery Cost, and Gross Margin. These cards help owners and managers understand sales volume, cost pressure, delivery cost, and margin before moving into detailed report pages.
Gross Margin by Overall Performance: This visual summarizes profitability across the selected business data. It helps users see whether revenue is turning into healthy margin after material, delivery, and installation-related costs.
Total Revenue by Region: This chart compares revenue across regions. It supports territory planning, regional sales reviews, and local market decisions.
Total Revenue by Product Category: This chart shows which flooring and tile categories generate the most revenue. It helps teams focus inventory, promotions, and supplier negotiations on the right categories.
Total Revenue by Month Name: This chart shows monthly revenue movement. It helps managers identify seasonality, campaign impact, weak months, and growth trends.
Overview Page
2. Sales Page
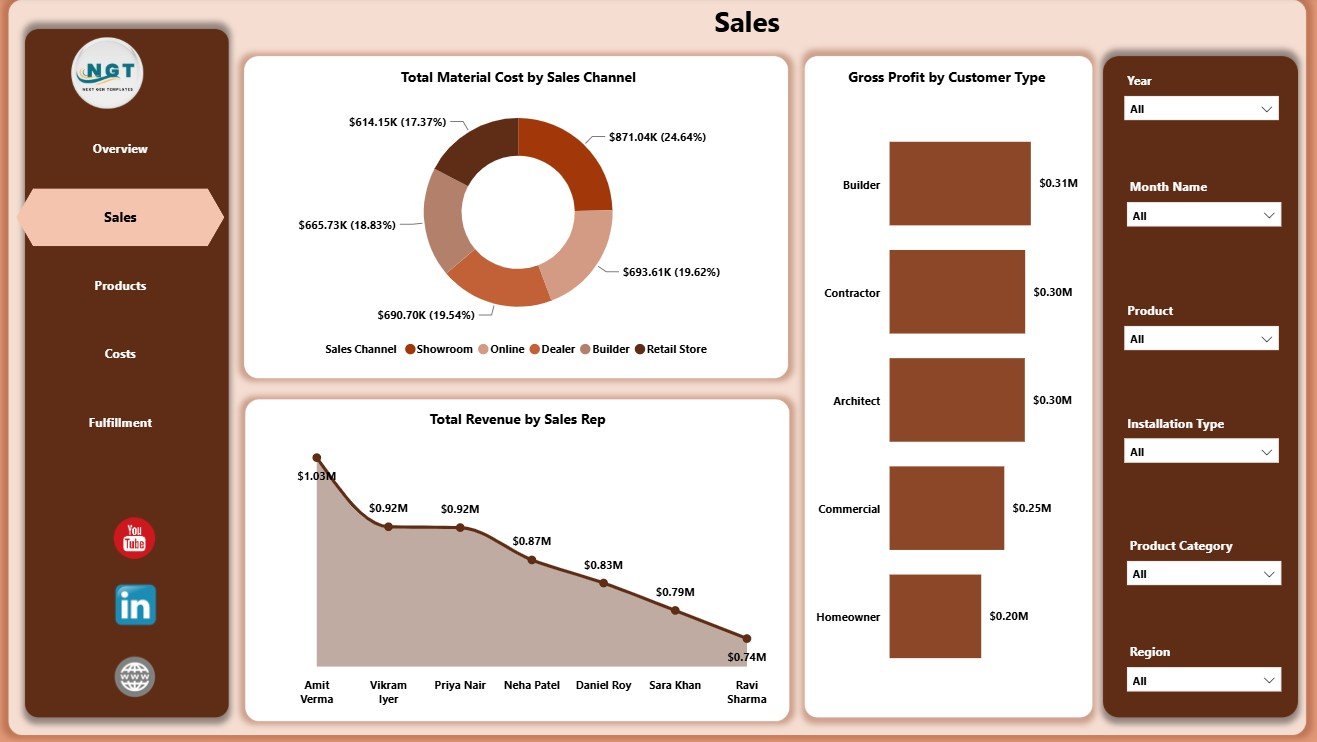
The Sales page focuses on how the business earns revenue and profit through different channels, customers, and sales representatives.
Total Material Cost by Sales Channel: This chart compares material cost across sales channels. It helps users identify channels where material cost is high and margin may need review.
Gross Profit by Customer Type: This chart compares gross profit contribution by customer type. It helps teams understand whether retail, contractor, wholesale, or commercial customers are creating stronger profit.
Total Revenue by Sales Rep: This chart compares revenue by sales representative. It supports coaching, territory review, incentive planning, and sales team accountability.
Sales Page
3. Products Page
The Products page helps users understand what is selling, what costs more, and which finishes or products create stronger margins.
Gross Margin by Finish: This chart compares margin by finish type. It helps teams see whether matte, polished, glossy, textured, or other finishes are more profitable.
Total Material Cost by Product Category: This chart shows where material cost is concentrated. It is useful for cost control, supplier review, and category-level pricing discussions.
Total Revenue by Product: This chart identifies top revenue products. It helps teams decide which products need more stock, promotion, or margin review.
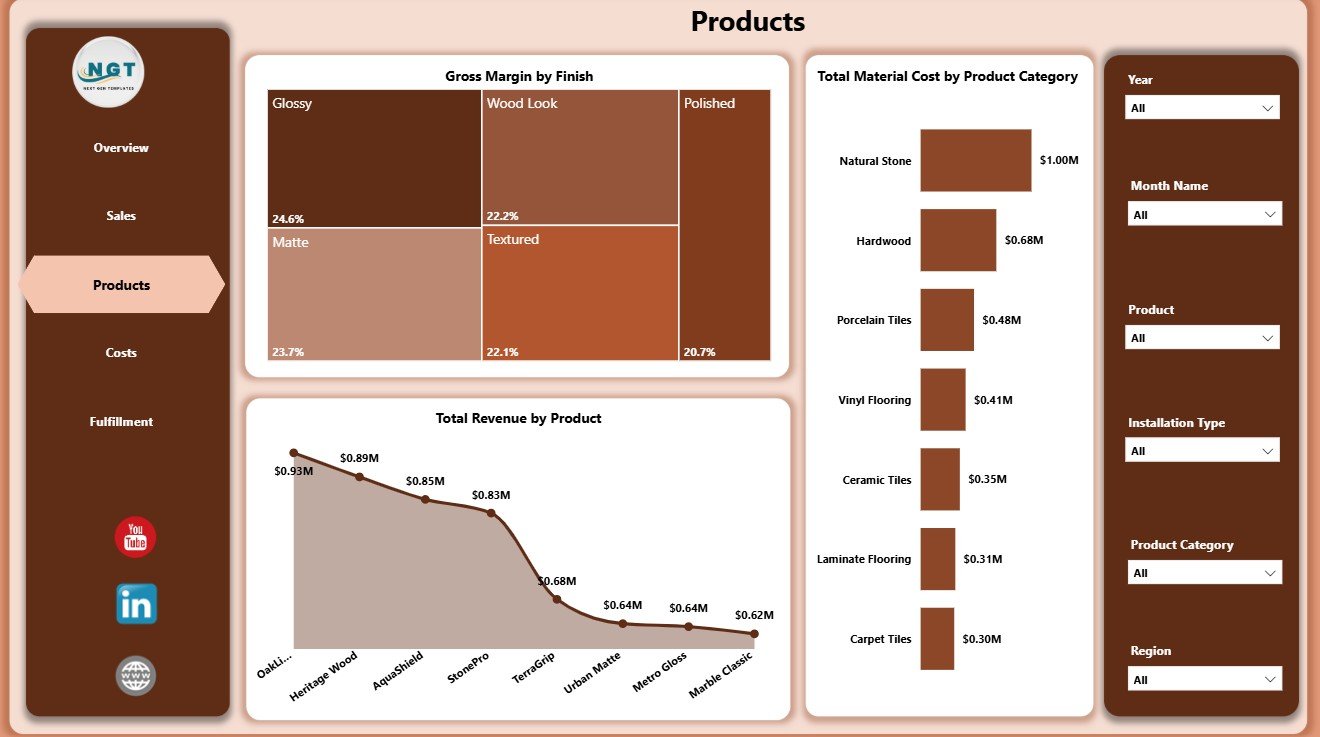
Products Page
4. Costs Page
The Costs page is designed for cost control and profit review. It connects product margin, order status, and channel-level gross profit.
Gross Margin by Product: This chart compares margin by product. It helps users spot products that may sell well but do not produce enough profit.
Total Revenue by Status: This chart shows revenue by order status. It helps teams understand how much revenue is completed, pending, in progress, or at risk.
Gross Profit by Sales Channel: This chart compares profit by sales channel. It highlights which sales channels contribute the most profit, not only the most revenue.
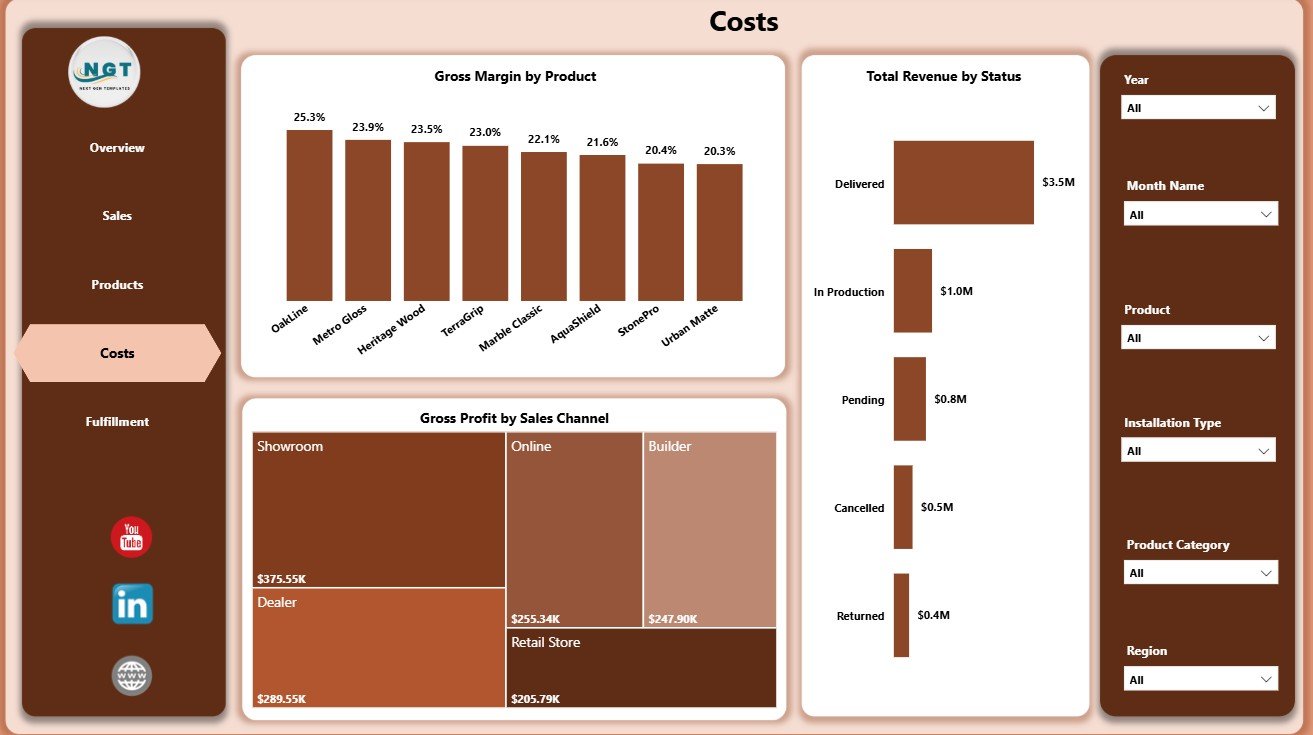
Costs Page
5. Fulfillment Page
The Fulfillment page helps users review delivery and installation costs. This is useful for flooring and tiles businesses because profit often depends on logistics, region, and installation workload.
Total Delivery Cost by Region: This chart compares delivery cost across regions. It helps managers identify areas where transport distance, fuel, routing, or logistics complexity may be affecting profitability.
Total Delivery Cost by Product Category: This chart shows which categories create higher delivery cost. It helps teams review packaging, handling, and delivery pricing by category.
Total Installation Cost by Month Name: This chart tracks installation cost by month. It helps users see seasonal workload, labor cost pressure, and monthly installation trends.
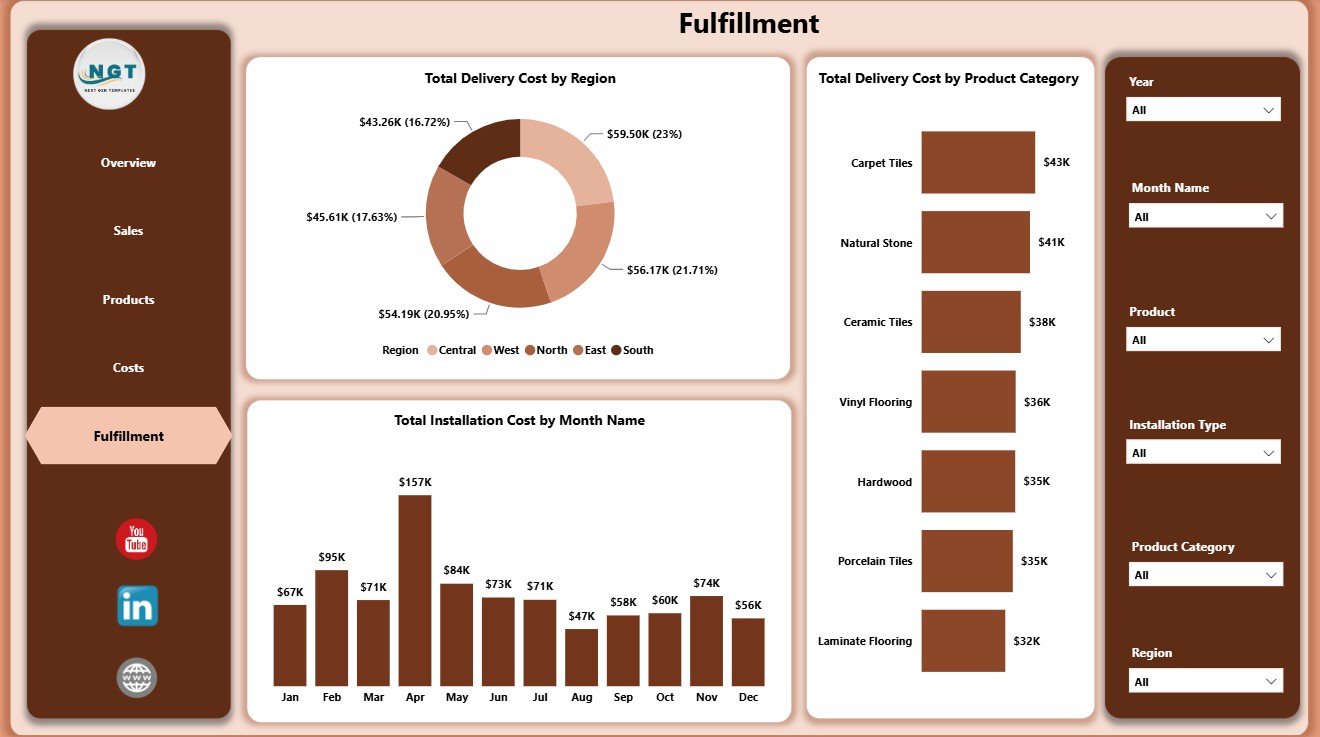
Fulfillment Page
Flooring and Tiles Dashboard in Power BI vs. Tableau vs. Paid CRM/SaaS – Feature Comparison
| Feature | This Power BI Dashboard | Tableau Alternative | Paid CRM/SaaS |
|---|---|---|---|
| Cost | $17.99 one-time template purchase | Requires Tableau license and dashboard build time | Monthly or annual subscription |
| Platform | Power BI Desktop / Power BI Service | Tableau Desktop / Tableau Cloud | Vendor cloud platform |
| Setup time | Open PBIX and connect or replace data | Build dashboards or hire BI support | Implementation and configuration |
| Real-time team collaboration | Available through Power BI Service if configured | Available through Tableau Cloud if configured | Usually included by role |
| Mobile access | Power BI mobile app or browser | Tableau mobile app or browser | Vendor app or browser |
| Customizable fields | High for Power BI users | High for Tableau users | Limited by plan and permissions |
| Share with link | Possible with Power BI publishing and permissions | Possible with Tableau Cloud | Usually login controlled |
| Year-1 cost at 5 users | Template cost plus any Microsoft licensing | License cost plus development time | Often hundreds or thousands of dollars |
| Flooring-specific pages | 5 ready pages for sales, products, costs, and fulfillment | Requires equivalent build | Depends on vendor configuration |
Who Should Use This Template
This template is useful for flooring showroom owners, tile distributors, construction supply companies, installation contractors, sales managers, operations managers, finance analysts, and Power BI consultants who support building material businesses. It is especially useful when the team already has order data but needs a repeatable reporting layer.
It is not the right fit if you need transaction entry, barcode scanning, live inventory sync, invoicing, accounting posting, route optimization, or CRM workflow automation. For those needs, this dashboard can still work as the reporting layer after data is exported from the operational system.
Real-World Use Cases
Monthly business review: A tile distributor reviews revenue, order count, area sold, delivery cost, and gross margin from the Overview page before a leadership meeting.
Sales coaching: A sales manager filters the Sales page and reviews Total Revenue by Sales Rep with gross profit by customer type to identify coaching opportunities.
Fulfillment cost review: An installation coordinator checks delivery cost by region and installation cost by month to understand where operational cost is rising.
Advantages of Flooring and Tiles Dashboard in Power BI
- Fast reporting start: Users begin with ready pages instead of designing every visual from scratch.
- Clear executive cards: The Overview page gives instant visibility into revenue, orders, cost, area, delivery, and margin.
- Cost and margin focus: The report goes beyond revenue and includes material cost, delivery cost, installation cost, and gross profit.
- Interactive filtering: Slicers help users move from total business view to focused analysis quickly.
- Editable Power BI structure: Experienced users can adjust visuals, measures, fields, and data relationships.
Opportunities for Improvement
The dashboard depends on clean source data. If product names, customer types, sales channels, regions, statuses, or month values are inconsistent, users should clean those fields before relying on the visuals.
The report also does not replace a live ERP, point-of-sale system, accounting tool, or inventory platform. Teams that need automated operational workflows can use this Power BI dashboard as a reporting layer after exporting or connecting clean data.
Best Practices
- Keep source field names consistent before refreshing the report.
- Review margin together with revenue so high sales do not hide low profitability.
- Use slicers during monthly meetings to answer region, product, channel, and customer questions quickly.
- Compare delivery cost and installation cost each month to catch operational pressure early.
- Document any custom measures or field changes before sharing the PBIX file with the team.
- Use Microsoft guidance for Power BI Desktop when modifying report connections and visuals: What is Power BI Desktop?
Explore Relevant Templates
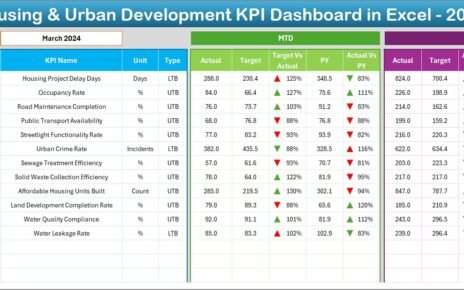
You can review the Flooring and Tiles Dashboard in Power BI on NextGenTemplates. You may also find the Flooring and Tiles Dashboard in Excel, Flooring and Tiles KPI Dashboard in Excel, and Power BI Dashboard Templates useful.
Frequently Asked Questions
What is the Flooring and Tiles Dashboard in Power BI?
It is a ready Power BI dashboard template for tracking flooring and tiles revenue, orders, material cost, area sold, delivery cost, gross margin, sales, products, costs, and fulfillment.
How many pages are included?
The report includes 5 pages: Overview, Sales, Products, Costs, and Fulfillment.
Can I use my own business data?
Yes. You can connect or replace the sample source data if your fields match the report structure.
Does this dashboard need Power BI Desktop?
Yes. Use Power BI Desktop to open, edit, refresh, and customize the PBIX file.
Can I share this report with my team?
Yes, if you publish it through Power BI Service and configure the required permissions and licensing.
Is this a full inventory or ERP system?
No. It is an analytics dashboard. It does not handle live stock updates, invoicing, barcode scanning, or operational workflow automation.
About the Author
Built by PK – Microsoft Certified Professional with 15+ years of Excel, Google Sheets, and Power BI experience. Founder of NextGenTemplates, reaching 300K+ subscribers across YouTube channels. Every template is hand-built and tested before release.
Conclusion
The Flooring and Tiles Dashboard in Power BI gives flooring and tile businesses a practical way to review revenue, orders, costs, products, margin, and fulfillment from one report. Instead of rebuilding reporting every month, teams can start with ready pages and focus on decisions.
Visit our YouTube channel for step-by-step tutorials: Youtube.com/@PKAnExcelExpert.