Leadership development programs are expensive to run and easy to under-measure. HR and learning teams often track attendance, completion, cost, trainer performance, manager feedback, assessment scores, and mentor sessions in different files, which makes leadership readiness difficult to explain in one meeting. The Leadership Development Dashboard in Excel brings those measures into a single refreshable workbook with 5 dashboard pages, 5 executive KPI cards, 21 chart views, slicers, a data sheet, and a support pivot sheet.
This Excel dashboard is designed for HR managers, learning and development teams, leadership coaches, talent management leaders, department heads, and consultants who need a practical way to review training participation, program cost, completion percentage, readiness score, manager rating, assessment lift, trainers, delivery modes, locations, and leadership levels.
Click here to purchase the Leadership Development Dashboard in Excel
Leadership Development Dashboard in Excel
Key Features of Leadership Development Dashboard in Excel
- 5 dashboard pages: Overview, Program Trend, Department View, Readiness, and Participation.
- Executive cards: Total Records, Total Training Hours, Total Program Cost, Avg. Readiness Score, and Avg. Manager Rating.
- Interactive slicers: Filter the report quickly by available program, department, location, trainer, time, leadership level, and enrollment fields.
- Program trend analysis: Review manager rating by delivery mode, assessment lift by program type, cost by department, and completion percentage by month.
- Department and readiness views: Compare assessment lift, locations, leadership levels, trainer ratings, post scores, and department readiness.
- Participation reporting: Track training hours, program cost, manager rating, and mentor sessions across delivery modes, locations, departments, and months.
- Editable data sheet: Replace the sample data in the same structure and refresh the workbook.
- Support pivot sheet: Pivot tables power the dashboard dynamically and can be hidden after setup.
Dashboard Pages Explanation
1 – Overview Page
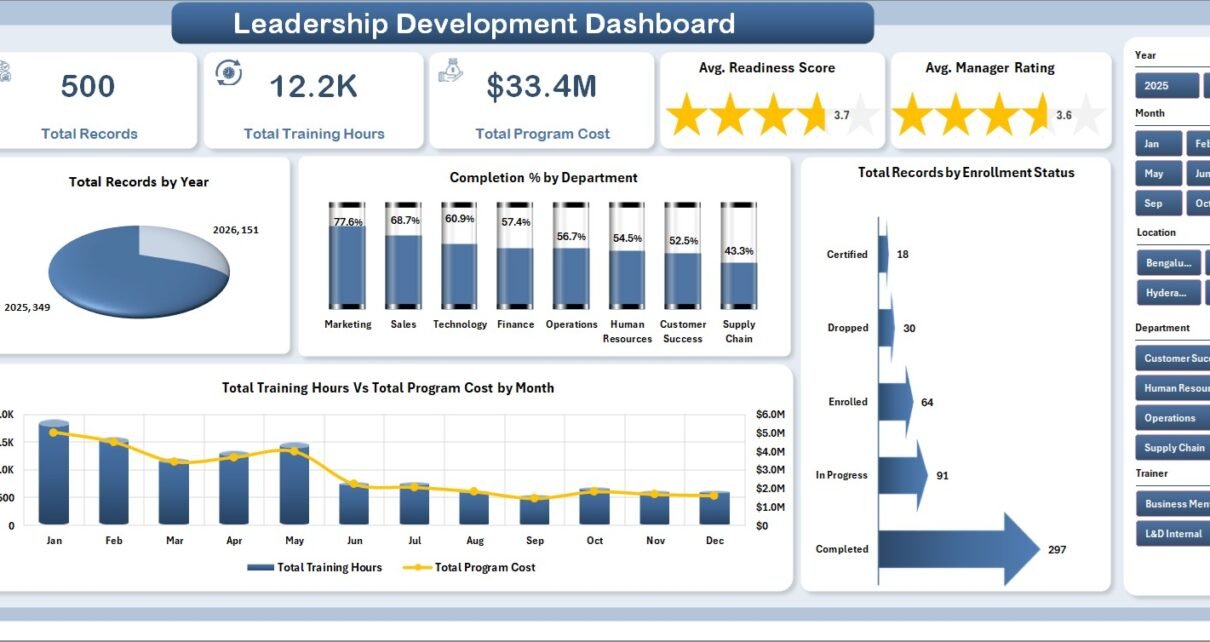
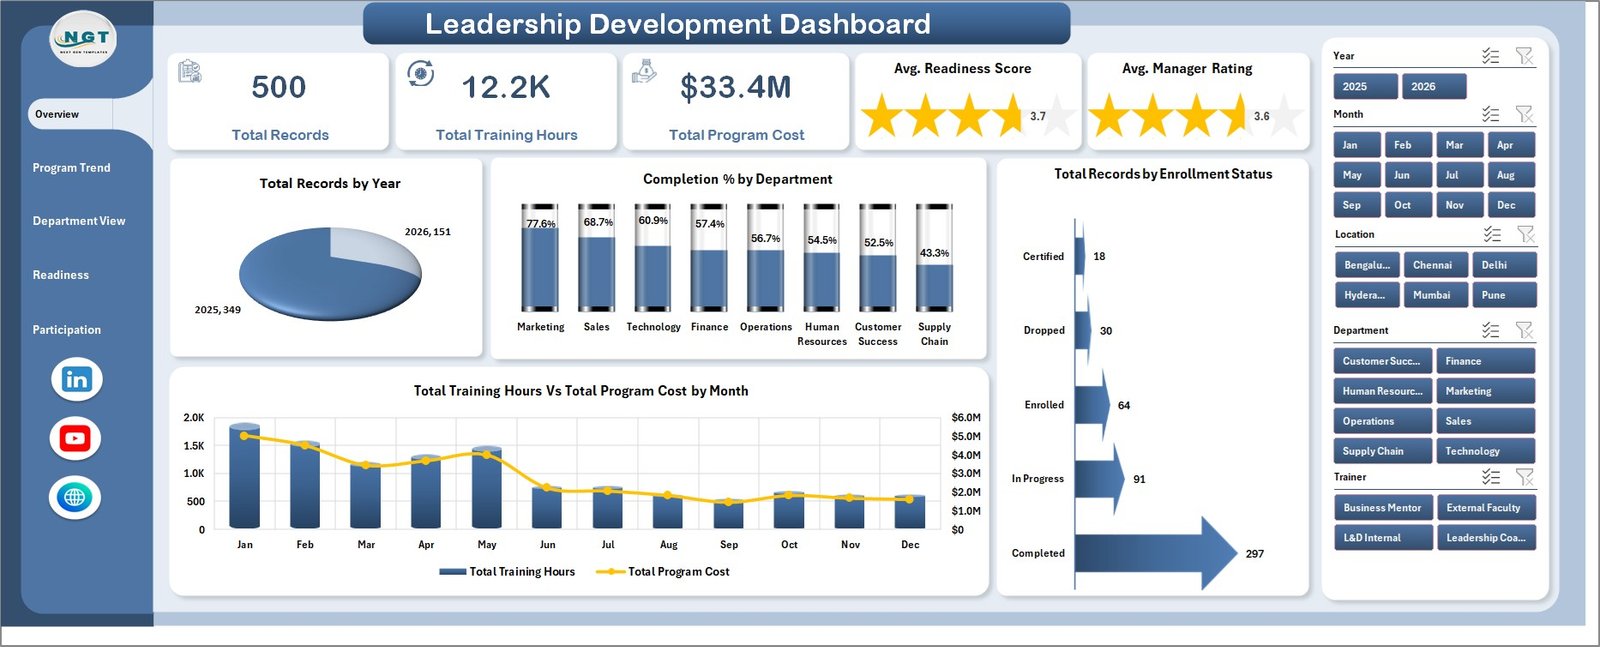
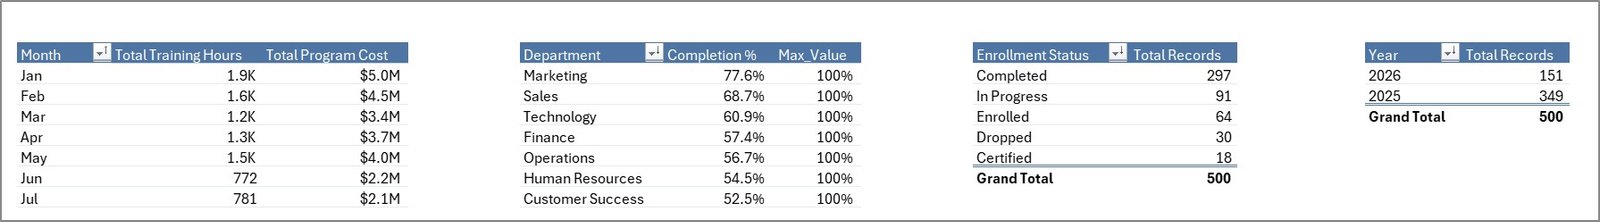
The Overview Page gives leadership a quick summary of the development program. The top cards show Total Records, Total Training Hours, Total Program Cost, Avg. Readiness Score, and Avg. Manager Rating so decision makers can understand participation, investment, perceived quality, and readiness without reading row-level data.
Total Records by Year: This chart shows how many leadership development records exist by year. It helps HR teams see whether program participation is growing, declining, or staying stable.
Completion % by Department: This chart compares completion rates across departments. It helps identify teams where participants may need follow-up, manager support, or schedule adjustments.
Total Records by Enrollment Status: This visual separates records by enrollment status, making it easier to see completed, active, pending, or dropped participation groups.
Total Training Hours Vs Total Program Cost by Month: This chart connects time investment with cost over the months. It helps program managers review whether spending is aligned with training activity.
Overview Page
2 – Program Trend
The Program Trend sheet focuses on how programs perform over delivery mode, program type, department, and month. It is useful for recurring L&D reviews where teams need to see whether the program mix is producing useful outcomes.
Avg. Manager Rating by Delivery Mode: This chart compares manager feedback across delivery formats. It helps teams understand whether classroom, online, blended, or other modes are perceived as stronger.
Assessment Lift by Program Type: This chart shows the improvement between assessment stages by program type. It helps identify the program categories that create the strongest learning lift.
Total Program Cost by Department: This visual compares investment by department. It helps HR and finance teams understand where leadership development budget is being used.
Completion % by Month: This trend shows whether monthly completion is improving or falling. It helps teams detect seasonal dips, capacity pressure, or follow-up needs.
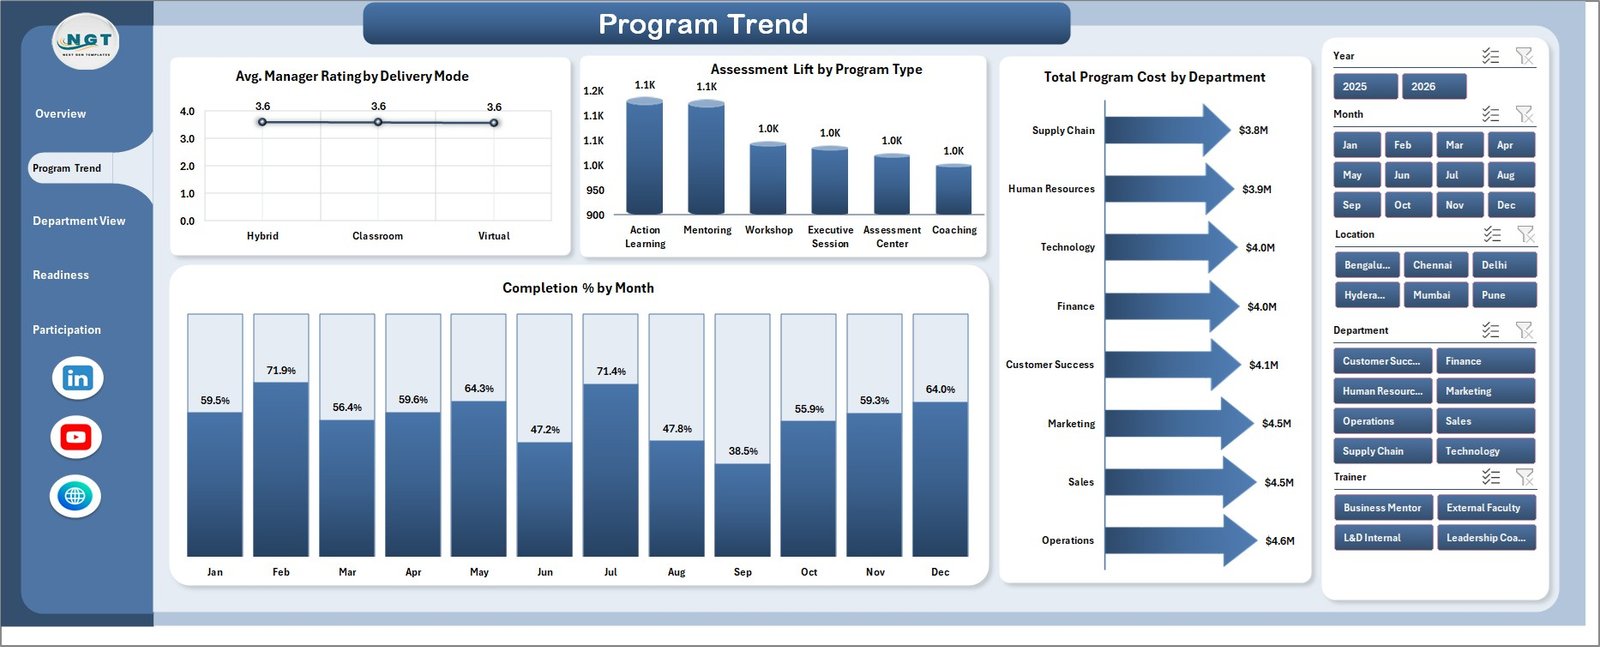
Program Trend
3 – Department View
The Department View page is built for team-level program review. It helps leadership and HR partners compare training outcomes across trainers, locations, departments, and leadership levels.
Assessment Lift by Trainer: This chart compares learning improvement by trainer. It can highlight trainers whose sessions are producing stronger post-program gains.
Total Records by Location: This visual shows where participation records are concentrated. It helps organizations compare program reach across offices, regions, or training locations.
Completion % by Leadership Level: This chart compares completion across leadership levels. It helps identify whether emerging leaders, managers, or senior leaders need different support.
Avg. Readiness Score by Leadership Level: This visual compares readiness by level. It supports succession planning, promotion discussions, and leadership bench review.
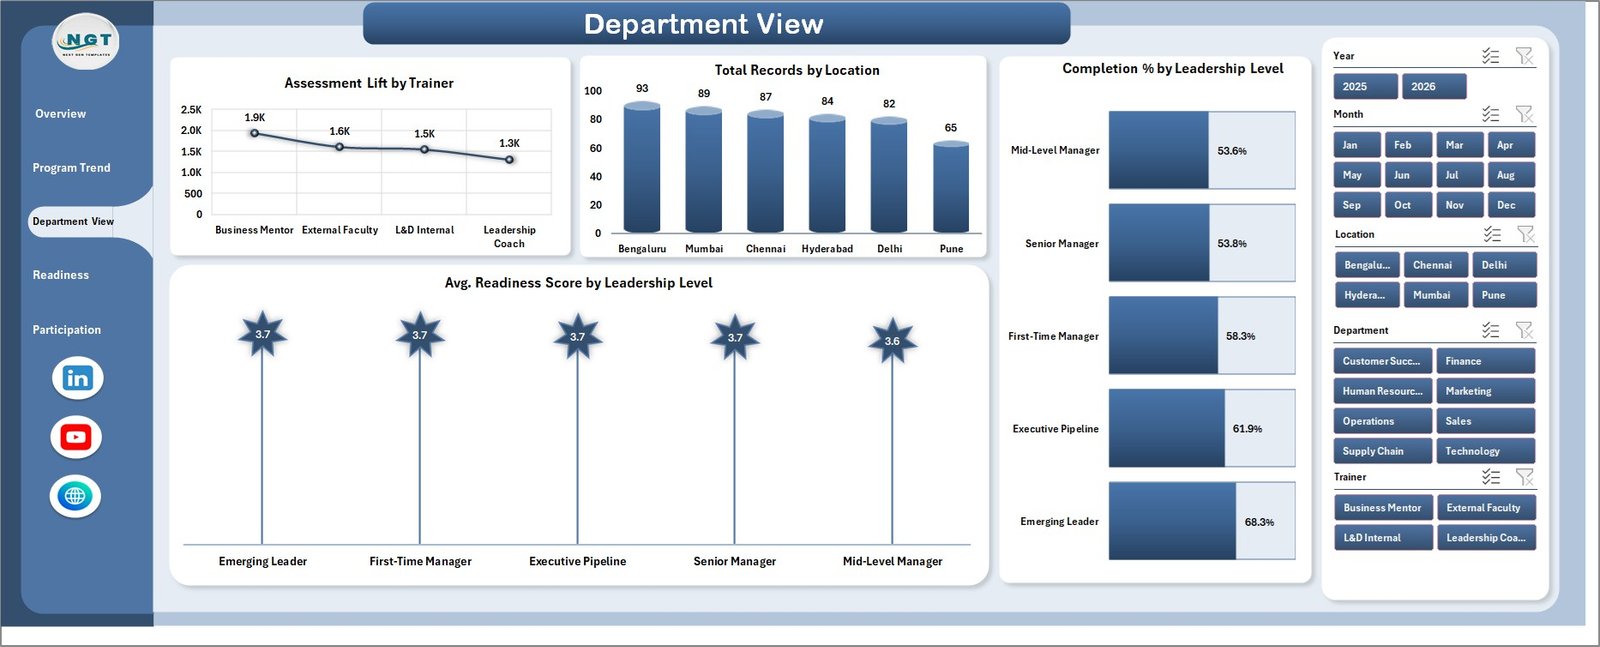
Department View
4 – Readiness
The Readiness page reviews quality, assessment outcomes, completion, and department-level preparedness. It is especially useful before quarterly talent review meetings or leadership pipeline discussions.
Avg. Manager Rating by Trainer: This chart compares trainer performance from a manager-feedback lens. It helps program owners see which trainers are associated with stronger perceived development value.
Avg. Post Score by Program Type: This visual compares final assessment results by program type. It helps identify programs where participants finish with stronger demonstrated knowledge.
Completion % by Program Type: This chart shows whether some program types are easier to complete than others. It can reveal scheduling, content, or engagement issues.
Avg. Readiness Score by Department: This visual compares readiness across departments. It helps HR business partners decide where to focus leadership development follow-up.
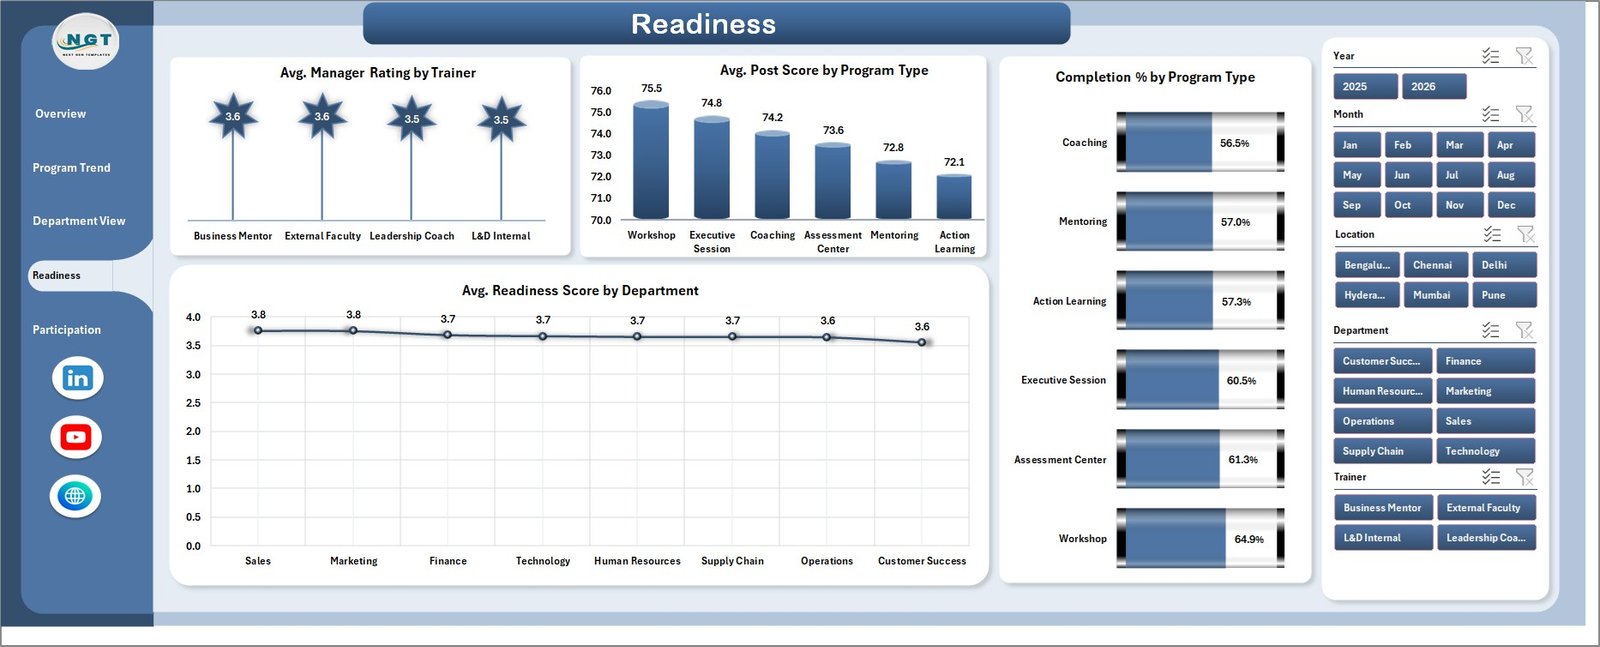
Readiness
5 – Participation
The Participation page focuses on involvement, spend, feedback, and mentoring activity. It helps program owners review whether participants are receiving enough learning time and coaching support.
Total Training Hours by Delivery Mode: This chart shows where training time is being spent across delivery modes. It helps managers understand whether delivery design matches program goals.
Total Program Cost by Location: This visual compares leadership development spend by location. It helps identify higher-cost regions or training centers.
Avg. Manager Rating by Department: This chart compares manager feedback by department. It helps leaders identify where program experience is strongest or where additional support may be needed.
Total Mentor Sessions by Month: This trend shows mentoring activity over time. It helps teams check whether coaching support is consistent during the reporting period.
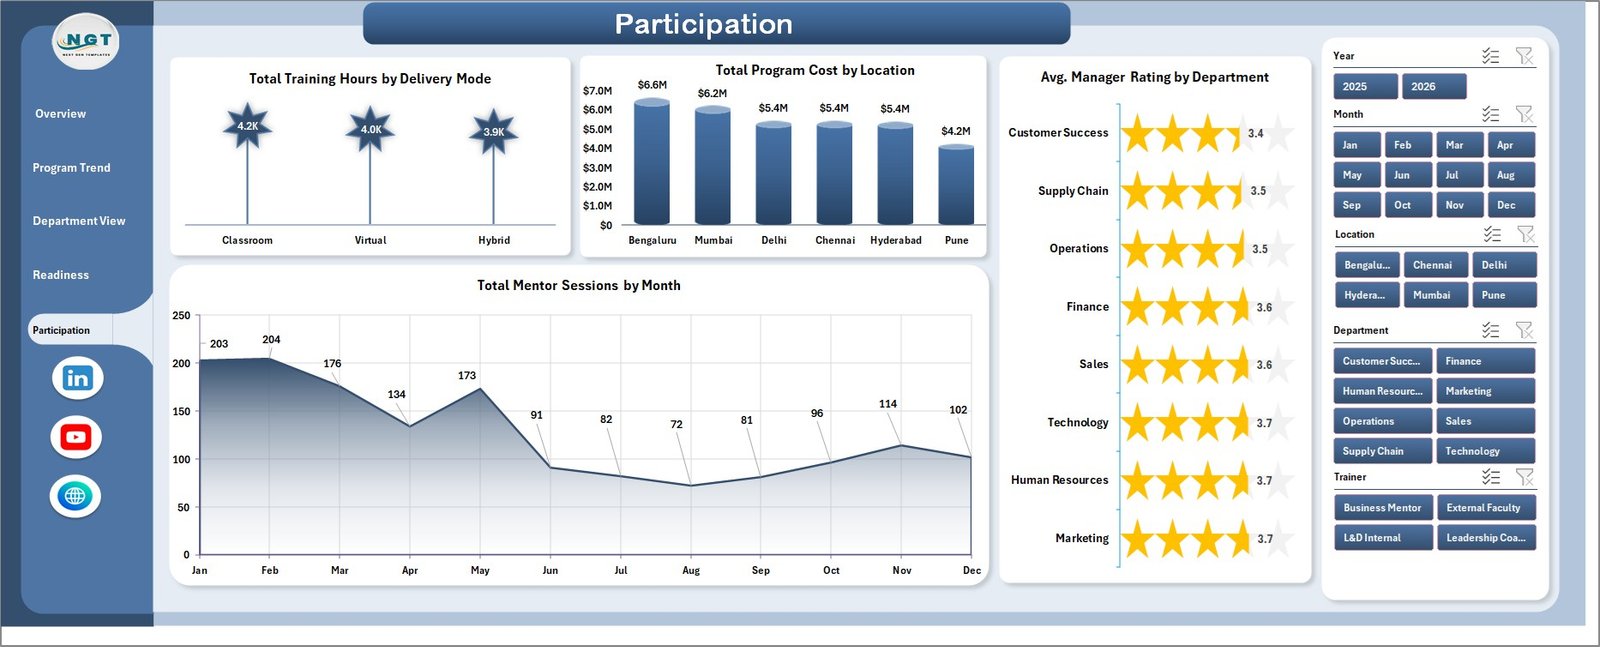
Participation
6 – Data Sheet Tab
The Data Sheet tab is where users add the leadership development records in the same format as the sample data. Once the records are updated, the dashboard can be refreshed so every card, chart, slicer, and pivot-driven view reflects the new dataset.
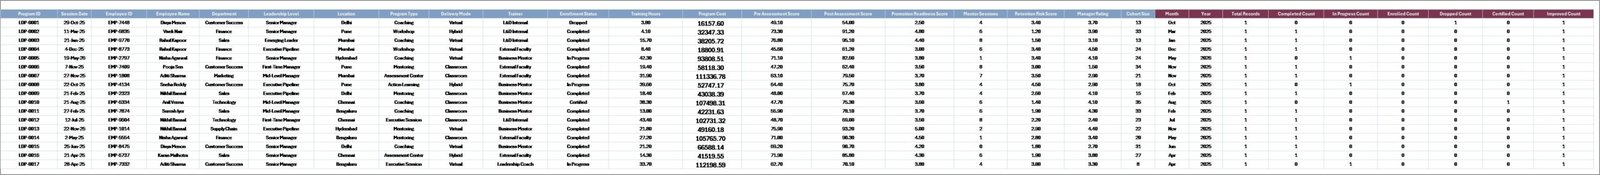
Data Sheet tab
7 – Support Sheet
The Support Sheet contains pivot tables used to create the dashboard dynamically. After updating the Data Sheet tab, go to the Data tab in the Excel Ribbon and click Refresh All. All pivots and related charts will refresh. You can keep this sheet hidden for normal dashboard users.
Support sheet tab
Leadership Development Dashboard in Excel vs. Google Sheets vs. Paid CRM/SaaS – Feature Comparison
| Feature | Leadership Development Dashboard in Excel | Google Sheets alternative | Paid HR SaaS |
|---|---|---|---|
| Cost | $17.99 one-time | Template or manual build cost | Monthly subscription |
| Platform | Microsoft Excel | Google Sheets | Vendor cloud platform |
| Setup time | Open workbook, replace data, refresh | Adapt formulas and charts | Implementation and onboarding |
| Real-time team collaboration | Available through OneDrive or SharePoint | Native collaboration | Usually included |
| Mobile access | Excel mobile or browser if hosted online | Google Sheets mobile | Usually included |
| Customizable fields | Edit sheets, pivots, charts, and slicers | Edit formulas, charts, and tabs | Depends on plan and permissions |
| Share with link | Available through Microsoft 365 sharing | Available through Google sharing | Login controlled |
| Year-1 cost at 5 users | $17.99 plus any Microsoft licensing | Workspace/template cost | Often hundreds or thousands |
| Leadership analytics pages | 5 ready-made pages | Must be built or adapted | Depends on vendor module |
For teams already working in Excel, this template sits between raw spreadsheet tracking and a full HR software implementation. Microsoft also provides useful guidance for working with PivotTables and data refresh in Excel through Microsoft Support.
Who Should Use This Template
- HR managers tracking leadership development participation and readiness.
- Learning and development teams reporting training hours, program cost, and completion.
- Leadership coaches comparing assessment lift, manager ratings, and mentor sessions.
- Department heads reviewing leadership pipeline readiness by team or level.
- Consultants preparing recurring leadership development reports for clients.
Real-World Use Cases
Anita, HR development manager: Anita reviews Overview and Program Trend before quarterly talent meetings to compare completion, training hours, program cost, and manager ratings.
Rahul, leadership coach: Rahul uses assessment lift by trainer and program type to identify which development formats are producing stronger improvements.
Melissa, L&D consultant: Melissa adapts the Data Sheet tab for each client and uses the Readiness and Department View pages to prepare executive summaries.
Advantages of Leadership Development Dashboard in Excel
- It turns scattered leadership development records into a single visual reporting workbook.
- It saves chart-building time for monthly and quarterly L&D reviews.
- It gives executives a quick summary through KPI cards and slicer-driven pages.
- It connects cost, completion, readiness, assessment, trainer, location, and mentoring metrics.
- It can be customized in Excel without committing to a full HR software rollout.
Opportunities for Improvement
This dashboard is a reporting template, not a complete HR system. Advanced users may extend it with Power Query imports, protected input forms, automated refresh workflows, extra slicers, additional calculated fields, or a Power BI version for broader online sharing. Teams needing enrollment workflows, automated reminders, certification rules, or employee self-service should pair this dashboard with an LMS or HRIS.
Best Practices
- Keep department, trainer, location, program type, delivery mode, and leadership level names consistent.
- Update the Data Sheet tab before every monthly or quarterly reporting cycle.
- Click Refresh All after changing the data.
- Check completion, readiness, and manager rating together rather than relying on one metric.
- Keep the Support Sheet hidden for end users but available for workbook maintenance.
Explore Relevant Templates
- Leadership Development Dashboard in Excel
- Leadership Development KPI Dashboard in Excel
- HR Analytics Dashboard in Power BI
- Knowledge Transfer Partnerships Dashboard in Excel
Frequently Asked Questions
What is the Leadership Development Dashboard in Excel?
It is an editable Excel dashboard template for tracking leadership development records, training hours, cost, completion, readiness scores, manager ratings, assessment lift, trainers, departments, locations, and mentor sessions.
How many pages are included?
The workbook includes 5 dashboard pages: Overview, Program Trend, Department View, Readiness, and Participation. It also includes a Data Sheet tab and Support Sheet.
Can I use my own data?
Yes. Replace the sample rows in the Data Sheet tab while keeping the same structure, then click Refresh All in Excel.
Do I need advanced Excel skills?
No advanced skills are required for normal use. Basic Excel knowledge is enough to replace data, refresh the workbook, and use slicers.
Can I customize the dashboard?
Yes. You can edit charts, pivot tables, slicers, colors, headings, and sheet structure in Excel.
Is this a full LMS or HRIS?
No. It is a reporting dashboard, not a learning management system, HRIS, performance review platform, or employee survey tool.
About the Author
Built by PK – Microsoft Certified Professional with 15+ years of Excel, Google Sheets, and Power BI experience. Founder of NextGenTemplates, reaching 300K+ subscribers across YouTube channels. Every template is hand-built and tested before release.
Conclusion
The Leadership Development Dashboard in Excel gives HR and learning teams a clear way to review training participation, cost, completion, readiness, manager rating, assessment lift, trainers, locations, leadership levels, and mentor sessions. Instead of rebuilding charts from scratch, update the Data Sheet tab, refresh the pivots, and use the 5 dashboard pages for leadership development reviews.
Click here to purchase Leadership Development Dashboard in Excel
Visit our YouTube channel for step-by-step Excel, Power BI, and dashboard tutorials.