Loyalty Programs Management Dashboard in Excel is a ready-to-use reporting workbook for teams that need to review member purchases, points earned, rewards, engagement, redemption, retention, and at-risk customers from one structured file. A loyalty program export can quickly grow into hundreds or thousands of rows across program name, tier, customer segment, region, enrollment source, campaign, channel, purchase amount, points earned, reward cost, redemption percentage, engagement percentage, and member status. This dashboard turns that raw data into 5 analysis pages, 5 KPI cards, 20 charts, slicers, a Data Sheet, and a Support Sheet powered by pivot tables.
This template is built for loyalty managers, CRM analysts, retail marketers, e-commerce operators, customer success teams, and consultants who want an Excel-based loyalty reporting tool without starting from a blank workbook.
Click here to purchase the Loyalty Programs Management Dashboard in Excel
Loyalty Programs Management Dashboard in Excel
Key Features of Loyalty Programs Management Dashboard in Excel
- 5 KPI cards: Total Purchase, Total Points Earned, Total Members, Active Members, and Engagement %.
- 5 dashboard pages: Overview, Members, Rewards, Engagement, and Retention.
- 20 pre-built charts: Review loyalty performance by program, tier, month, channel, campaign, segment, region, enrollment source, and quarter.
- Excel slicers: Filter dashboard pages quickly without rebuilding reports or changing formulas.
- Data Sheet tab: Replace the sample rows with your own loyalty program data in the same format.
- Support Sheet tab: Pivot tables drive the dashboard dynamically and can be hidden after setup.
- No macros required: The workbook uses standard Excel sheets, charts, slicers, and pivot tables.
Dashboard Pages Explanation
The workbook includes five dashboard pages plus a Data Sheet and Support Sheet. Each page answers a different loyalty management question: How is the program performing overall? Which members and segments matter most? Are rewards driving useful engagement? Which campaigns create risk or retention value? Where are at-risk members concentrated?
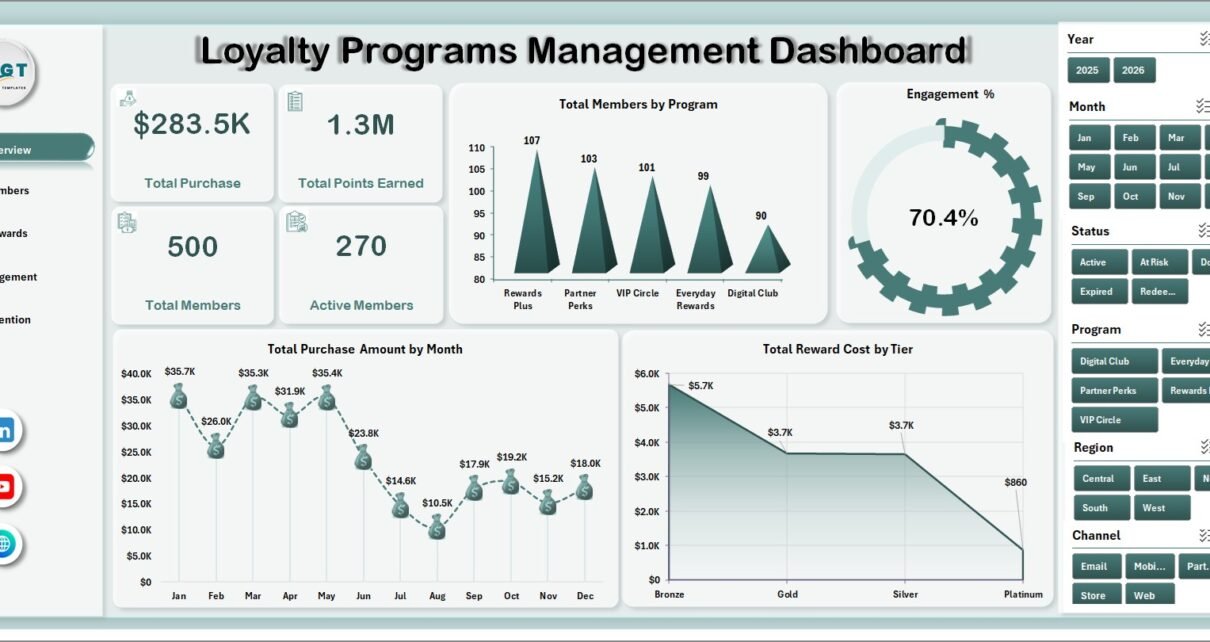
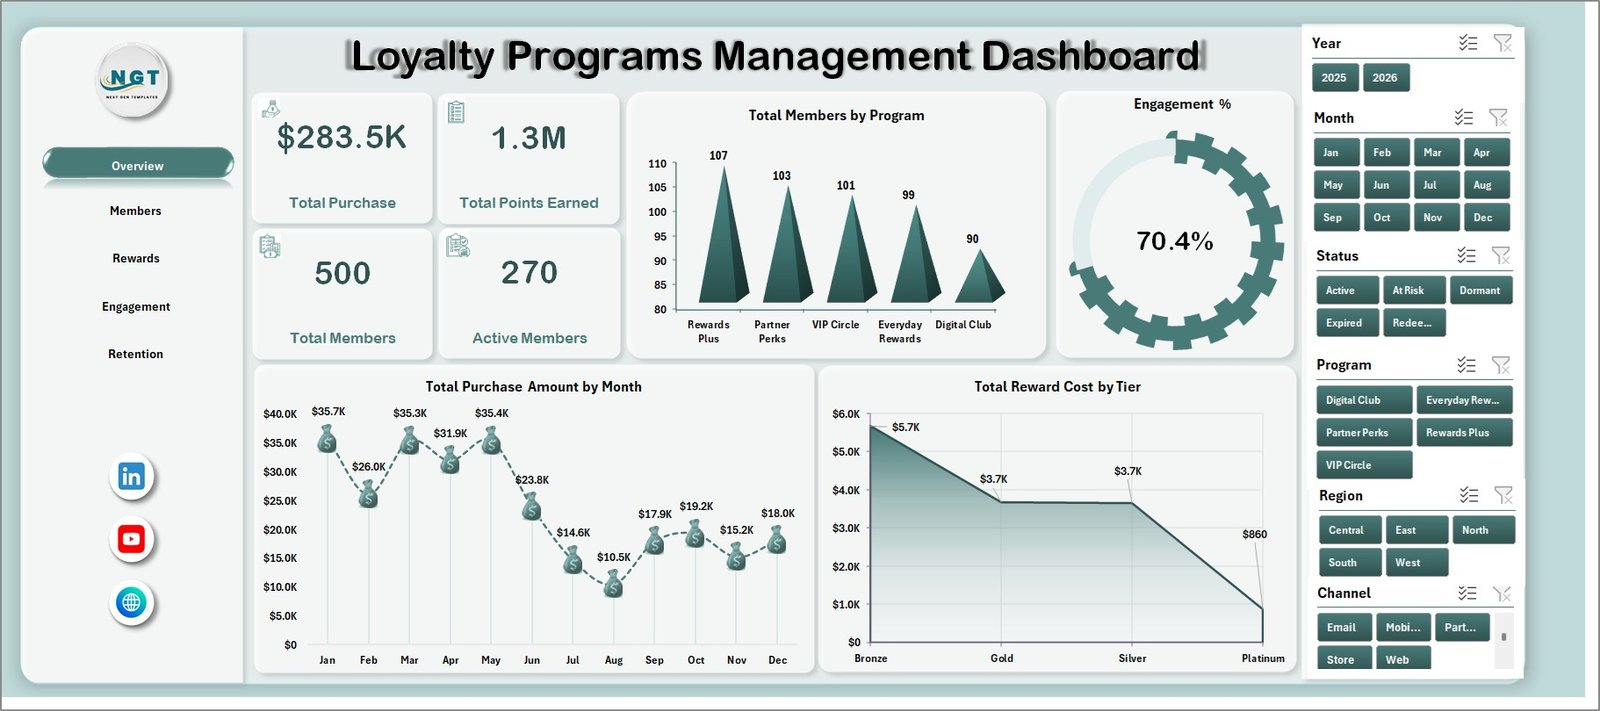
1 – Overview Page
The Overview Page starts with Total Purchase, Total Points Earned, Total Members, Active Members, and Engagement %. These cards give leaders a fast read on loyalty program volume, purchasing value, member activity, and engagement before moving into detailed analysis.
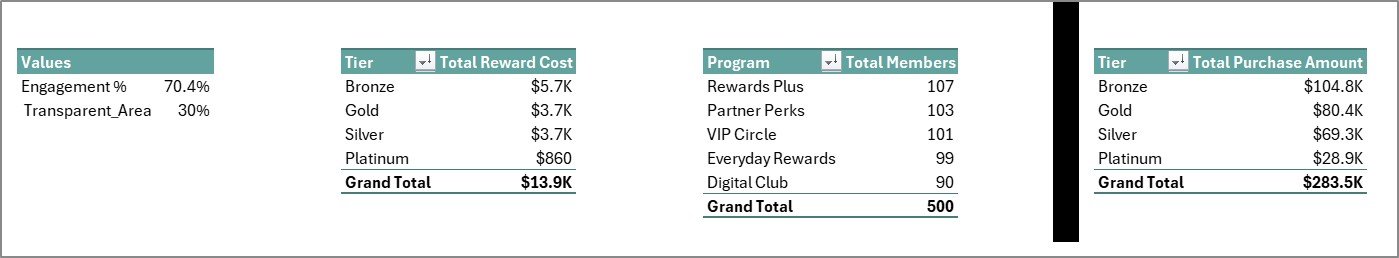
Total Members by Program: This chart compares member count across each loyalty program. It helps teams identify which programs have the strongest adoption and which may need stronger enrollment campaigns.
Total Purchase Amount by Month: This trend shows how loyalty member purchasing changes month by month. It helps marketing teams spot seasonality, campaign impact, and periods where purchase activity is slowing.
Total Reward Cost by Tier: This chart compares reward expense across loyalty tiers. It helps managers check whether premium tiers are creating a healthy balance between customer value and reward cost.
Overview Page
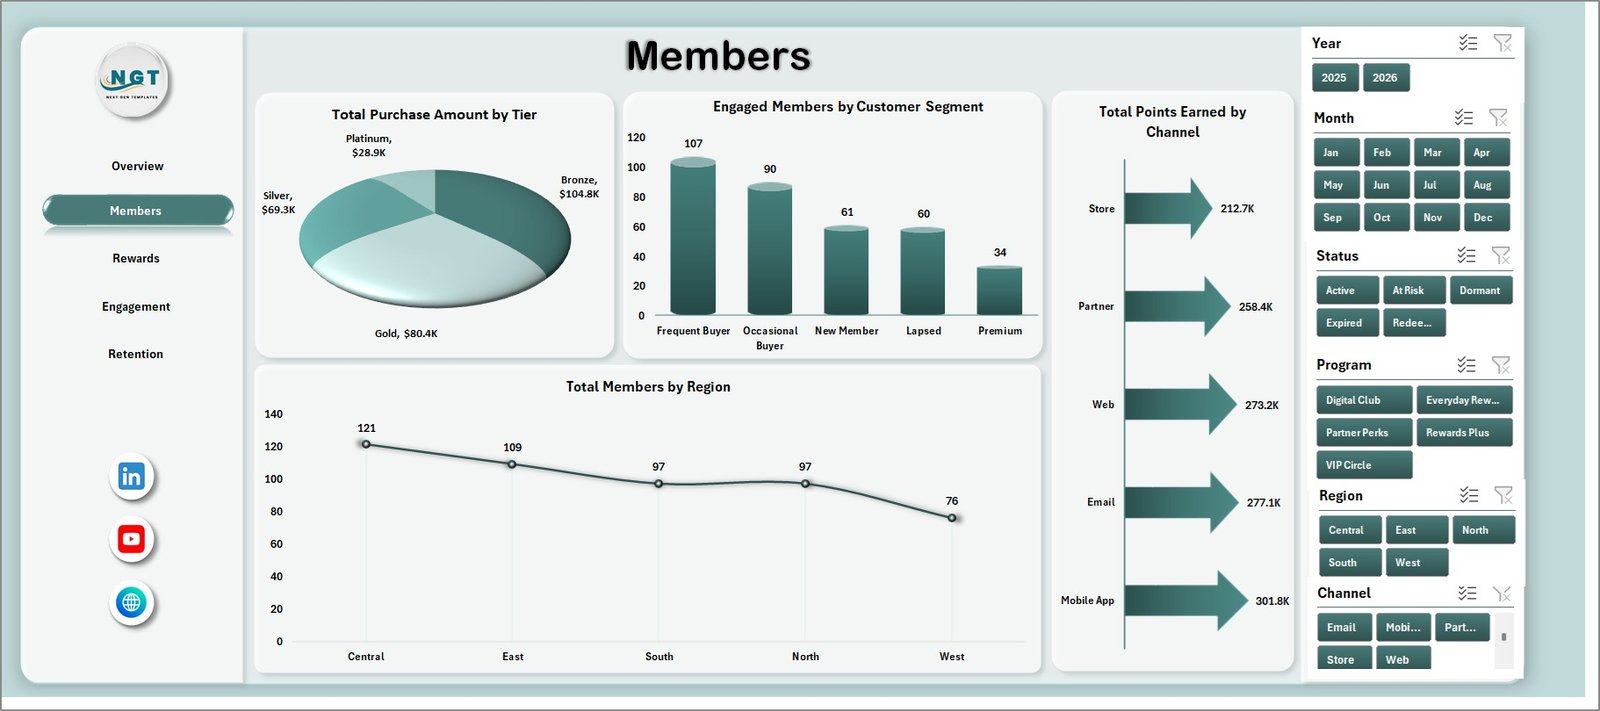
2 – Members
The Members tab focuses on member value, segment behavior, regional distribution, and channel-level point activity.
Total Purchase Amount by Tier: This chart shows which loyalty tiers are contributing the most purchase value. It helps teams compare entry-level, mid-level, and premium member groups in a practical way.
Engaged Members by Customer Segment: This view compares engaged members across customer segments. It helps marketers see whether families, professionals, students, repeat buyers, or other segments are responding to the loyalty program.
Total Members by Region: This chart shows the geographic distribution of members. It supports regional campaign planning and makes it easier to spot under-penetrated locations.
Total Points Earned by Channel: This view explains where loyalty points are being generated. It helps compare store, website, app, referral, email, or other channel activity.
Members
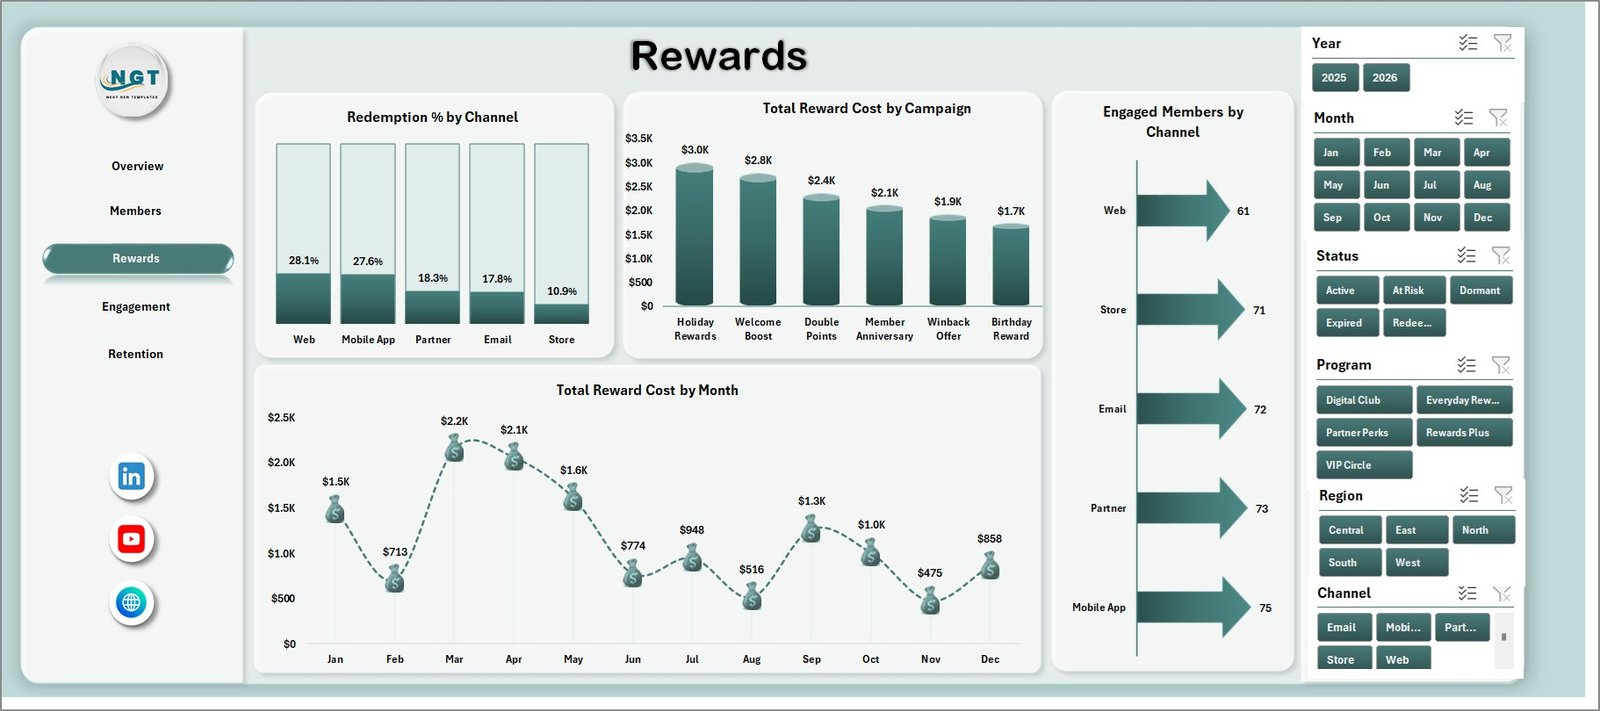
3 – Rewards
The Rewards tab is designed to review redemption behavior, reward spending, campaign cost, and engagement by channel.
Redemption % by Channel: This chart shows where members are most likely to redeem rewards. It helps teams understand whether redemption activity is stronger in digital, store, app, or partner channels.
Total Reward Cost by Campaign: This view compares reward cost by campaign. It helps managers identify expensive campaigns and compare them against engagement outcomes.
Total Reward Cost by Month: This monthly trend shows how reward cost changes over time. It supports budget review and makes sudden cost increases easier to investigate.
Engaged Members by Channel: This chart compares engaged member counts by channel. It helps loyalty teams decide where communication and offer delivery are working best.
Rewards
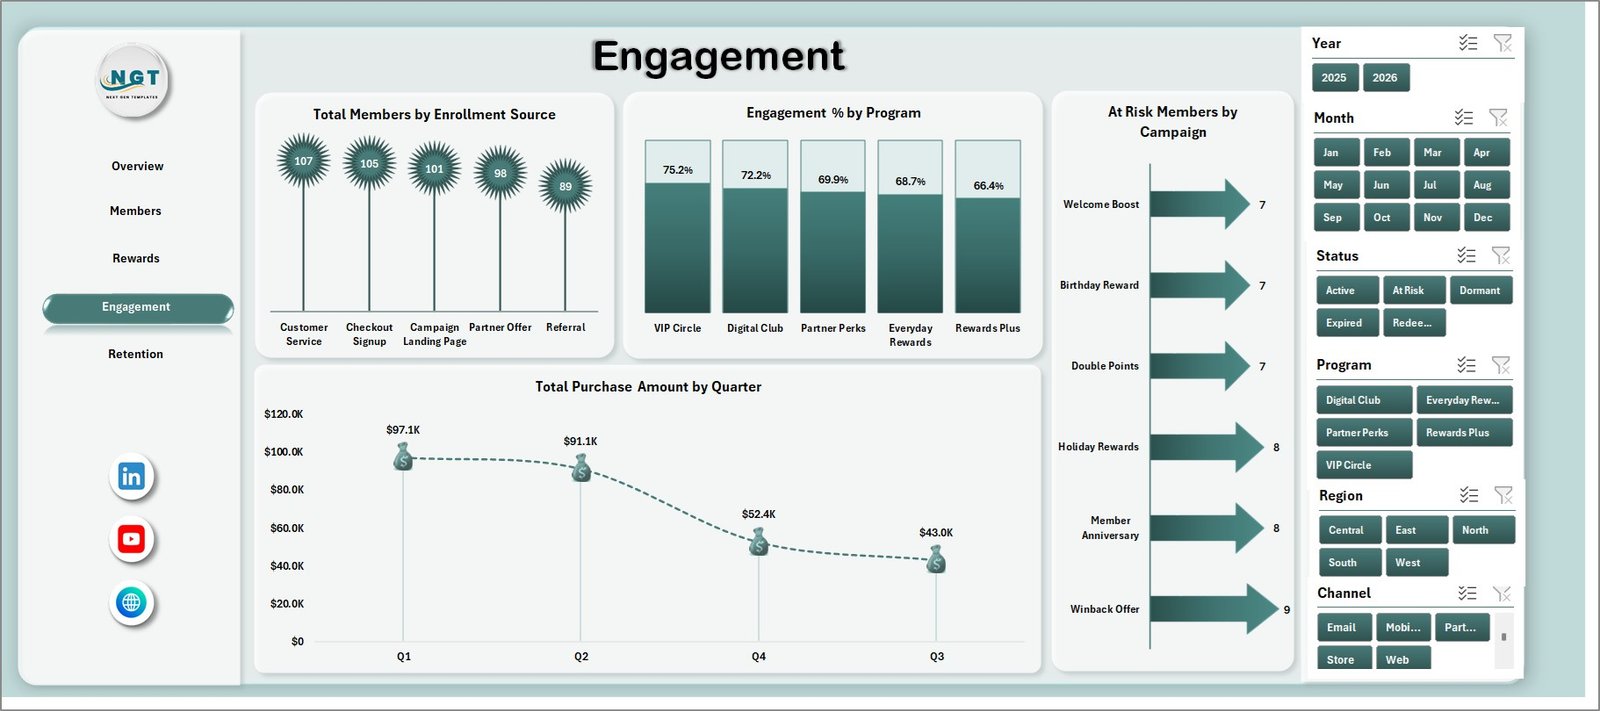
4 – Engagement
The Engagement tab explains how members join, interact, and respond to campaigns over time.
Total Members by Enrollment Source: This chart shows which sources bring in the most members. It helps teams compare referral, store signup, online signup, app signup, paid campaigns, and other acquisition paths.
Engagement % by Program: This view compares engagement rates across programs. It helps identify programs that have member volume but weak participation.
At Risk Members by Campaign: This chart highlights campaigns connected with at-risk members. It helps teams review whether certain offers are attracting low-retention or disengaged groups.
Total Purchase Amount by Quarter: This quarterly trend supports management reviews and budget planning. It helps connect engagement activity with purchase value across the year.
Engagement
5 – Retention
The Retention tab helps teams understand risk, redemption, engagement, and member growth from a retention perspective.
At Risk Members by Customer Segment: This chart shows which segments contain the highest number of at-risk members. It is useful for win-back planning and segment-specific retention offers.
Redemption % by Tier: This view compares redemption rate by loyalty tier. It helps reveal whether higher tiers are using benefits or simply accumulating points.
Engagement % by Region: This chart compares engagement by region. It helps regional managers understand where program adoption is healthy and where local campaigns may need improvement.
Total Members by Month: This trend shows member base movement over time. It helps teams watch growth, stagnation, or decline in the loyalty program.
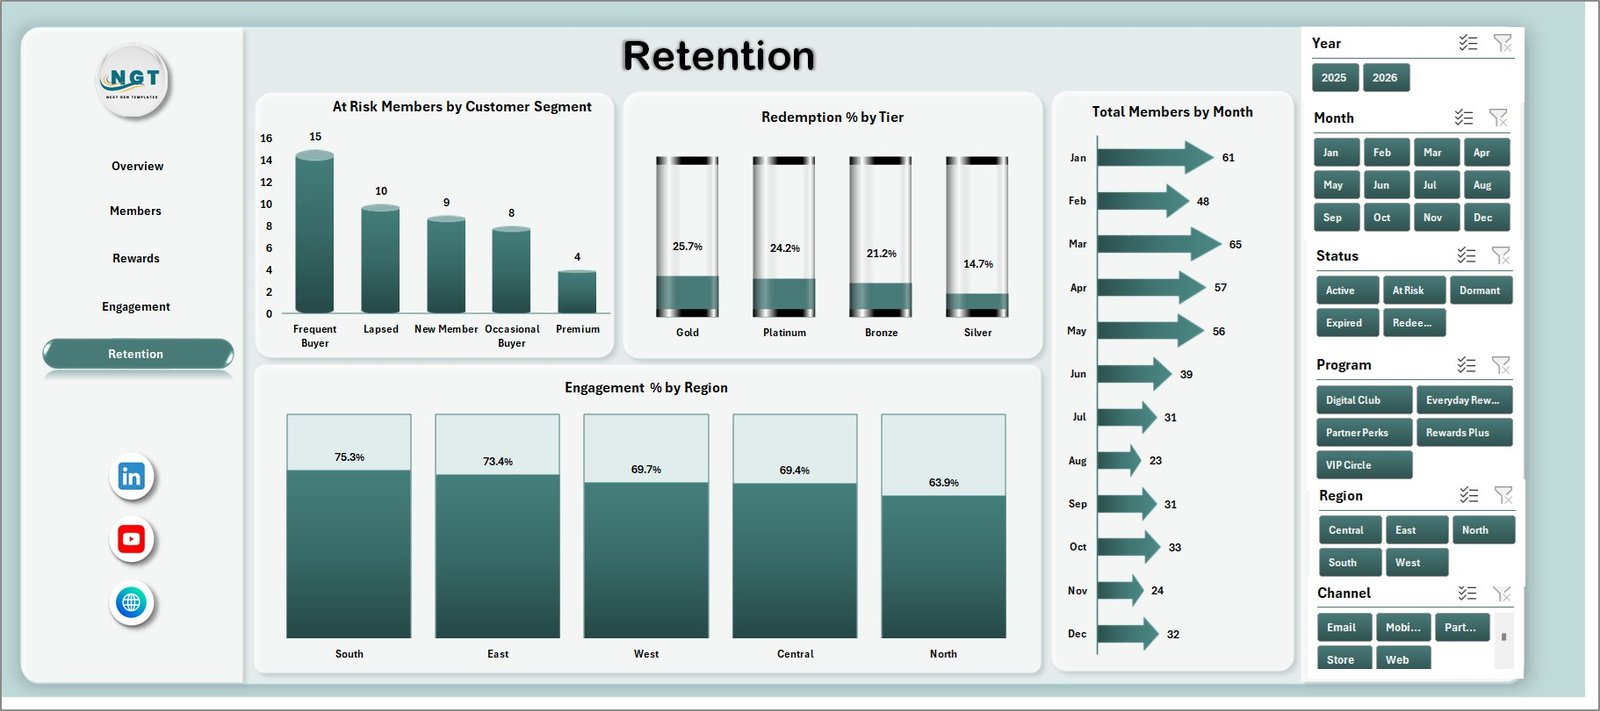
Retention
6 – Data Sheet Tab
The Data Sheet is where users add or replace the source data. Keep the same column structure and format so the pivot tables, slicers, and charts can refresh correctly.

Data Sheet tab
7 – Support Sheet Tab
The Support Sheet contains the pivot tables used to create the entire dashboard dynamically. After updating the Data Sheet, go to the Data tab in the Excel Ribbon and click Refresh All. The pivots and charts refresh together, and this sheet can remain hidden during normal dashboard use.
Support sheet tab
Loyalty Programs Management Dashboard in Excel vs. Google Sheets vs. Paid CRM/SaaS – Feature Comparison
| Feature | Loyalty Programs Management Dashboard in Excel | Google Sheets alternative | Paid CRM/SaaS |
|---|---|---|---|
| Cost | $17.99 one-time | Template cost or manual build | Monthly or annual subscription |
| Platform | Microsoft Excel | Google Sheets in browser | Vendor-hosted platform |
| Setup time | Replace data and refresh | Copy file and adjust formulas | Configuration, integrations, and onboarding |
| Real-time team collaboration | Possible through OneDrive or SharePoint | Native collaboration | Usually included |
| Mobile access | Excel mobile or web for light review | Google Sheets mobile app | Usually included |
| Customizable fields | Editable workbook, charts, and pivots | Editable with permissions | Often limited by plan or admin settings |
| Share with link | Possible through Microsoft 365 | Native share links | Login controlled |
| Year-1 cost at 5 users | $17.99 plus Excel licensing if needed | Low software cost plus setup time | Often hundreds or thousands |
| Loyalty program reporting | Built for members, rewards, engagement, and retention | Must be configured | Depends on CRM module |
Who Should Use This Template
- Loyalty managers reviewing purchase value, points earned, active members, and engagement rate.
- CRM analysts preparing member segmentation, campaign, channel, and retention reporting.
- Retail marketing teams comparing loyalty tiers, regions, enrollment sources, and campaign reward cost.
- E-commerce operators tracking digital loyalty activity without buying a full CRM analytics add-on.
- Consultants building loyalty program reports for clients in Excel.
Real-World Use Cases
Anika, loyalty marketing manager: opens the Overview and Rewards pages before monthly campaign reviews to compare purchases, points, reward cost, redemption, and engaged members by channel.
Rahul, CRM analyst: uses the Members and Retention pages to identify at-risk customer segments and evaluate whether premium tiers are generating enough purchase value.
Maria, retail operations leader: uses the Engagement page to compare enrollment sources and program engagement before deciding where to invest the next promotion budget.
Advantages of Loyalty Programs Management Dashboard in Excel
- It gives loyalty teams a ready reporting structure instead of a blank workbook.
- It connects purchase value, points, reward cost, engagement, redemption, and retention in one file.
- It uses familiar Excel features like pivot tables, charts, slicers, and editable worksheets.
- It can be adjusted by Excel users without waiting for a software vendor.
- It works well for monthly loyalty reviews, CRM reporting, retention planning, and campaign analysis.
Opportunities for Improvement
This is a refresh-based Excel dashboard, so it does not replace a live CRM, coupon engine, customer database, email platform, or automated loyalty app. Larger teams may want to connect Excel to governed data sources, add Power Query transformations, or publish a controlled copy through Microsoft 365. Microsoft explains how PivotTables summarize worksheet data in its documentation: Overview of PivotTables and PivotCharts.
Best Practices
- Keep program, tier, channel, region, campaign, segment, and enrollment source names consistent.
- Validate purchase amount, reward cost, points earned, redemption %, and engagement % before refreshing.
- Refresh the workbook after each data update using Data, then Refresh All.
- Keep a clean backup before changing pivot tables, slicers, or chart fields.
- Hide the Support Sheet when sharing the dashboard with users who only need the analysis pages.
Explore Relevant Templates
You can download this product here: Loyalty Programs Management Dashboard in Excel. You may also like Subscription-based Retail Dashboard in Excel and Cannabis Dispensary Dashboard in Google Sheets.
Frequently Asked Questions
What does the Loyalty Programs Management Dashboard in Excel track?
It tracks purchase amount, points earned, total members, active members, engagement %, reward cost, redemption %, at-risk members, tiers, programs, channels, campaigns, regions, months, and quarters.
How many worksheet tabs are included?
The workbook includes seven tabs: Overview, Members, Rewards, Engagement, Retention, Data Sheet, and Support Sheet.
Do I need macros to use this dashboard?
No. The dashboard uses standard Excel sheets, pivot tables, charts, and slicers.
Can I use my own loyalty program data?
Yes. Replace the sample rows in the Data Sheet with your own loyalty program records while keeping the same column structure.
Can the Support Sheet be hidden?
Yes. The Support Sheet can remain hidden because it mainly stores the pivot tables that power the dashboard.
Is this a live loyalty management system?
No. It is an Excel reporting dashboard, not a CRM, customer database, reward engine, or automated campaign tool.
About the Author
Built by PK – Microsoft Certified Professional with 15+ years of Excel, Google Sheets, and Power BI experience. Founder of NextGenTemplates, reaching 300K+ subscribers across YouTube channels. Every template is hand-built and tested before release.
Conclusion
The Loyalty Programs Management Dashboard in Excel gives loyalty, CRM, retail, and customer success teams a practical way to review member activity from one workbook. Instead of manually rebuilding charts every month, users can update the Data Sheet, click Refresh All, and use slicers to review loyalty performance across members, rewards, engagement, and retention.
Visit our YouTube channel for step-by-step tutorials: Youtube.com/@PK-AnExcelExpert.