Public private partnerships are used to deliver roads, hospitals, schools, utilities, transport networks, civic infrastructure, and long-term public services. These projects often involve large capital values, public funding, private participation, risk allocation, delivery milestones, and multi-year lifecycle cost. When this information sits in disconnected spreadsheets or static reports, leadership teams can lose visibility over delayed projects, agency exposure, project value, milestone completion, and risk score.
The Public Private Partnerships Dashboard in Power BI is built to make that review easier. It gives PPP teams a ready-to-use PBIX report with 5 pages, 5 high-level cards, 16 chart views, and multiple slicers. You can open the file in Power BI Desktop, replace or connect the sample data, refresh the model, and use the report for funding reviews, risk meetings, portfolio reporting, and project delivery discussions.
Click here to purchase Public Private Partnerships Dashboard in Power BI
Public Private Partnerships Dashboard in Power BI
Key Features of Public Private Partnerships Dashboard in Power BI
- 5 report pages – Overview, Funding Mix, Delivery Progress, Risk Compliance, and Project Portfolio.
- 5 executive KPI cards – Total Projects, Public Funding, Project Value, Avg Risk Score, and Delayed Projects.
- Funding analysis – Compare project value by public agency, region, sector, year, and month.
- Milestone tracking – Review planned milestones, achieved milestones, and completion by quarter, region, and sector.
- Risk compliance view – Analyze average risk score by agency and sector, plus private funding by public agency.
- Interactive slicers – Filter report pages quickly during review meetings.
- Editable PBIX file – Customize visuals, relationships, measures, source connections, pages, and colors in Power BI Desktop.
Dashboard Pages Explanation
1. Overview Page
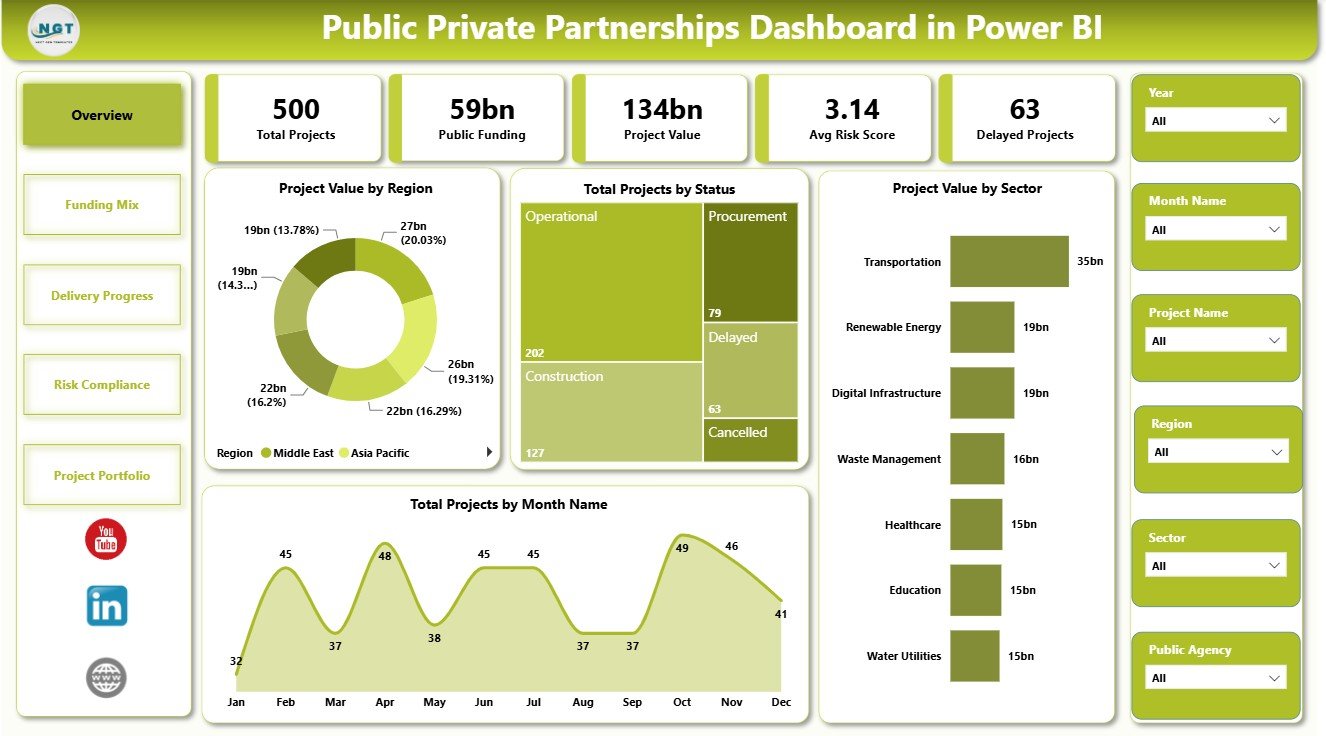
The Overview page is the first page for executive review. At the top, the cards show Total Projects, Public Funding, Project Value, Avg Risk Score, and Delayed Projects. These cards help decision-makers understand the size, funding exposure, risk position, and delivery pressure of the PPP portfolio before moving into detailed analysis.
Project Value by Region shows how PPP value is distributed geographically. It helps users find regions with the largest financial exposure and prioritize detailed review.
Total Projects by Status shows the count of projects by status. It helps teams understand whether the portfolio is mainly planned, active, delayed, completed, or in another lifecycle stage.
Project Value by Sector compares the financial weight of each sector. It is useful for understanding whether transport, healthcare, education, utilities, housing, energy, or other sectors dominate the portfolio.
Total Projects by Month Name shows project count by month. It helps reviewers identify timing patterns and months where project activity is concentrated.
Overview Page
2. Funding Mix
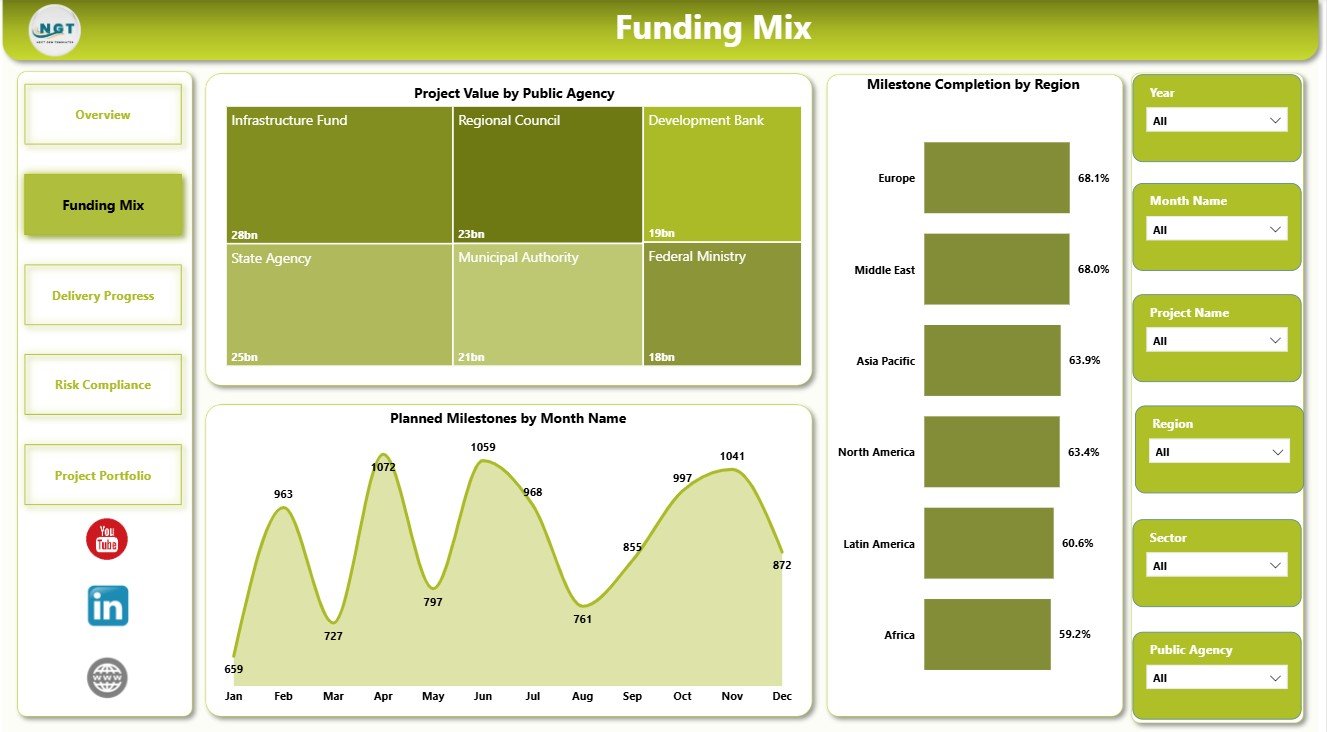
The Funding Mix page focuses on agency funding responsibility, planned milestones, and regional completion. It is useful for public finance teams, PPP units, and project directors who need to compare investment and delivery expectations across agencies and time periods.
Project Value by Public Agency compares total project value by agency. It helps identify which public agencies carry the highest PPP financial responsibility.
Planned Milestones by Month Name shows upcoming milestone workload across months. It helps teams prepare for review cycles, funding checkpoints, and delivery meetings.
Milestone Completion by Region compares progress across regions. It helps leadership identify where execution is on track and where follow-up may be needed.
Funding Mix
3. Delivery Progress
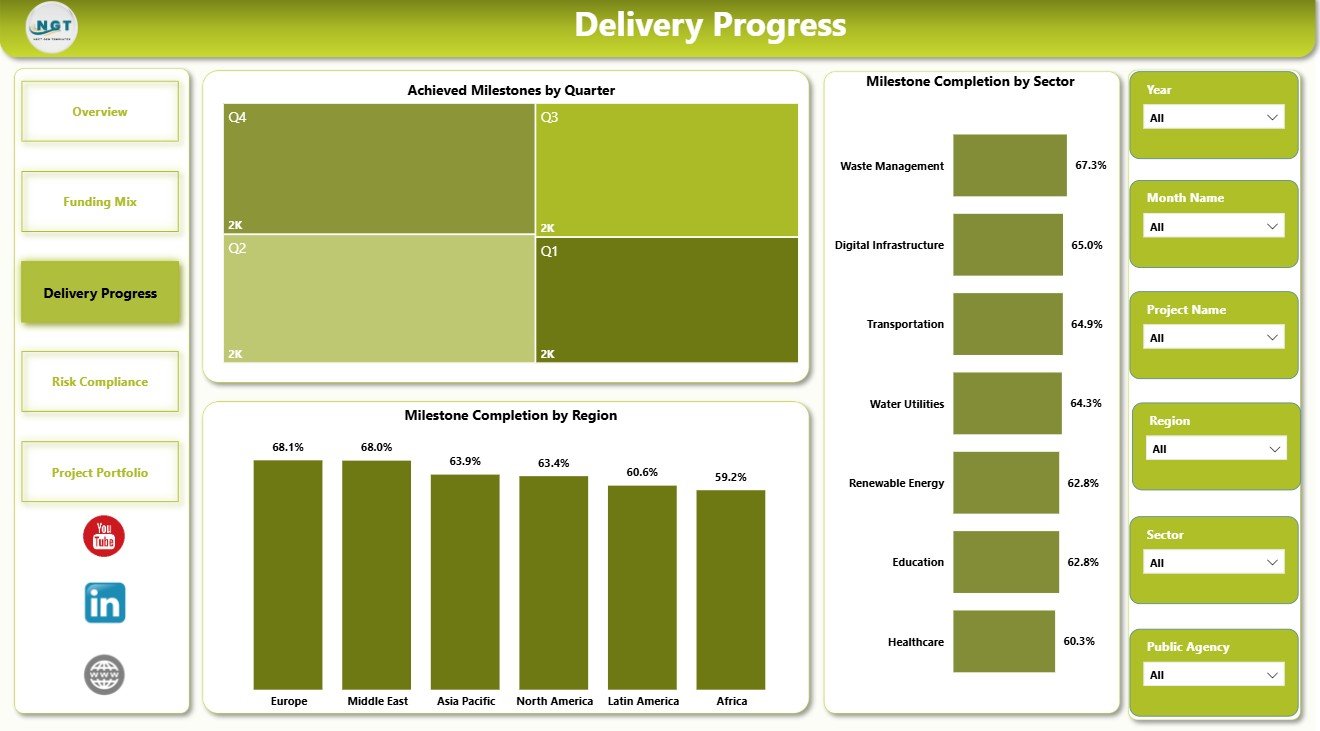
The Delivery Progress page is built for project delivery meetings. It helps teams understand achieved milestones by quarter and compare milestone completion across regions and sectors.
Achieved Milestones by Quarter shows how many milestones were completed across quarterly periods. It helps project leaders compare delivery momentum over time.
Milestone Completion by Region compares regional progress. It is useful for identifying regions where projects are moving well or where escalation may be required.
Milestone Completion by Sector compares progress by PPP sector. It helps teams see whether certain types of projects are consistently easier or harder to deliver.
Delivery Progress
4. Risk Compliance
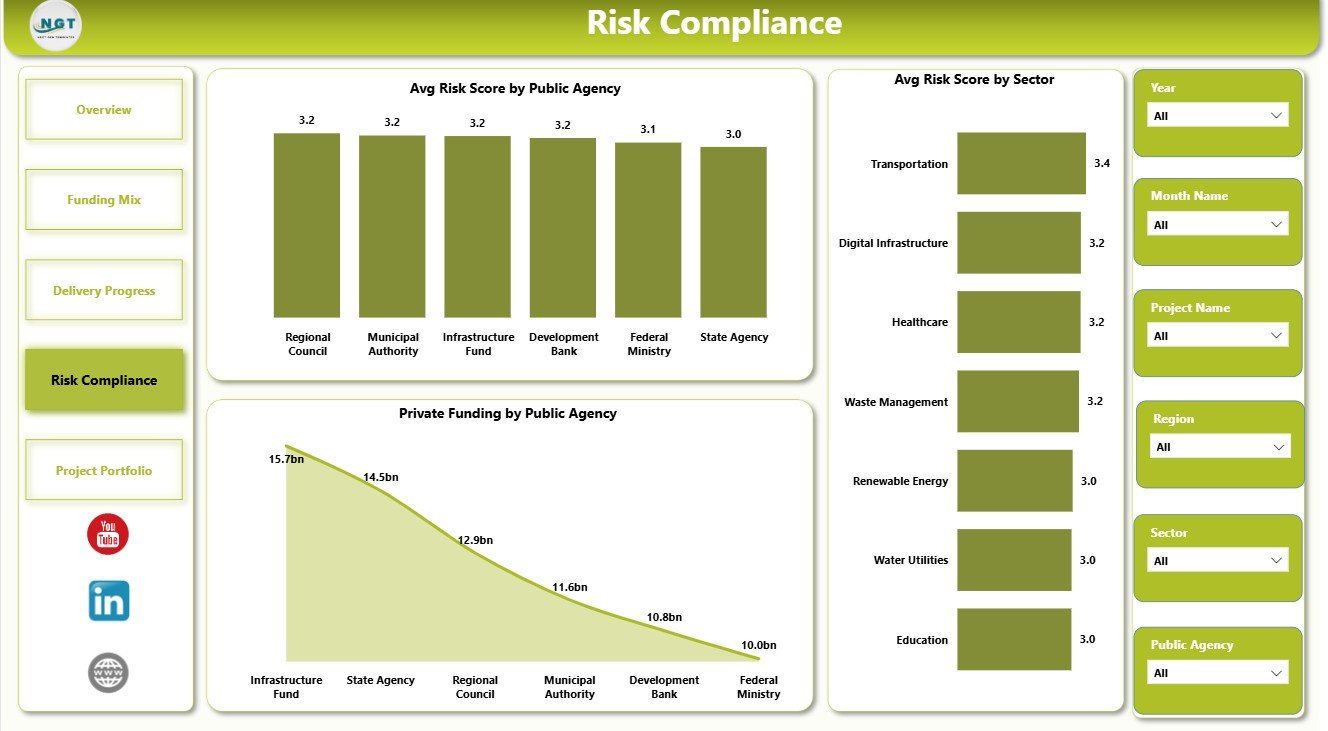
The Risk Compliance page gives governance teams a focused view of risk score and private funding exposure. PPP projects often need regular risk reviews because they combine public accountability, private partner obligations, contract milestones, regulatory conditions, and long delivery timelines.
Avg Risk Score by Public Agency compares average risk levels across agencies. It helps reviewers identify agencies that may need stronger governance attention or project support.
Private Funding by Public Agency compares private funding across agencies. It adds financial context when reviewing risk, concession exposure, and partner responsibility.
Avg Risk Score by Sector compares sector-level risk. It helps users see whether specific sectors carry higher risk than others in the current portfolio.
Risk Compliance
5. Project Portfolio
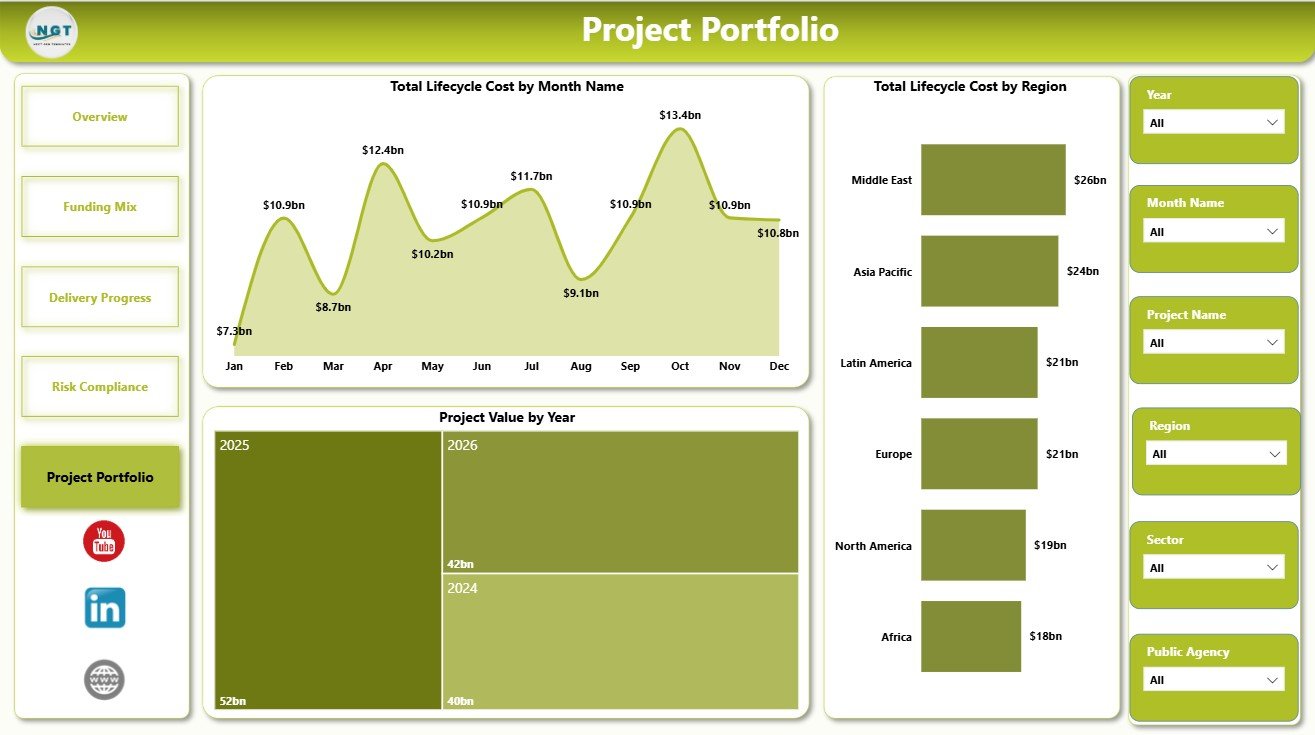
The Project Portfolio page supports long-term portfolio review. It focuses on lifecycle cost, annual project value, and regional cost distribution, which are important for planning, budgeting, and board-level reporting.
Total Lifecycle Cost by Month Name shows lifecycle cost by month. It helps teams understand when long-term cost pressure is concentrated.
Project Value by Year compares project value across years. It is useful for annual planning and investment trend review.
Total Lifecycle Cost by Region compares lifecycle cost across regions. It helps agencies identify where long-term public-private project cost exposure is highest.
Project Portfolio
Public Private Partnerships Dashboard in Power BI vs. Tableau vs. Paid CRM/SaaS – Feature Comparison
| Feature | This Power BI Dashboard | Tableau or Qlik Alternative | Paid Project SaaS |
|---|---|---|---|
| Cost | $17.99 one-time template price | BI license plus build time | Monthly or annual subscription |
| Platform | Power BI Desktop and optional Power BI Service | BI desktop/cloud platform | Vendor cloud platform |
| Setup time | Open PBIX, connect data, refresh | Build or adapt model and visuals | Onboarding and workflow setup |
| Customizable fields | Editable visuals, measures, pages, and source connections | Editable with BI skills | Often limited by plan and permissions |
| PPP reporting fit | Strong for recurring portfolio reporting | Strong if your team already uses that BI tool | Strong for live workflow and approvals |
| Year-1 cost at 5 users | Template cost plus Microsoft licensing choice | Usually higher after licenses and build effort | Often hundreds or thousands per year |
Who Should Use This Template
This template is useful for PPP units, infrastructure agencies, government departments, urban development authorities, transport authorities, public finance teams, PMOs, consultants, and private concession teams. It is also a practical Power BI learning file for analysts who want to model PPP performance using cards, slicers, and multiple report pages.
It may not be enough if your organization needs automated approvals, contract document management, procurement workflows, live ERP integration, or role-based case management. In those situations, the dashboard can still work as a reporting layer or executive pack connected to exported operational data.
Real-World Use Cases
PPP program review: A program director uses the Overview page to explain project count, public funding, project value, risk score, and delayed projects before a steering committee meeting.
Funding review: A finance analyst uses the Funding Mix page to compare public agency exposure and planned milestone workload before budget discussions.
Governance audit: A consultant uses the Risk Compliance page to find public agencies or sectors with higher average risk scores.
Advantages of Public Private Partnerships Dashboard in Power BI
- It centralizes project value, public funding, milestones, risk, delays, lifecycle cost, sectors, regions, and agencies.
- It gives both executive cards and detailed page-level analysis.
- It reduces recurring report-building time for PPP portfolio reviews.
- It works as an editable PBIX file, so analysts can customize the report.
- It supports filtered review through slicers instead of manual chart rebuilding.
Opportunities for Improvement
The dashboard is built for reporting, not live execution. Teams that need document workflows, approval routing, contract change control, automated alerts, or live operational tracking should use a dedicated system and connect its exports to Power BI. Data quality also matters: consistent sector names, agency names, project statuses, and date formats will make the report more reliable.
Best Practices
- Keep source data columns consistent before refreshing the report.
- Standardize region, sector, agency, status, month, quarter, and year values.
- Review slicer selections before presenting final numbers.
- Use Overview for executive meetings and the detailed pages for follow-up analysis.
- Save a backup before changing model relationships, measures, or visuals.
For official platform guidance, see Microsoft Learn: What is Power BI Desktop?.
Explore Relevant Templates
- Risk Management Dashboard in Power BI
- Recycling Infrastructure KPI Dashboard in Power BI
- Private Clubs Dashboard in Power BI
- Power BI templates
Frequently Asked Questions
What is the Public Private Partnerships Dashboard in Power BI?
It is a ready-to-use PBIX dashboard for tracking PPP projects, public funding, project value, risk score, delayed projects, milestones, lifecycle cost, regions, sectors, and public agencies.
How many pages are included?
The report includes 5 pages: Overview, Funding Mix, Delivery Progress, Risk Compliance, and Project Portfolio.
Can I update it with my own data?
Yes. Replace or connect the sample source with your own PPP project records, then refresh the Power BI model.
Do I need advanced DAX skills?
No. You can use the report as delivered. Advanced users can edit measures, relationships, visuals, and report pages if required.
Can I publish it to Power BI Service?
Yes, if your organization uses Power BI Service and your license allows publishing.
Does it replace PPP project management software?
No. It is a reporting dashboard. Live workflows, contract approvals, procurement steps, and document management require dedicated operational software.
About the Author
Built by PK – Microsoft Certified Professional with 15+ years of Excel, Google Sheets, and Power BI experience. Founder of NextGenTemplates, reaching 300K+ subscribers across YouTube channels. Every template is hand-built and tested before release.
Conclusion
The Public Private Partnerships Dashboard in Power BI gives PPP and infrastructure teams a practical way to review project value, public funding, milestones, risk score, delayed projects, sectors, regions, agencies, and lifecycle cost in one interactive report. With 5 pages, executive cards, multiple charts, and slicer-driven filtering, it is built for teams that need faster portfolio reporting without starting from a blank Power BI file.
Click here to purchase Public Private Partnerships Dashboard in Power BI
Visit our YouTube channel to learn step-by-step dashboard tutorials.