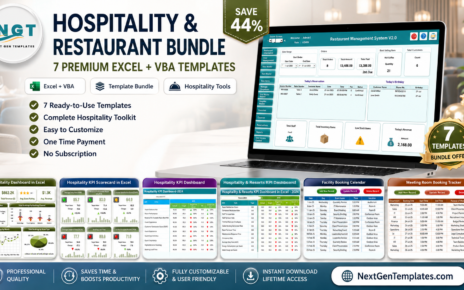
Running modern IT means juggling help-desk tickets, security threats, asset lifecycles, compliance audits, and uptime — usually across half a dozen disconnected spreadsheets. The IT and Cybersecurity Operations Bundle brings all of that into one ready-to-use collection of 8 premium templates spanning Excel and Power BI. Instead of buying each dashboard separately for a combined $117.92, you get the entire toolkit for one discounted price — a saving of roughly 41%. Explore the full range of options on our Dashboard templates and KPI Dashboard collections.
Get the Complete IT & Cybersecurity Operations Bundle
$117.92 $69.99
8 Templates · Excel + Power BI · Save ~41%
🔑 Key Features of the IT and Cybersecurity Operations Bundle
This bundle is built for IT managers, support leads, security analysts, and operations teams who need a single, dependable analytics stack. Here is what makes it stand out:
📊 End-to-end IT coverage — Every major IT function is represented: help-desk ticketing, cybersecurity KPIs, asset management, service delivery, compliance auditing, data center health, and overall operations performance.
🖥️ Two platforms, one toolkit — Six Excel workbooks for offline, subscription-free analysis and two Power BI dashboards for interactive, shareable reporting. Use whichever fits the audience and skill level on your team.
⚡ Plug-and-play setup — Each template ships with sample data and pre-built charts. Replace the sample rows with your own numbers and every visual updates automatically.
🛡️ Security and compliance ready — Track phishing rates, incident response times, audit findings, and remediation progress so you stay audit-ready and resilient.
🔍 Slicers, KPIs, and drill-downs — Filter by department, technician, priority, location, vendor, and date to move from a high-level summary down to a single ticket or asset in seconds.
💰 Massive saving vs buying individually — The eight templates cost $117.92 separately; the bundle is just $69.99.
📦 What’s Inside the IT and Cybersecurity Operations Bundle
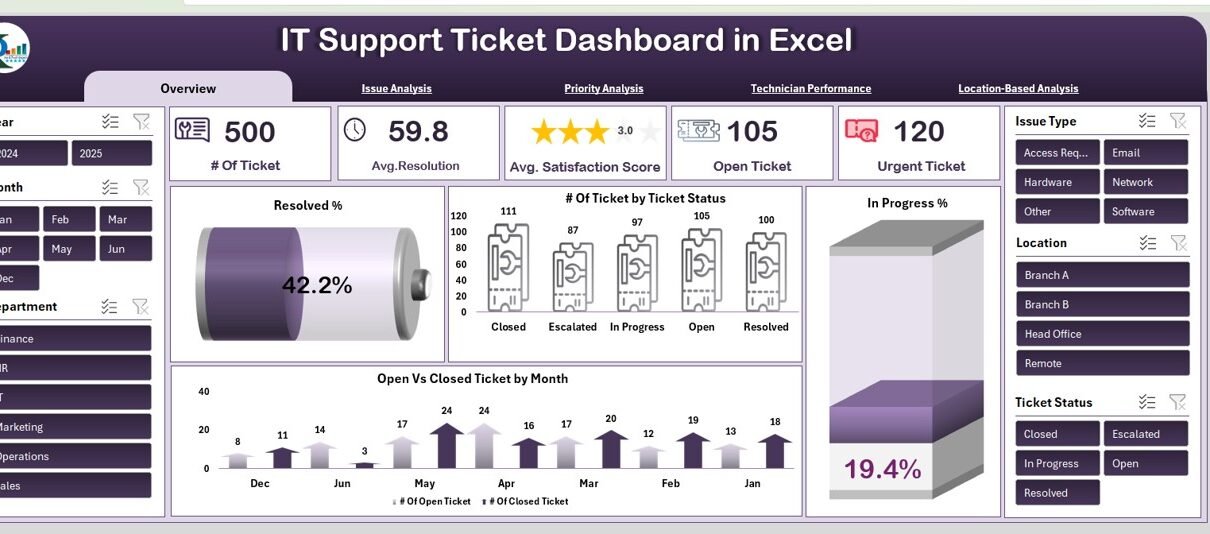
1. IT Support Ticket Dashboard in Excel
A complete help-desk command center that tracks total tickets, average resolution time, satisfaction scores, and open vs urgent items across issue type, priority, technician, and location. Perfect for support managers who want clarity without ITSM licensing costs. View the template »
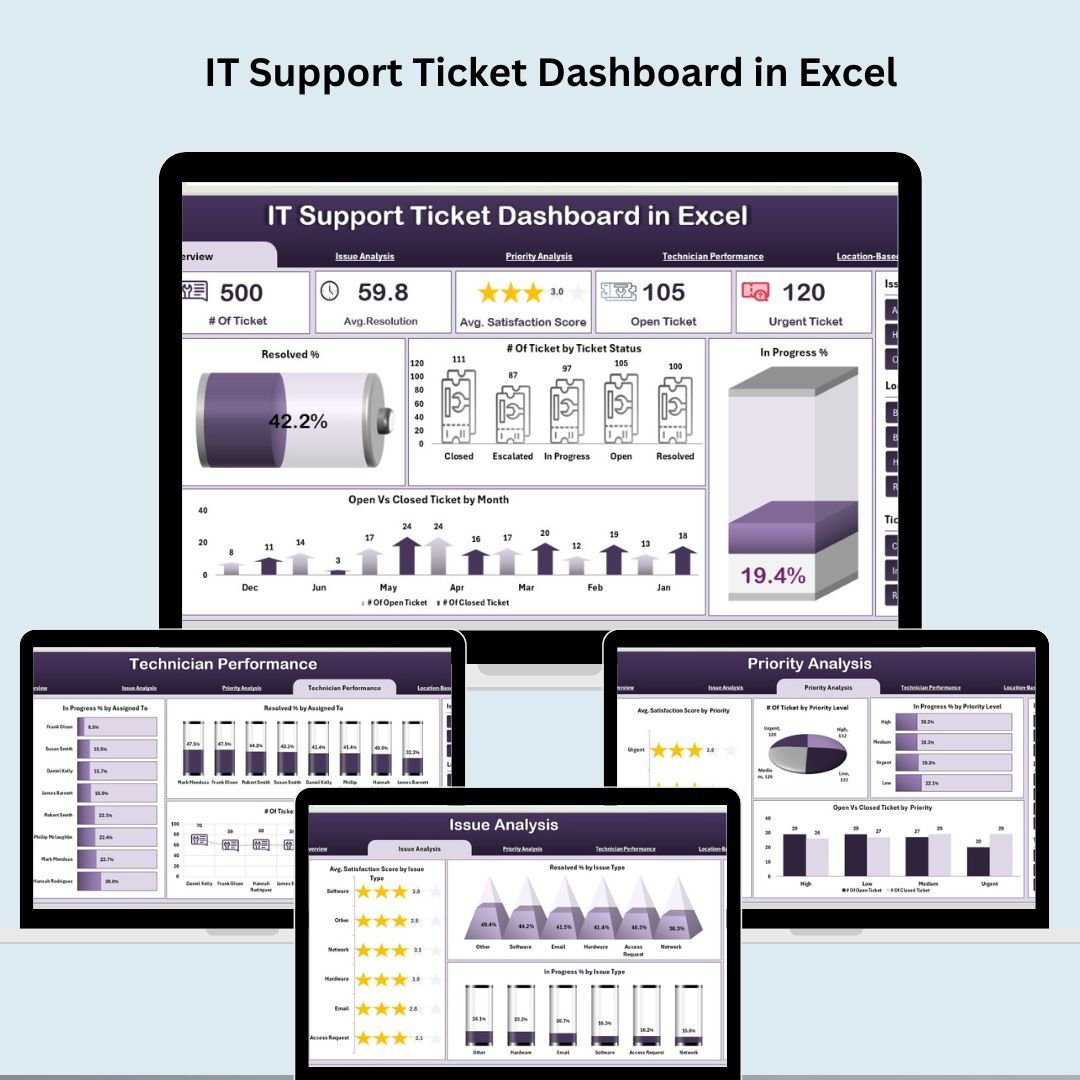
IT Support Ticket Dashboard in Excel
2. Cybersecurity KPI Dashboard in Excel
Monitor your security posture with MTD and YTD views of incident response, phishing click rates, malware infection rates, compliance scores, and risk coverage. Built for CISOs and security teams who need to report performance against targets. View the template »
 Cybersecurity KPI Dashboard in Excel
3. IT Asset Management Dashboard in Power BI
Five interactive pages covering asset type, department, vendor, and monthly trends, with KPI cards for active/inactive assets, net book value, and warranty coverage. Ideal for tracking the full IT asset lifecycle and optimizing spend. View the template »
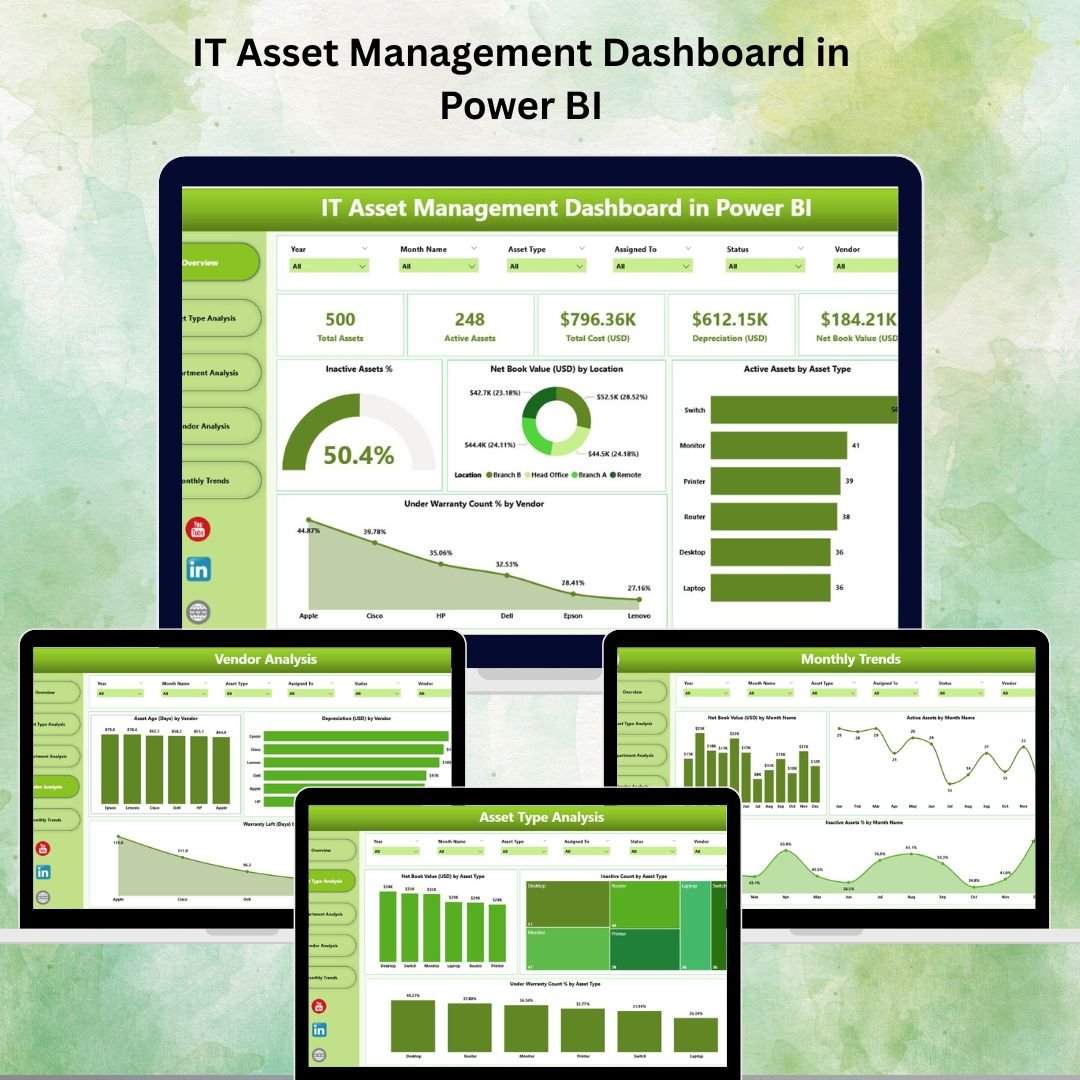 IT Asset Management Dashboard in Power BI
4. IT Services Dashboard in Excel
Track service requests, SLA breach percentages, resolution and response times, technician productivity, and customer experience — all with interactive slicers and rich charts. A cost-effective alternative to heavyweight ITSM platforms. View the template »
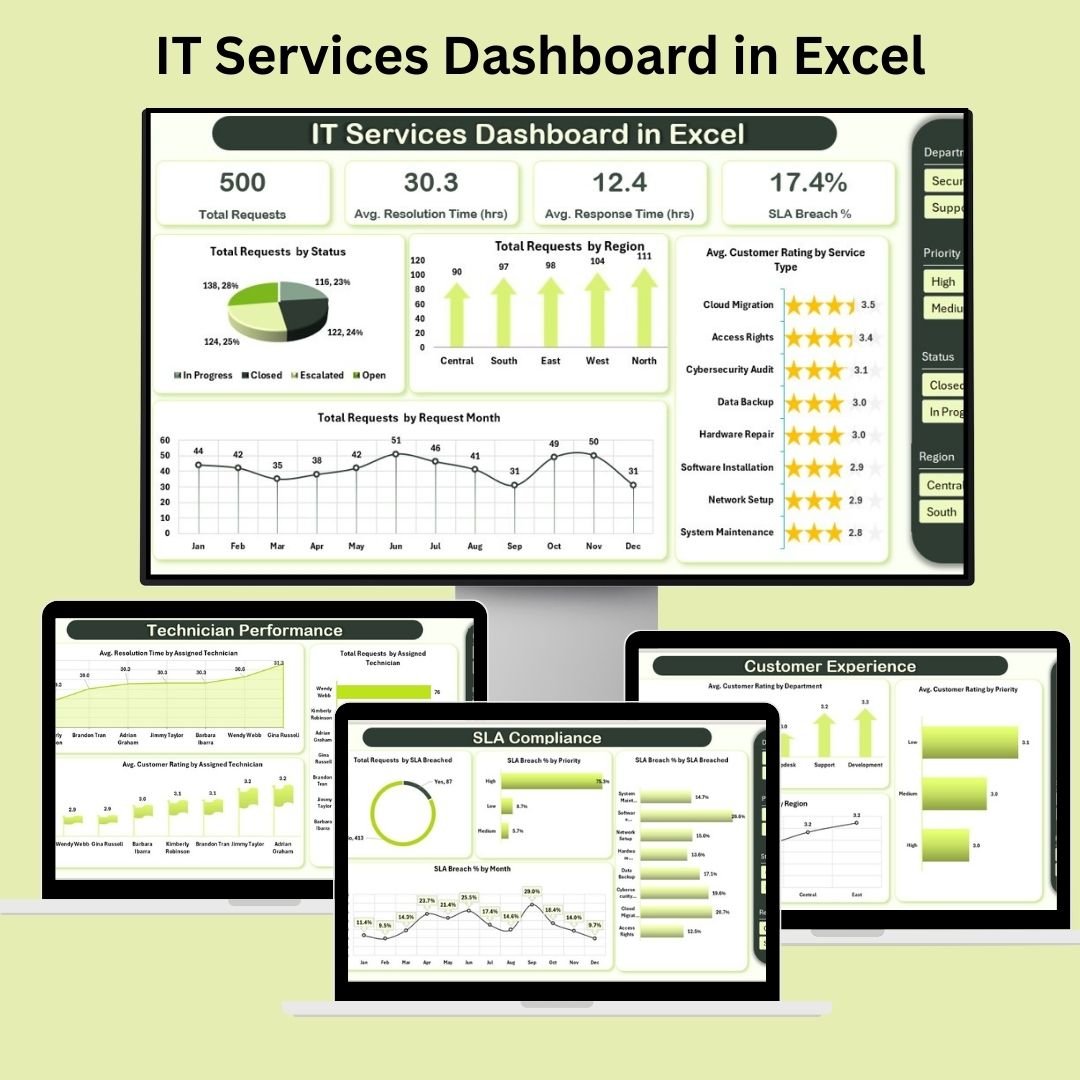 IT Services Dashboard in Excel
5. IT Support Ticket Dashboard in Power BI
The interactive Power BI counterpart to the Excel ticket tracker, with Overview, Issue Analysis, Priority, Technician, Location, and a Decomposition Tree for root-cause analysis. Share live reports with stakeholders via Power BI Service. View the template »
 IT Support Ticket Dashboard in Power BI
6. Compliance Audit Tracker in Excel
A VBA-powered audit command center with secure login, an interactive form for adding and editing records, a live dashboard with slicers and charts, customizable dropdown lists, and user management. Keeps internal and external audits organized and audit-ready. View the template »
7. Data Center KPI Dashboard in Excel
Monitor uptime, power usage effectiveness (PUE), cooling efficiency, resource utilization, and operational costs in real time. Built for data center and facility managers who need to prevent downtime and control spend. View the template »
 Data Center KPI Dashboard in Excel
8. IT Operations KPI Dashboard in Excel
A centralized view of system uptime, network performance, incident response, and service availability so operations teams can spot bottlenecks and make data-driven decisions. Scales from a small server room to enterprise infrastructure. View the template »
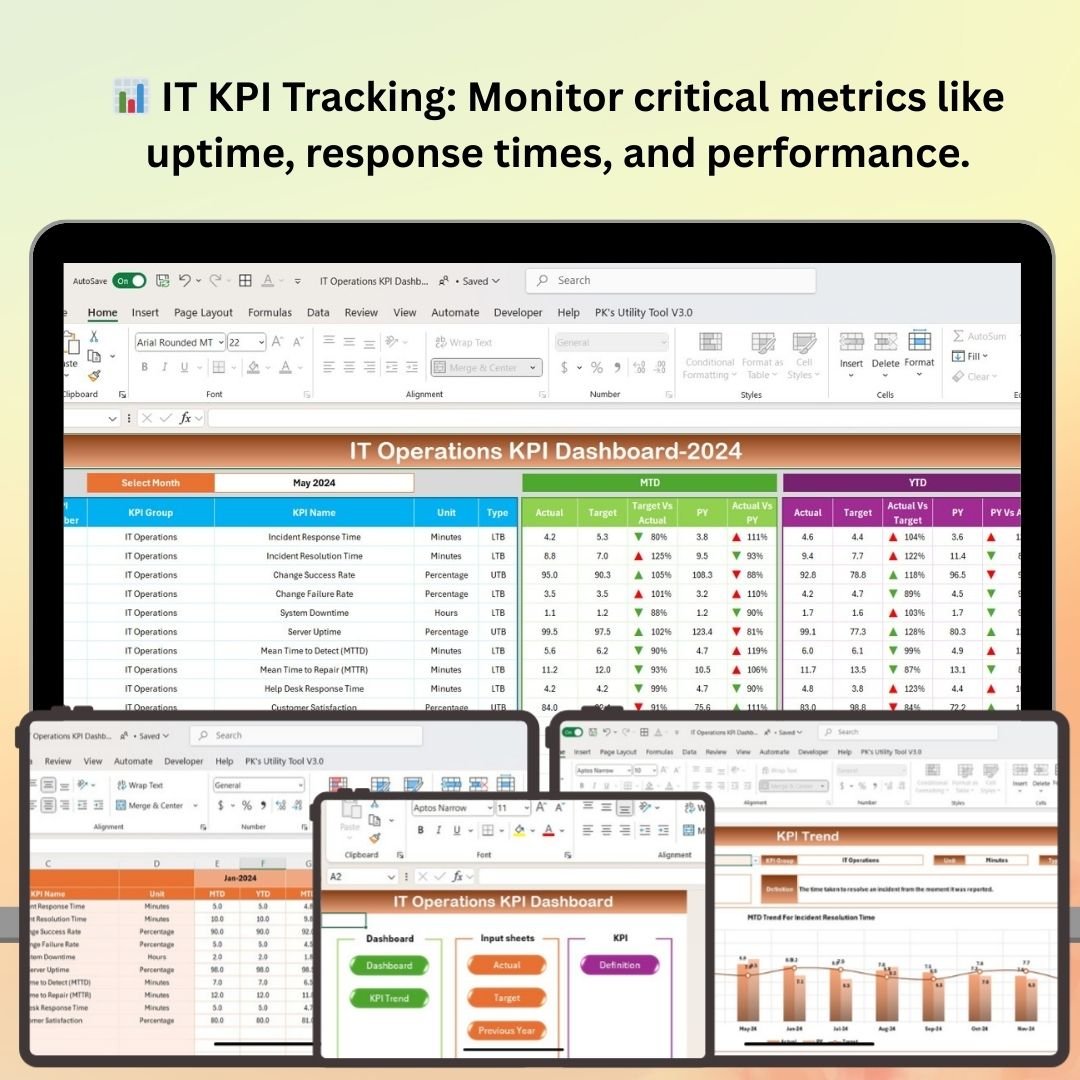 IT Operations KPI Dashboard in Excel
💡 Smart Comparison — Individual vs Bundle
| # | Template | Platform | Individual Price |
|---|---|---|---|
| 1 | IT Support Ticket Dashboard | Excel | $17.99 |
| 2 | Cybersecurity KPI Dashboard | Excel | $12.99 |
| 3 | IT Asset Management Dashboard | Power BI | $17.99 |
| 4 | IT Services Dashboard | Excel | $17.99 |
| 5 | IT Support Ticket Dashboard | Power BI | $17.99 |
| 6 | Compliance Audit Tracker | Excel (VBA) | $6.99 |
| 7 | Data Center KPI Dashboard | Excel | $12.99 |
| 8 | IT Operations KPI Dashboard | Excel | $12.99 |
| Individual Total | $117.92 | ||
| Bundle Price | $69.99 | ||
| You Save | $47.93 (~41%) | ||
🚀 Advantages of Buying the Bundle
One purchase, complete coverage. Rather than evaluating and buying templates one at a time, you get a coordinated IT analytics stack that covers support, security, assets, services, compliance, data center, and operations in a single download.
Consistency across reports. The templates share a common design language, so dashboards look and feel familiar whether you are in Excel or Power BI — making them easier to roll out across teams.
Lower total cost of ownership. Every template is subscription-free. Pay once, use forever, and avoid the recurring fees of large ITSM and security reporting suites.
Faster onboarding. New analysts can start from working dashboards with sample data instead of building from scratch, cutting setup time from days to minutes.
🏆 Best Practices for Deploying the Bundle
Standardize your data entry. Agree on field formats (dates, priorities, departments) before importing, so every dashboard reads cleanly and charts render correctly.
Refresh on a schedule. Update ticket, security, and operations data weekly or monthly to keep KPIs meaningful and trend lines accurate.
Protect your formulas. Lock calculation sheets and support tabs in the Excel files so end users only edit the intended input ranges.
Share securely. Use OneDrive or Teams for the Excel dashboards and Power BI Service for the .pbix files so stakeholders always see the latest view.
Customize gradually. Start with the defaults, then add your own KPIs, branding, and filters once the team is comfortable with the layout.
🔎 Explore More Templates
Looking for more analytics tools? Browse the full Dashboard templates, the KPI Dashboard range, and our VBA Tools for more ready-to-use Excel and Power BI solutions.
❓ Frequently Asked Questions
What software do I need to use this bundle?
The six Excel templates work in Microsoft Excel (desktop or Microsoft 365). The two Power BI dashboards require Power BI Desktop, which is free to download.
Do the templates include sample data?
Yes. Every template comes with sample data and pre-built charts so you can see exactly how it works, then replace the samples with your own numbers.
Can I customize the dashboards?
Absolutely. All templates are fully editable — add KPIs, change colors, apply your branding, and adjust filters to match your environment.
Is this a one-time payment or a subscription?
It is a one-time purchase. You download the files and own them, with no recurring fees.
How much do I save versus buying individually?
Bought separately the eight templates total $117.92. The bundle is $69.99, saving you about $47.93 — roughly 41%.
Who is this bundle best for?
IT managers, help-desk and support leads, security analysts, compliance officers, data center managers, and operations teams who want a complete, affordable IT analytics toolkit.
Ready to Streamline Your IT & Security Reporting?
$117.92 $69.99
8 Premium Templates · Excel + Power BI · Save ~41%
📌 Conclusion
The IT and Cybersecurity Operations Bundle gives IT and security teams everything they need to monitor performance, strengthen their security posture, manage assets, and stay audit-ready — in both Excel and Power BI — for one discounted price. It is the simplest way to equip your team with enterprise-grade analytics without enterprise pricing.