The Digital Asset Custodians Dashboard in Power BI turns one flat custody log into five report pages, 15 KPI cards with month-on-month deltas, 14 charts and tables, and 5 synced slicers on every page. It ships as a standard .pbix project with 500 rows of sample custody records across 21 fields, so it opens finished rather than as a blank canvas.
Before anything else, what this is and is not. It is a reporting file. It does not connect to any blockchain, wallet, exchange, custodian platform or price feed. It holds no keys, signs nothing and moves nothing. Every figure in this article comes from the fictional sample data inside the file, which you are expected to replace with your own export. Nothing here is investment, tax, legal or regulatory advice, and the file carries no audit, licensing, insurance or proof-of-reserves standing.
Custody desks usually keep excellent records and produce awkward reports. Balances live in one export, fee billing in another, the wallet split in a third, and the monthly pack gets rebuilt by hand every cycle. This dashboard exists to collapse that into one refresh.
Key Features of the Digital Asset Custodians Dashboard in Power BI
- Five analysis pages on one model. Overview, Custody Trends, Wallet & Asset Mix, Settlement Operations and Clients & Channels all read the same import table, so the same measure cannot disagree with itself across pages. A hidden Details page is wired as a drillthrough to the underlying custody records.
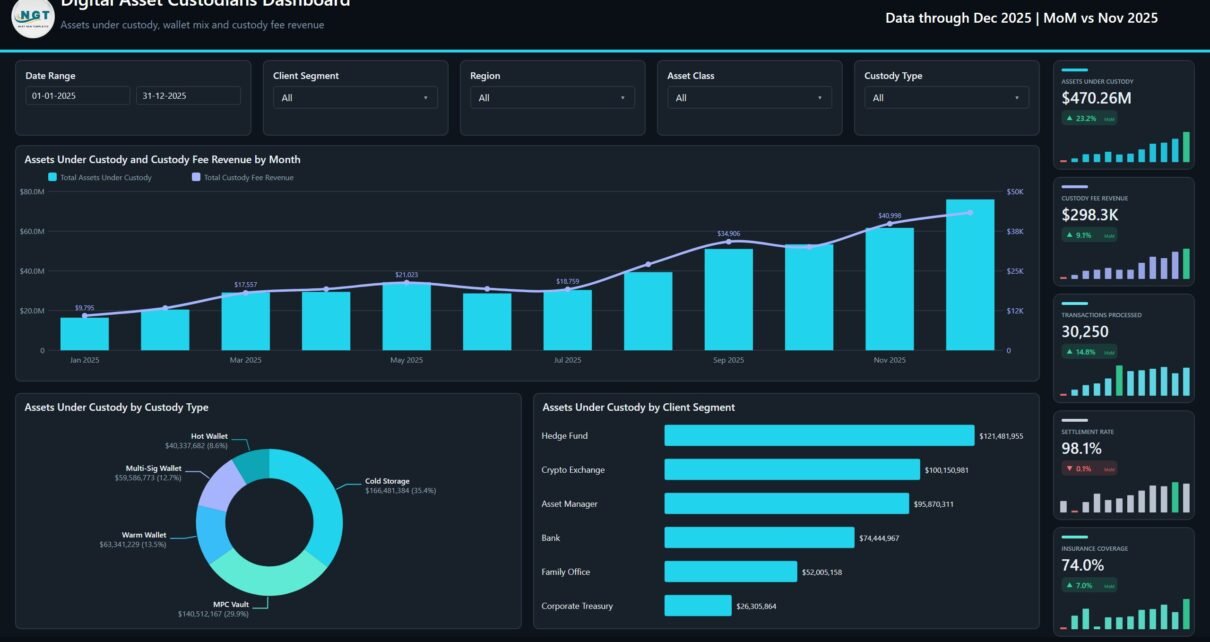
- Fifteen KPI cards, each with a month-on-month delta and a twelve-point sparkline. Assets under custody, custody fee revenue, transactions processed, settlement rate, insurance coverage, deposit value, withdrawal value, total revenue, custody margin, cold storage share, custody accounts, average client tenure, operating cost and average service rating.
- Cold storage share is a first-class measure. It is reported overall and broken down by custody type beside insurance coverage, so a wallet class with a thin cold-storage split shows up instead of being averaged away.
- Operating cost sits beside revenue. Because cost is a real column in the model, custody margin, net custody margin by service tier and cost per transaction by client segment are calculated figures rather than estimates.
- Five synced slicers per page. Date Range, Client Segment, Region and Asset Class appear on every page, with a fifth that suits the page: Custody Type on Overview, Service Tier on Trends and Wallet Mix, Account Status on Settlement, Onboarding Channel on Clients.
- Twenty-one renameable fields covering segment, region, asset class, custody type, service tier, onboarding channel, account status, balances, insured and cold storage value, deposits, withdrawals, fee and staking revenue, operating cost, transaction counts, tenure and service rating.
- A plain Power BI project. No custom visuals, no external dependencies and no gateway – it opens in Power BI Desktop, which Microsoft provides free of charge.
Dashboard Pages Explanation
Overview
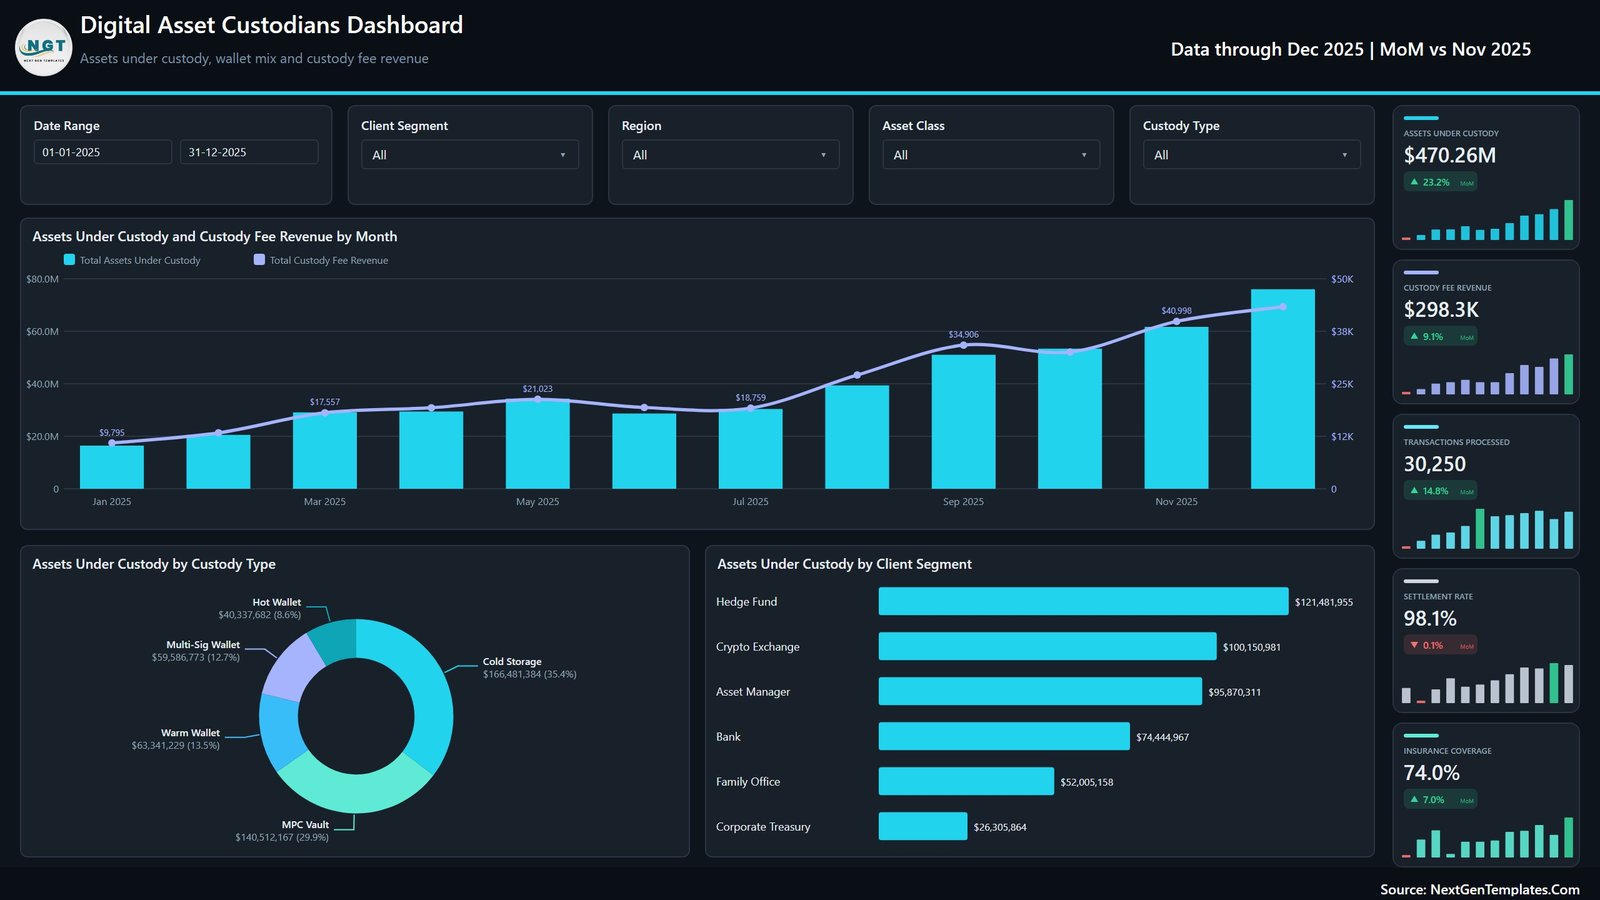
The headline page. Its KPI rail reads assets under custody $470.26M, custody fee revenue $298.3K, transactions processed 30,250, settlement rate 98.1% and insurance coverage 74.0%, each with its month-on-month change. Assets Under Custody and Custody Fee Revenue by Month puts fee revenue as a line over balance columns, so a month where balances grew but fees did not is obvious. Assets Under Custody by Custody Type splits the book across Cold Storage $166.5M (35.4%), MPC Vault $140.5M (29.9%), Warm Wallet $63.3M (13.5%), Multi-Sig Wallet $59.6M (12.7%) and Hot Wallet $40.3M (8.6%). Assets Under Custody by Client Segment ranks Hedge Fund $121.5M, Crypto Exchange $100.2M, Asset Manager $95.9M, Bank $74.4M, Family Office $52.0M and Corporate Treasury $26.3M.
Custody Trends
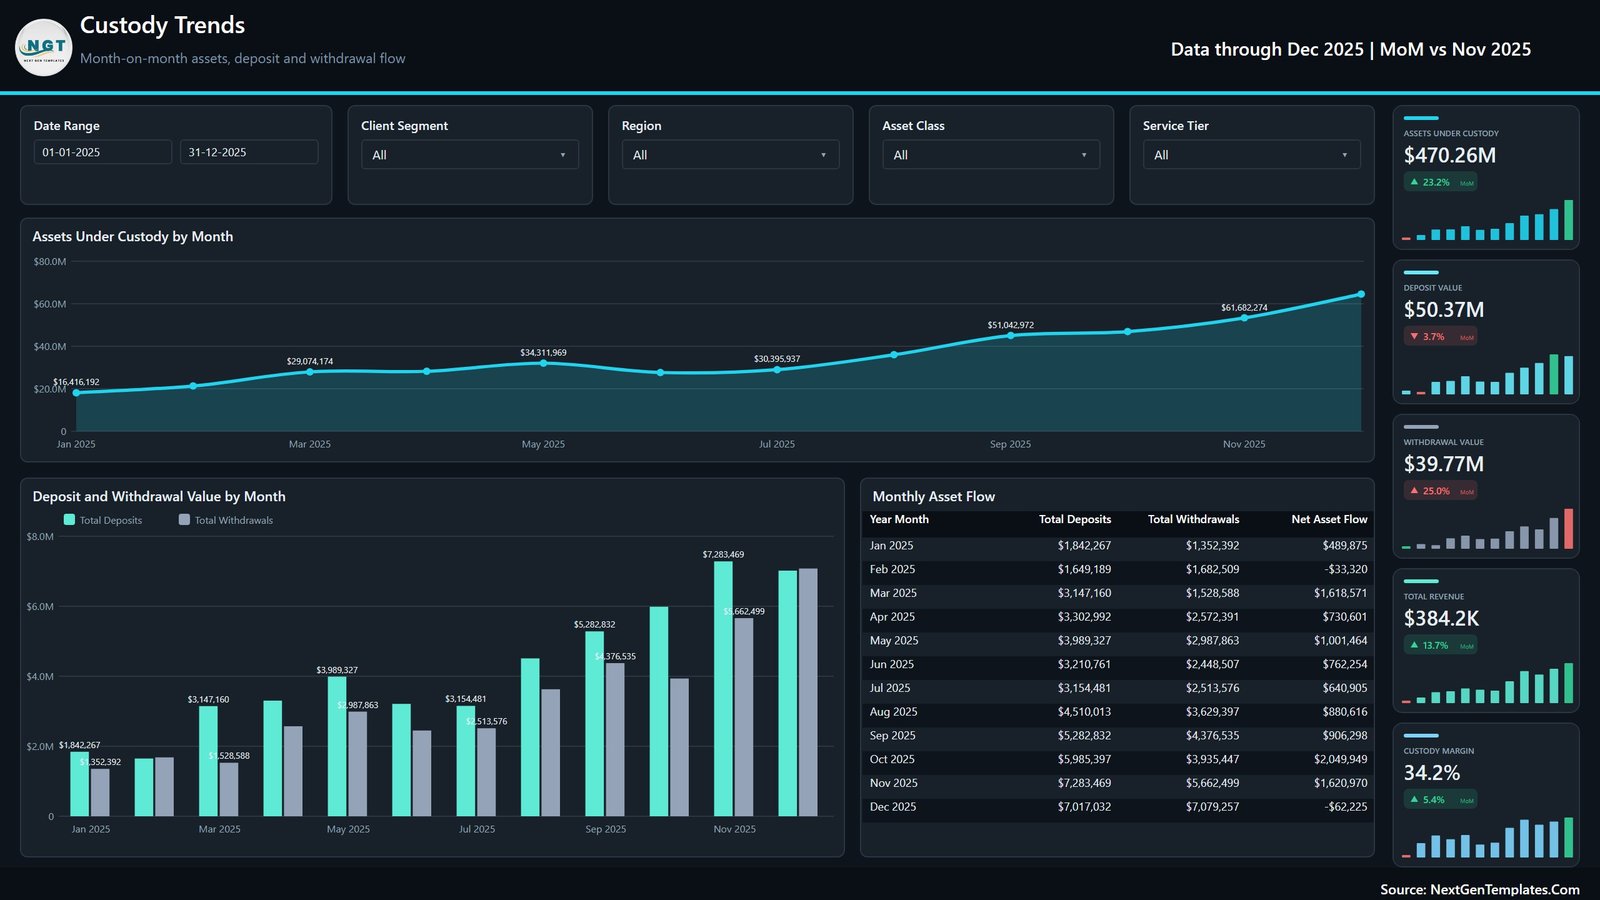
The flow page, and the one that answers “did money actually come in this month”. Cards show deposit value $50.37M, withdrawal value $39.77M, total revenue $384.2K and custody margin 34.2%. Assets Under Custody by Month is an area chart running from $16.4M in January to the year end. Deposit and Withdrawal Value by Month puts the two bars side by side, and the Monthly Asset Flow table gives the arithmetic in full – on the sample year March nets $1.6M positive while December nets $62,225 negative, because withdrawals of $7,079,257 slightly outrun deposits of $7,017,032.
Wallet & Asset Mix
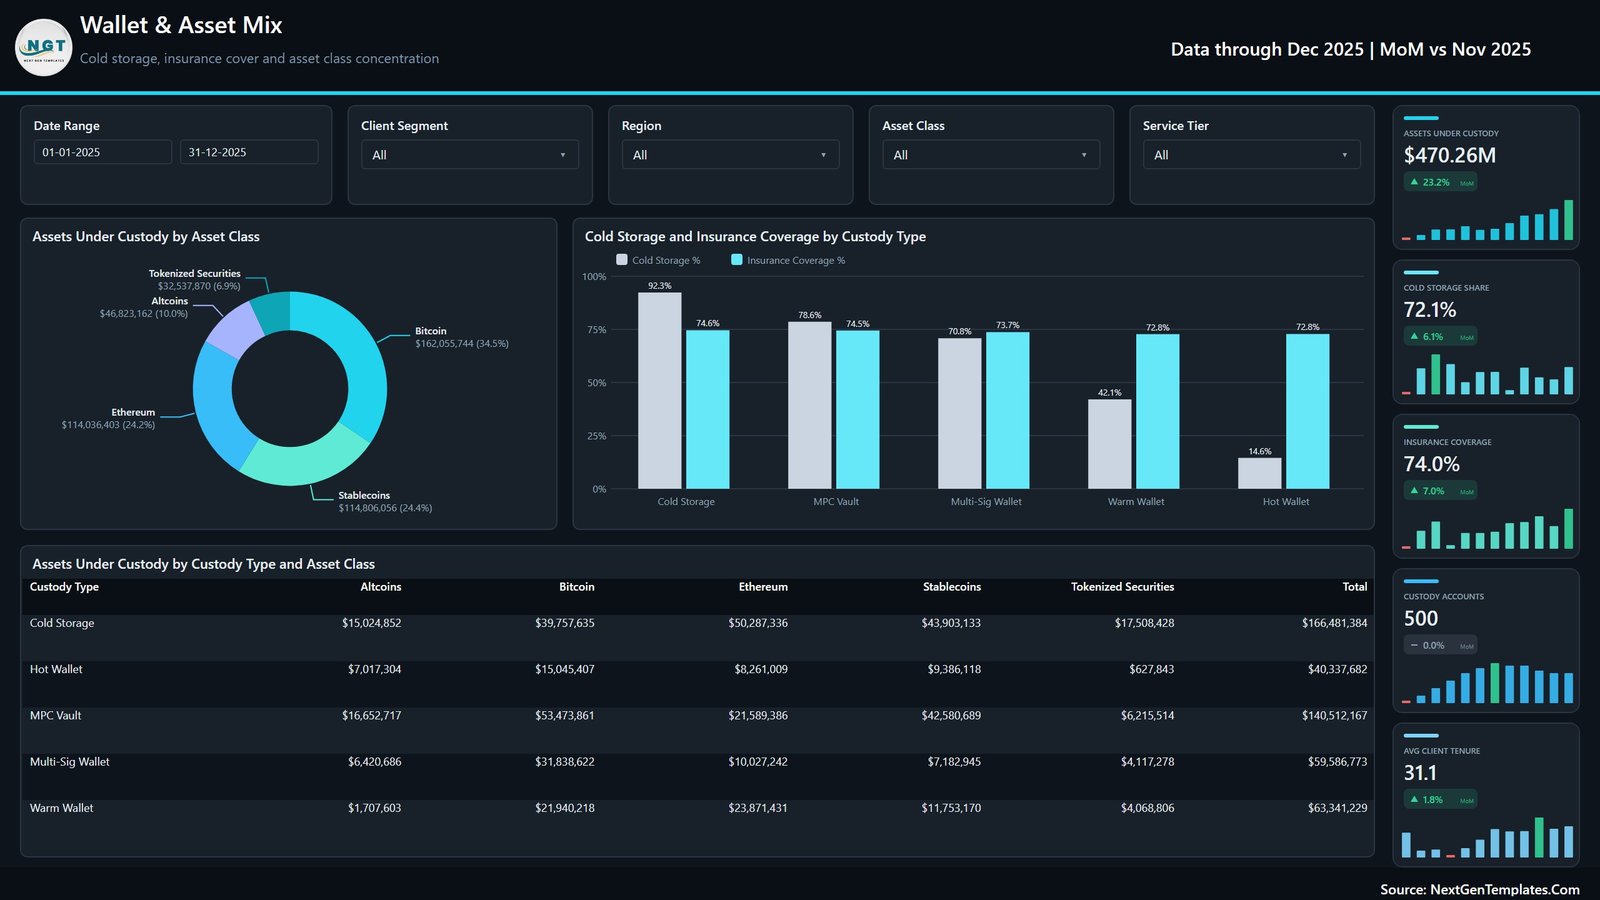
The concentration page. Cards report cold storage share 72.1%, insurance coverage 74.0%, custody accounts 500 and average client tenure 31.1 months. Assets Under Custody by Asset Class splits Bitcoin $162.1M (34.5%), Stablecoins $114.8M (24.4%), Ethereum $114.0M (24.2%), Altcoins $46.8M (10.0%) and Tokenized Securities $32.5M (6.9%). Cold Storage and Insurance Coverage by Custody Type is the chart most custody teams will screenshot: cold storage share runs 92.3% on Cold Storage, 78.6% on MPC Vault, 70.8% on Multi-Sig Wallet, 42.1% on Warm Wallet and 14.6% on Hot Wallet, while insurance coverage stays in a much narrower 72.8% to 74.6% band. The matrix underneath crosses custody type against asset class for every cell.
Settlement Operations
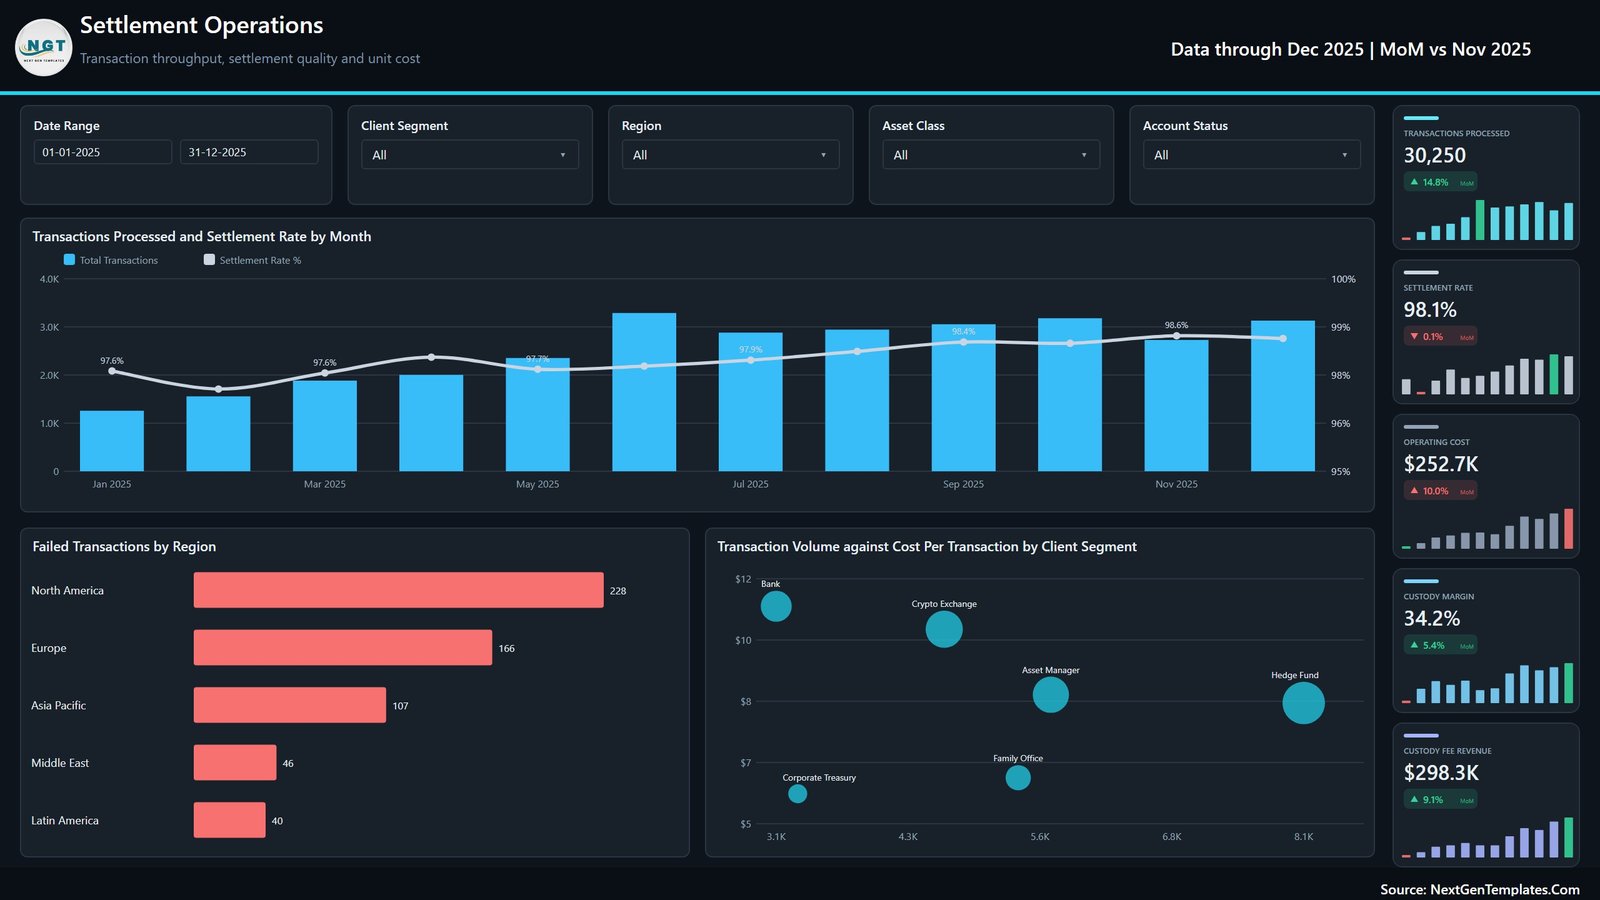
Operational quality rather than money. Cards cover transactions processed 30,250, settlement rate 98.1%, operating cost $252.7K, custody margin 34.2% and custody fee revenue $298.3K. Transactions Processed and Settlement Rate by Month runs volume as columns with the settlement rate as a line, holding between roughly 97.6% and 98.6% across the year. Failed Transactions by Region counts North America 228, Europe 166, Asia Pacific 107, Middle East 46 and Latin America 40. Transaction Volume against Cost Per Transaction by Client Segment is the page’s most useful chart: Hedge Fund sits at the far right on about 8.1K transactions at roughly $8 each, while Bank sits top-left on about 3.1K transactions at close to $12 each – low volume, high unit cost.
Clients & Channels
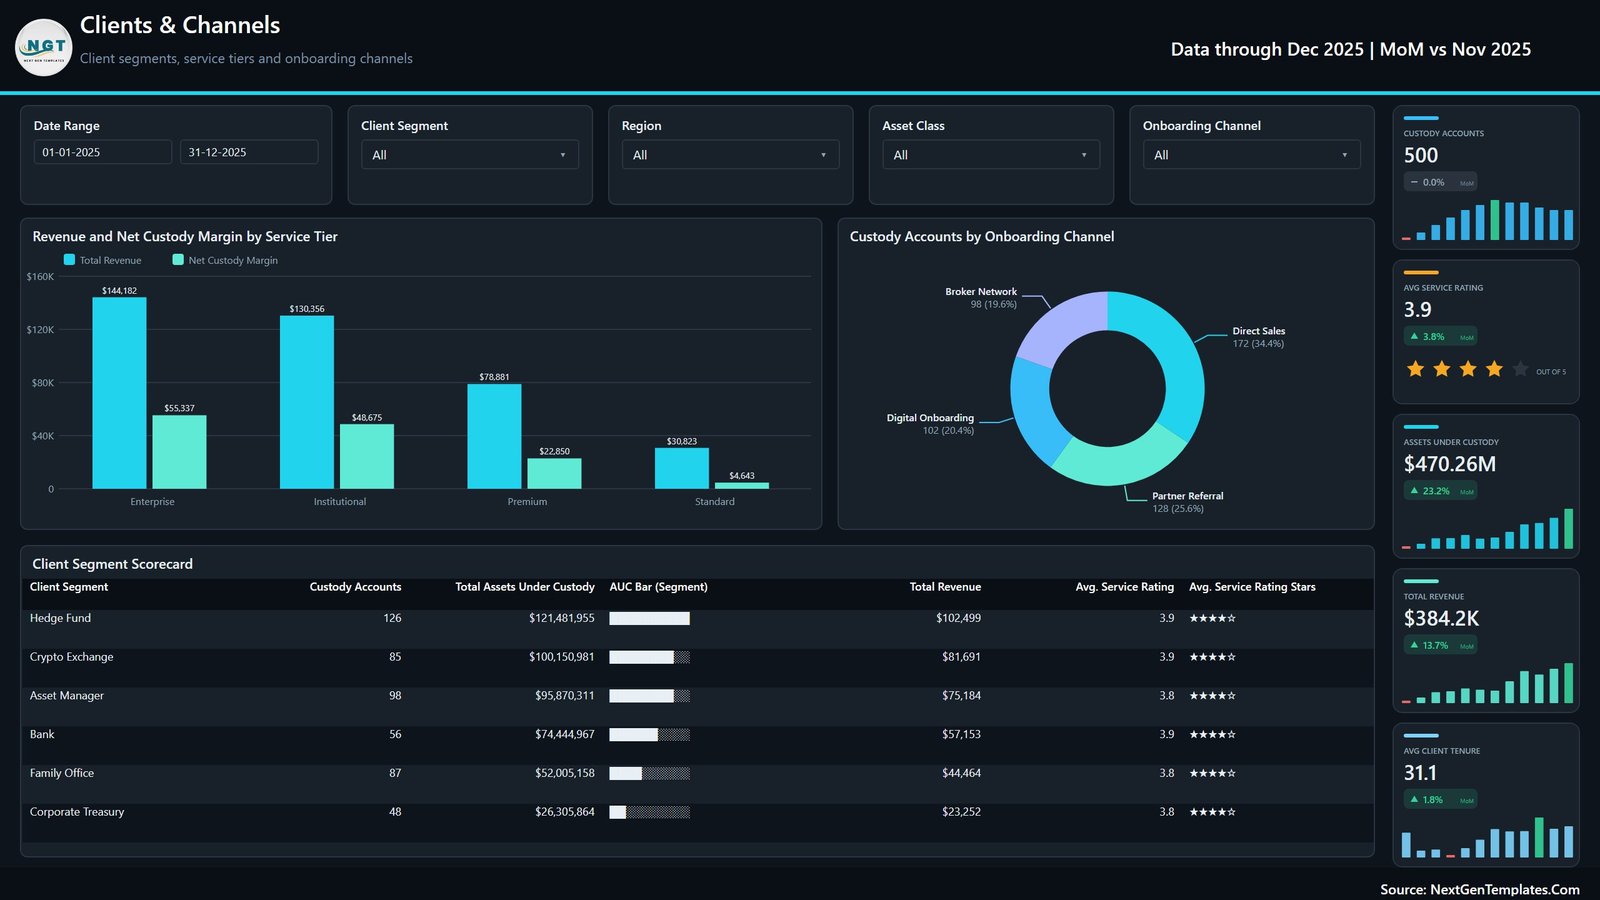
The commercial page. Cards show custody accounts 500, average service rating 3.9 out of 5, assets under custody, total revenue and average client tenure. Revenue and Net Custody Margin by Service Tier shows where margin actually lands: Enterprise $144,182 revenue against $55,337 margin, Institutional $130,356 against $48,675, Premium $78,881 against $22,850 and Standard $30,823 against just $4,643. Custody Accounts by Onboarding Channel splits Direct Sales 172, Partner Referral 128, Digital Onboarding 102 and Broker Network 98. The Client Segment Scorecard lists accounts, assets, revenue and service rating per segment – Hedge Fund 126 accounts and $102,499 revenue at the top, Corporate Treasury 48 accounts and $23,252 at the bottom.
Digital Asset Custodians Dashboard in Power BI vs. Tableau / Qlik vs. Your Custody Platform’s Reports – Feature Comparison
| Feature | Digital Asset Custodians Dashboard in Power BI | Tableau / Qlik build | Custody platform reporting |
|---|---|---|---|
| Cost | $17.99 one-time ✅ | $70-115 / user / month plus build time | Bundled into platform fees |
| Platform | Power BI Desktop, free from Microsoft ✅ | Paid licence per creator | Vendor web portal |
| Setup time | Swap the source file, refresh ✅ | Days of modelling and layout | Already there, but fixed |
| Several custodians in one view | Yes – one row per record, any source ✅ | Yes, if you build it | No |
| Live balances | No – you export and refresh | Only with a connector you build | Yes ✅ |
| Cold storage share by wallet type | Built in, on two pages ✅ | You would build it | Varies by vendor |
| Operating cost beside revenue | Yes, a real column ✅ | You would build it | Rarely |
| Rename fields | All 21 columns ✅ | Yes | Fixed schema |
| Year-1 cost at 5 users | $17.99 total ✅ | $4,200-6,900 | Included, not separable |
For custody and fund-servicing teams that want a board-ready monthly view without a per-seat BI licence, the Digital Asset Custodians Dashboard in Power BI sits in the sweet spot.
Who Should Use This Template
Perfect for:
- Digital asset custodians and trust companies building a monthly client or board pack from an export
- Crypto exchanges and brokers with a custody arm that report balances, flows and fees in separate places
- Fund administrators and asset servicers covering tokenised holdings alongside traditional books
- Finance and operations analysts who rebuild the same custody charts by hand every cycle
- BI consultants who want a working, editable .pbix as the starting point of an engagement
Not a fit if:
- You need live wallet, chain, exchange or price data – this file reads a file you supply and nothing else
- You want a custody system, a ledger, key management or transaction signing – this is a report, not an application
- You need proof-of-reserves attestation, an audit trail of record, or evidence for SOC 2, ISO 27001, MiCA or a qualified-custodian assessment – the file provides none of those and claims none of them
- You are looking for investment guidance, valuations or price forecasts – there are none in the file
- You have no row-level custody export to point it at
Real-World Use Cases
Marta runs client reporting at a 40-person digital asset trust company. Her monthly pack used to be three exports stitched together by hand. She now pastes the custody log into the source file, refreshes, and the Overview and Clients & Channels pages become the first two slides of the board deck.
Dev is head of operations at a brokerage with a custody arm. The Settlement Operations page shows him failed transactions by region beside cost per transaction by client segment, which is what separates a volume problem from a settlement problem when unit cost creeps up.
Priya is a BI consultant with two custody clients. She starts from this .pbix, renames the fields to match each client’s schema, and hands over a first working draft in an afternoon instead of a fortnight.
Advantages of the Digital Asset Custodians Dashboard in Power BI
The obvious advantage is cost: a one-time $17.99 against roughly $70-115 per creator per month for a comparable Tableau or Qlik build, before anyone has drawn a chart. The less obvious one is that it is opinionated in the right places. Somebody has already decided that cold storage share belongs next to insurance coverage, that operating cost belongs next to fee revenue, and that cost per transaction is worth plotting against volume rather than reported on its own. Those decisions are most of the work in a custody report, and they are already made.
It is also genuinely editable. Because it is a plain Power BI project with no custom visuals, everything in it – the theme, the page names, the measure names, the field names – can be changed without breaking anything, and you own the file outright.
Opportunities for Improvement
Being honest about the edges. The dashboard is refresh-based, not live: if your desk needs intraday balances, this is the wrong shape of tool. The model expects one row per custody record with the 21 headers it ships with, so an export in a different shape needs a Power Query step before it will load. There is no multi-currency or FX handling – values are treated as a single reporting currency. And the sample dataset is deliberately small at 500 rows; a real custody log of hundreds of thousands of rows will want the query folded back to a database source rather than an Excel file.
Best Practices
- Click through all five pages on the sample data before you swap anything, so you know what each measure means.
- Match your export to the 21 headers before you repoint the query – most load failures are a renamed or missing column.
- Reconcile at least one KPI card against a figure you already trust before the report leaves your desk.
- Rename the measures to your own vocabulary early; it is much cheaper than doing it after colleagues have learned the defaults.
- Delete the “Get More Dashboards” page before you circulate the file internally.
- Keep the disclaimer with the report. Anyone receiving custody figures should know they are refreshed from an export, not read live from a chain.
Explore Relevant Templates
The same subject is also built as a workbook – see the Digital Asset Custodians Dashboard in Excel and its product listing, which is a five-page Excel companion for colleagues who do not run Power BI Desktop. For wider crypto reporting there is the DeFi (Decentralized Finance) Dashboard in Excel and the Blockchain & Cryptocurrency Report in Excel. If you want another Power BI project in the same style, the Cybersecurity Startups Dashboard in Power BI follows the same five-page pattern, and the Crypto Portfolio Dashboard in Power BI covers holdings rather than custody operations. The full range sits under Power BI Dashboards, and ten finance reports are bundled in the Finance Power BI Pack.
One naming note: this is the analytical Power BI Dashboard line – five full analysis pages over a record-level table. It is a different product from the shorter KPI-scorecard line, such as the Personal Finance KPI Dashboard in Power BI, which is a month-picker scorecard rather than a multi-page analysis report.
Frequently Asked Questions
Does the Digital Asset Custodians Dashboard in Power BI connect to a blockchain, wallet or exchange?
No. The Digital Asset Custodians Dashboard in Power BI imports a flat file that you supply. It has no chain, wallet, exchange, custodian or price-feed connection, holds no keys and initiates nothing. You export from your own systems and refresh the report.
Are the numbers in the screenshots real?
No. Every figure shown – $470.26M assets under custody, 72.1% cold storage share, 30,250 transactions – comes from the 500 rows of fictional sample data inside the Digital Asset Custodians Dashboard in Power BI. You replace all of it with your own records before reporting anything.
What KPIs does the Digital Asset Custodians Dashboard in Power BI track?
Fifteen: assets under custody, custody fee revenue, transactions processed, settlement rate, insurance coverage, deposit value, withdrawal value, total revenue, custody margin, cold storage share, custody accounts, average client tenure, operating cost, average service rating and net custody margin by service tier.
How long does setup take?
Under thirty minutes if your export already has one row per custody record. Match your columns to the 21 headers in the sample file, repoint the query in Power BI Desktop and Close & Apply. Renaming fields and recolouring the theme takes one more short pass.
How does this compare with my custody platform’s built-in reports?
Platform reports are live but fixed, and they only see that platform. The Digital Asset Custodians Dashboard in Power BI is refreshed rather than live, but it accepts records from any number of sources, puts operating cost beside revenue, and lets you rename every field.
Does the insurance coverage figure prove my holdings are insured?
No. Insurance coverage in the Digital Asset Custodians Dashboard in Power BI is insured value divided by assets under custody, calculated from the Insured Value column you fill in. It is arithmetic on your own data, not evidence of cover, audit or regulatory standing.
Do I need a paid Power BI licence?
Not to use it. The Digital Asset Custodians Dashboard in Power BI opens and refreshes in Power BI Desktop, which Microsoft provides free. A Power BI Pro or Premium licence is only needed to publish the report to the Power BI service and share it there.
About the Author
Built by PK – Microsoft Certified Professional with 15+ years of Excel, Google Sheets, and Power BI experience. Founder of NextGenTemplates, reaching 300K+ subscribers across YouTube channels. Every template is hand-built and tested before release.
Conclusion
If your custody reporting is currently three exports and an afternoon, the Digital Asset Custodians Dashboard in Power BI replaces that with a refresh. It gives you assets under custody, wallet mix, cold storage share, deposit and withdrawal flow, settlement quality, unit cost and client margin in one model – built on data you supply, with no connection to anything you have not pointed it at.
👉 Click here to Purchase the Digital Asset Custodians Dashboard in Power BI
Instant download · One-time payment · No subscription
For step-by-step video tutorials visit Youtube.com/@PK-AnExcelExpert.
Last updated: September 2026