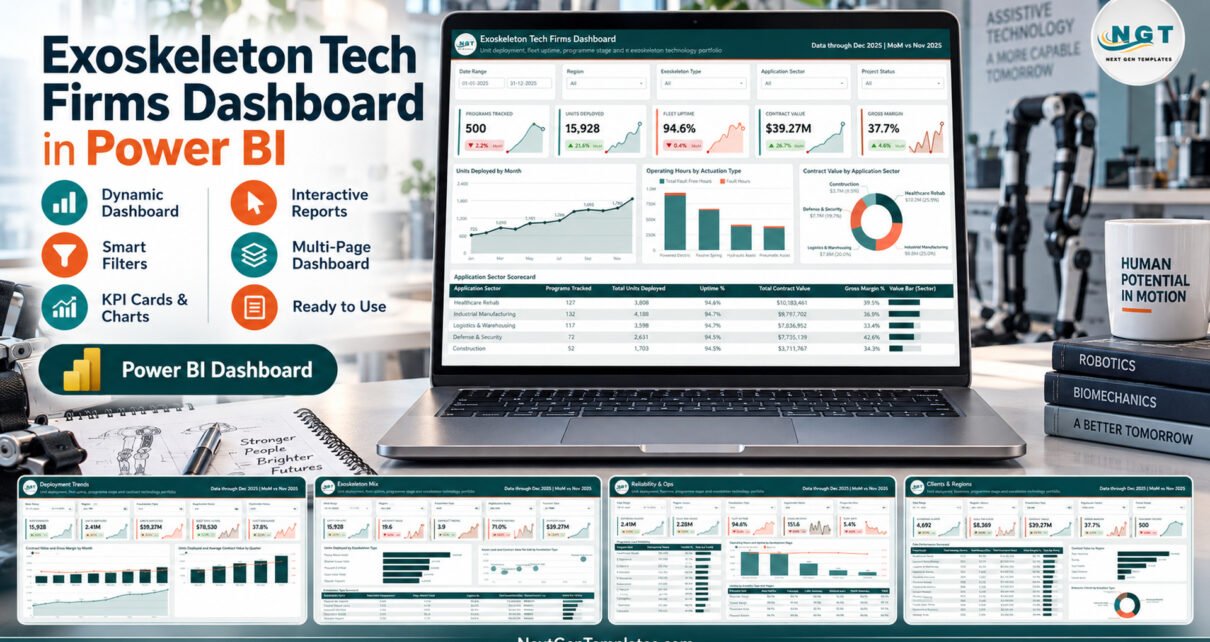
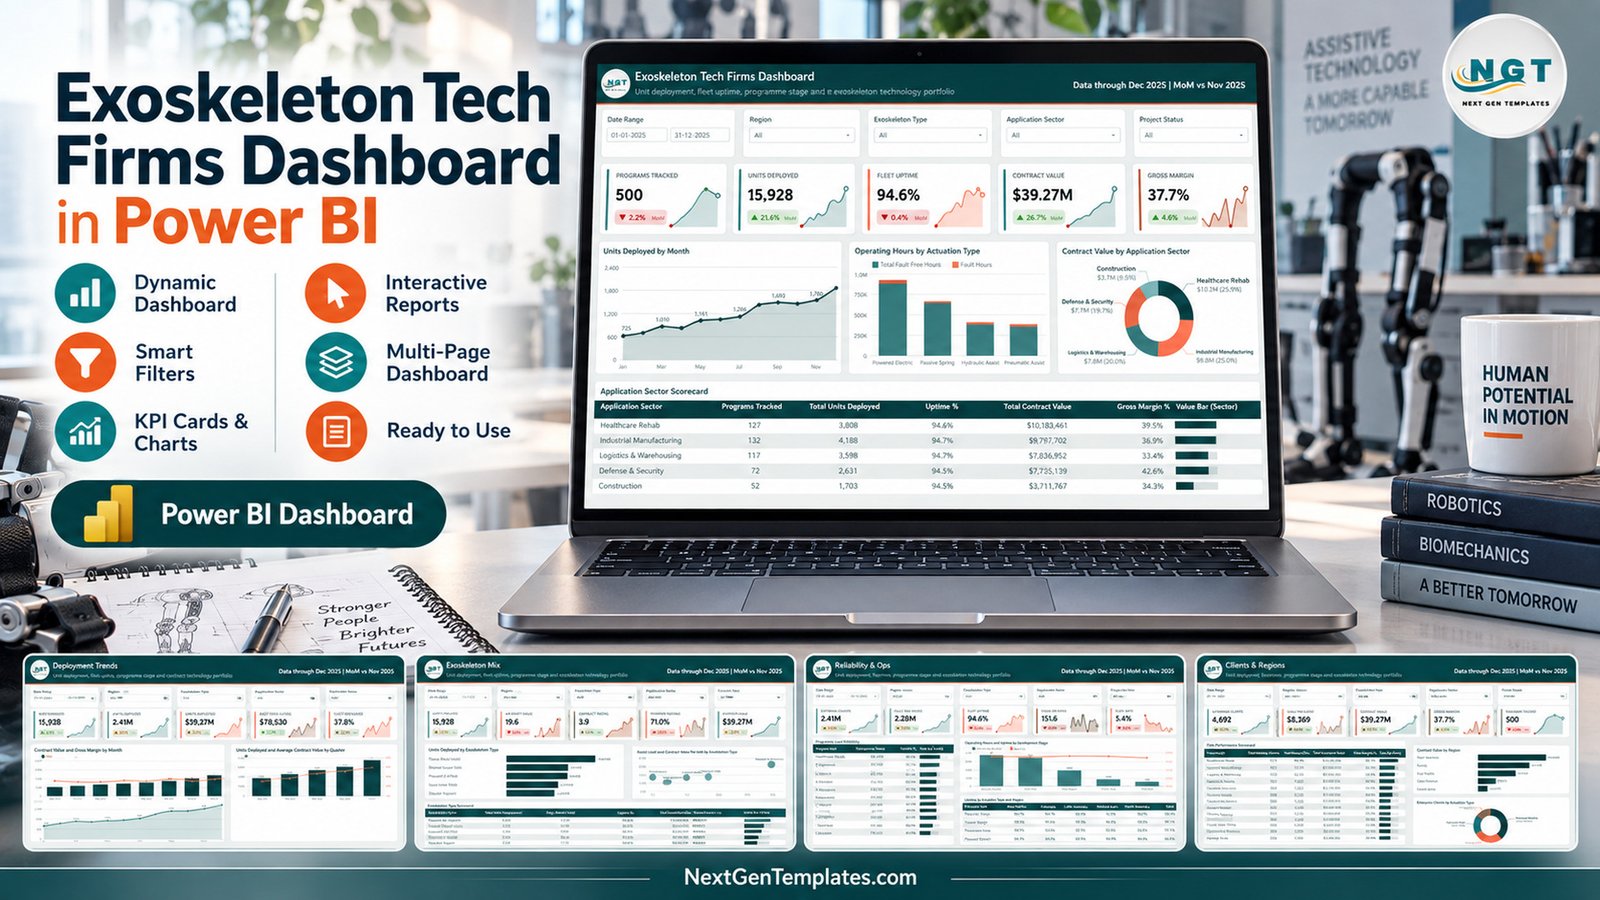
The Exoskeleton Tech Firms Dashboard in Power BI is a ready-made .pbix report. It turns 500 programme records into 5 analysis pages, 25 KPI cards and 16 charts and tables. In the sample year it reports 15,928 units deployed, 2.41M operating hours, 94.6% fleet uptime, $39.27M contract value and a 37.7% gross margin across 12 fictional exoskeleton firms.
Companies that build wearable robotics usually track deployments, reliability and contract income in separate spreadsheets. As a result, nobody sees the whole portfolio in one view. This template joins them in one model. You filter by region, exoskeleton type and application sector, and every card shows how the latest month compares with the month before.
Key Features of the Exoskeleton Tech Firms Dashboard in Power BI
- Five analysis pages. Overview, Deployment Trends, Exoskeleton Mix, Reliability & Ops and Clients & Regions each answer a different management question. A sixth closing page lists more NextGenTemplates dashboards.
- 25 KPI cards with month-over-month badges. Every analysis page opens with five cards. Each card shows the value, a green or red change badge and a twelve-month sparkline.
- Five slicers per page. Date Range, Region, Exoskeleton Type and Application Sector sit on every page. One extra filter changes per page: Project Status, Development Stage, Actuation Type, Program Lead or Firm Name.
- Reliability metrics that belong together. Operating Hours, Fault Free Hours, Fleet Uptime, Hours Per Unit (151.6) and Fault Rate (5.4%) appear on one page, next to uptime by development stage and by actuation type and region.
- Contract economics. Contract Value, Avg Contract ($78,530), Value Per Client ($8,369) and Gross Margin are tracked by month, by quarter, by sector, by region and by firm.
- Scorecard tables with data bars. Five scorecards rank application sectors, exoskeleton types, programme leads and firms. A sixth table, a matrix, shows uptime by actuation type and region.
- One simple data table. Data.xlsx has 18 columns and one row per programme record, so any export with the same fields can replace the sample rows.
Dashboard Pages Explanation
Each page shares the same header and slicer bar, so users move between pages without losing their bearings. Here is what each page contains.
Page 1: Exoskeleton Tech Firms Dashboard (Overview)
The overview cards show Programs Tracked (500), Units Deployed (15,928), Fleet Uptime (94.6%), Contract Value ($39.27M) and Gross Margin (37.7%). Three charts follow: Units Deployed by Month, Operating Hours by Actuation Type (fault-free hours stacked with fault hours) and Contract Value by Application Sector. In the sample, Healthcare Rehab carries the largest share at $10.2M, ahead of Industrial Manufacturing at $9.8M. The Application Sector Scorecard below lists programmes, units, uptime, contract value and gross margin for all five sectors. The page-specific slicer is Project Status.
Page 2: Deployment Trends
This page follows growth over time. Its cards are Units Deployed, Operating Hours, Contract Value, Avg Contract and Commercial Stage (37.8%). The Contract Value and Gross Margin by Month chart pairs monthly value bars with a margin line. Operating Hours by Month shows the usage trend. The Units Deployed and Average Contract Value by Quarter chart shows that units climbed from 2,578 in Q1 to 5,521 in Q4 of the sample year. The page filter is Development Stage.
Page 3: Exoskeleton Mix
This page compares the five product types: Passive Back Support, Powered Upper Limb, Powered Full-Body, Lower Limb Rehab and Shoulder Support. The cards show Units Deployed, Avg Assist Load (19.6 kg), Operator Rating (3.9), Powered Programs (71.0%) and Contract Value. Units Deployed by Exoskeleton Type ranks the types. Assist Load and Contract Value Per Unit by Exoskeleton Type plots each type by load and value. The Exoskeleton Type Scorecard adds uptime and satisfaction stars. The page filter is Actuation Type.
Page 4: Reliability & Ops
This is the operations page. Its cards are Operating Hours (2.41M), Fault Free Hours (2.28M), Fleet Uptime, Hours Per Unit and Fault Rate. The Programme Lead Reliability table ranks 10 leads by operating hours and uptime. Operating Hours and Uptime by Development Stage runs from Commercial Rollout to Prototype. A matrix of Uptime by Actuation Type and Region crosses Hydraulic Assist, Passive Spring, Pneumatic Assist and Powered Electric with five regions. The page filter is Program Lead.
Page 5: Clients & Regions
This page shows who buys and where. The cards are Enterprise Clients (4,692), Value Per Client, Contract Value, Gross Margin and Programs Tracked. The Firm Performance Scorecard ranks all 12 sample firms by clients, units, contract value and margin. Contract Value by Region puts North America first at $14.9M in the sample. Enterprise Clients by Actuation Type shows the client split. The page filter is Firm Name.
Page 6: Get More Dashboards
This closing page links to more Power BI templates and custom-build services from NextGenTemplates. It holds no analysis of its own.
Power BI Template vs. Tableau / Qlik Build vs. Subscription Analytics SaaS — Feature Comparison
| Feature | This Power BI template | Tableau / Qlik alternative | Subscription analytics SaaS |
|---|---|---|---|
| Cost | ✅ $17.99 one-time (regular $29.99) | Software licence plus build time | Recurring per-seat subscription |
| Platform | Power BI Desktop (.pbix), free on Windows | Tableau or Qlik workbook | Vendor web app |
| Setup time | ✅ Opens populated in minutes | Days to weeks to design from scratch | An onboarding and integration project |
| Exoskeleton-specific pages | ✅ 5 pages for units, uptime, stage, mix and contracts | You design every page | Generic asset or fleet modules |
| Customizable fields and visuals | ✅ Every visual, measure and colour is editable | Yes, once built | Limited to vendor options |
| Real-time team collaboration | After publishing to the Power BI Service (licence needed) | Through Tableau Cloud or Qlik Cloud | ✅ Built in |
| Mobile access | Power BI mobile app once published | Vendor mobile apps | ✅ Usually built in |
| Share with link | Through the Power BI Service or a PDF / PowerPoint export | Through the vendor cloud | ✅ Built in |
| Year-1 cost at 5 users | ✅ One template fee, plus Power BI licences only if you share online | BI licences plus build time | Five seats for twelve months |
For teams that want exoskeleton deployment and contract reporting without a custom build or a per-seat subscription, this template sits in the sweet spot.
Who Should Use This Template
Perfect for:
- Programme and operations managers at wearable robotics and exoskeleton companies
- Finance and business development analysts who report contract value and margin by sector and region
- Consultants preparing portfolio reviews of robotics firms
- Power BI learners who want a realistic multi-page report to study and adapt
Not a fit if:
- You need a medical-device quality, clinical or regulatory reporting system. This is a business analytics template with fictional sample data.
- You only use a Mac, because Power BI Desktop runs on Windows.
- You need live device telemetry. The model reads a flat table that you refresh.
Real-World Use Cases
Maya runs programme delivery at an industrial exoskeleton maker. Before each weekly stand-up she filters Reliability & Ops to her region and checks fleet uptime and fault rate by actuation type. Next she scans the Programme Lead Reliability table to see which leads need help, then exports the page to PDF for the meeting pack.
Daniel is a finance analyst at a robotics group with several product lines. At quarter end he opens Deployment Trends. The monthly contract value and margin chart and the quarterly units chart let him explain whether revenue growth came from more units or bigger contracts.
Priya is a Power BI consultant who works with hardware start-ups. She maps a client’s CRM export to the 18 columns, refreshes the report and walks the founders through Clients & Regions. In the same call they compare regions, firms and enterprise client counts, and none of it needs a build from scratch.
Advantages of This Power BI Report
- Time saved. Five designed pages, 25 cards and 16 visuals are ready on day one, which saves the days a first build usually takes.
- One view of the portfolio. Deployments, reliability, product mix, clients and contract value share one model and one set of slicers.
- Month-over-month context. Change badges and sparklines show direction as well as the current value.
- Fully editable. Rename measures, recolour visuals or add pages in Power BI Desktop.
- One-time cost. No subscription is needed to use the file on your own machine.
Opportunities for Improvement
- No targets or forecasts. The cards compare against the previous month only. Add a target table if you manage against a plan or budget.
- One flat table. Every metric comes from a single 18-column sheet. Larger teams may want separate firm, programme and cost tables.
- Margin detail is high-level. Production Cost is one figure per record, so the model shows no cost-by-component breakdown.
- Refresh-based, not live. Numbers update when you refresh the data source, not from connected devices.
- Check the share measures. Commercial Stage and Powered Programs are percentage measures. Open their DAX and confirm the definitions match your own before you present them.
Best Practices
- Keep the 18 column headers exactly as they are, and change the data, not the structure.
- Use one row per programme record per date, so monthly trends and MoM badges stay accurate.
- Store Data.xlsx in a fixed folder or a SharePoint path, so the Power Query source does not break.
- Review Fleet Uptime together with Fault Rate and Hours Per Unit, never in isolation.
- Follow Microsoft’s guide to connecting to data in Power BI Desktop when you point the report at your own file.
Explore Relevant Templates
If your team works in Excel, read our walkthrough of the Exoskeleton Tech Firms Dashboard in Excel. It is a separate workbook build, available on NextGenTemplates.
For more deep-tech and manufacturing reports in Power BI, see our guides to the Digital Twins in Manufacturing Dashboard in Power BI and the Emotion AI Startups Dashboard in Power BI.
- Robotics Process Automation Dashboard in Power BI
- ERP Systems Dashboard in Power BI
- Robotics Industry KPI Dashboard in Power BI (a KPI dashboard, a different template family)
- All Power BI dashboard templates
Frequently Asked Questions
What is the Exoskeleton Tech Firms Dashboard in Power BI?
It is a Power BI Desktop report for exoskeleton and wearable robotics firms. It has five analysis pages covering units deployed, operating hours, fleet uptime, product mix, clients, regions, contract value and gross margin, built on 500 fictional sample records that you replace with your own.
Do I need a paid Power BI licence to use it?
No. Power BI Desktop is free from Microsoft and opens the .pbix on Windows. You only need licences to publish and share reports in the Power BI Service.
How long does setup take?
The report opens with sample data straight away. To use your own data, shape your export into the same 18 columns, change the file path in Power Query and click Refresh. Most of the time goes into preparing the export itself.
Is the sample data real?
No. Firm names, programme leads and all figures are fictional. Labels such as Clinical Trial and Healthcare Rehab are sample categories only. The template holds no clinical, regulatory or safety data and makes no medical-device, efficacy or investment claim.
How does this report compare with a subscription analytics tool?
You pay once, keep the file and can edit every visual. The exoskeleton-specific pages are already designed. A subscription tool adds hosted collaboration but charges per seat each month, and it rarely ships pages built around exoskeleton deployment and uptime.
Is there an Excel version?
Yes. The Excel edition is a separate workbook build with its own layout. Choose the edition that matches the tool your team already uses.
About the Author
Built by PK — Microsoft Certified Professional with 15+ years of Excel, Google Sheets and Power BI experience. Founder of NextGenTemplates, with YouTube channels reaching a large audience of spreadsheet and BI users. Every template is hand-built and tested before release.
Conclusion
This report gives exoskeleton companies one place to follow deployments, reliability, product mix, clients and contract economics. It is quick to adopt, easy to adapt and honest about what it is: a business analytics template, not a regulatory system.
👉 Click here to Purchase Exoskeleton Tech Firms Dashboard in Power BI
✅ Instant download · One-time payment · No subscription
Last updated: September 2026
🎥 Watch more tutorials on YouTube: Youtube.com/@PKAnExcelExpert