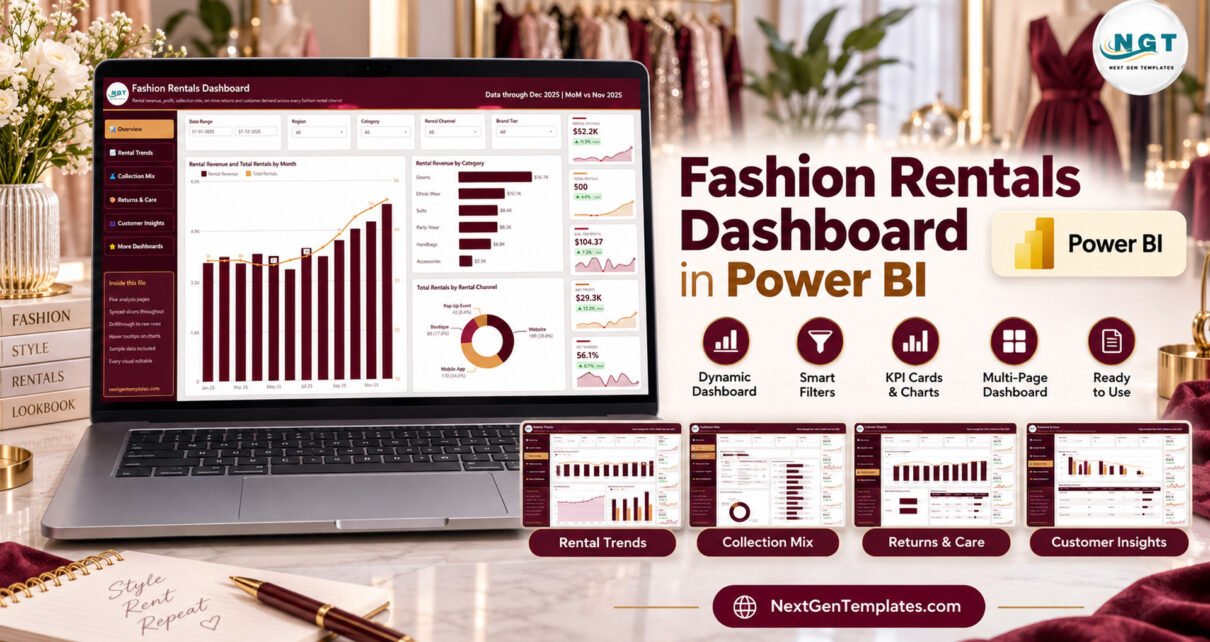
The Fashion Rentals Dashboard in Power BI packs 5 report pages, 25 KPI cards and 15 charts and tables into one .pbix file. It reads a 500-row sample rental log for 2025 and reports rental revenue, net profit, collection mix, on-time returns, damage and customer ratings across four rental channels and five regions.
Clothing rental businesses live on thin details. A gown that comes back late misses its next wedding booking. A handbag returned damaged eats the profit from three rentals. Most rental owners already record each rental in a spreadsheet, but turning that log into a monthly picture of revenue, returns and customers takes hours of pivot tables. This Power BI report does that work once, so you can open it, refresh it and read it.
Key Features of Fashion Rentals Dashboard in Power BI
- Five analysis pages: Overview, Rental Trends, Collection Mix, Returns & Care and Customer Insights, linked by a left navigation rail with a More Dashboards button.
- Synced slicers: Date Range, Region, Category and Rental Channel are synced across all five pages. Each page adds one page-level slicer: Brand Tier, Customer Type, Occasion or Rental Status.
- 25 KPI cards: every card shows the value, the change against the previous month and a 12-month sparkline. The sample header reads “Data through Dec 2025 | MoM vs Nov 2025”.
- Hidden helper pages: a Details drillthrough page and two tooltip pages, Trend Detail and Metric Detail, sit behind the visuals.
- Returns and damage analysis: On-Time Returns, Late Returns and Damage Rate are reported next to a Category Care Scorecard with operating cost per category.
- Editable model: every visual, colour and page can be changed in Power BI Desktop.
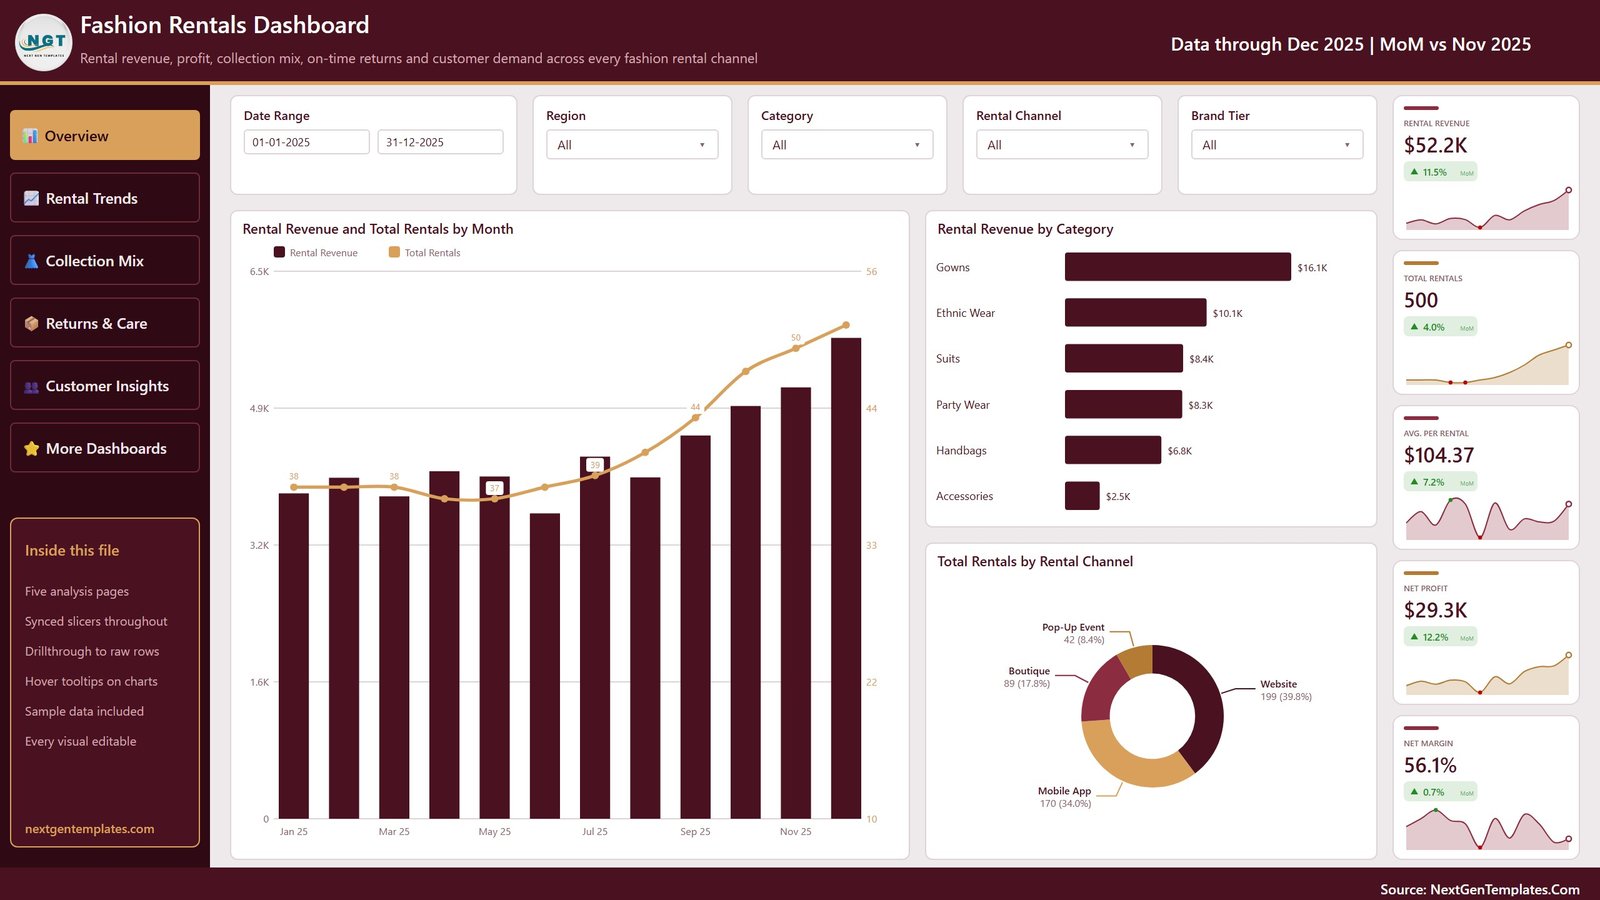
In the sample file the dashboard reports $52.2K of rental revenue from 500 rentals, a 56.1% net margin, an 84.0% on-time return rate and a 9.8% damage rate. These numbers are fictional and exist only to show how the report behaves.
Dashboard Pages Explanation
1. Overview
The Overview page gives the headline view. KPI cards show Rental Revenue, Total Rentals, Avg. per Rental, Net Profit and Net Margin. The charts are Rental Revenue and Total Rentals by Month, Rental Revenue by Category (Gowns lead in the sample) and Total Rentals by Rental Channel, where Website and Mobile App carry most of the volume.
2. Rental Trends
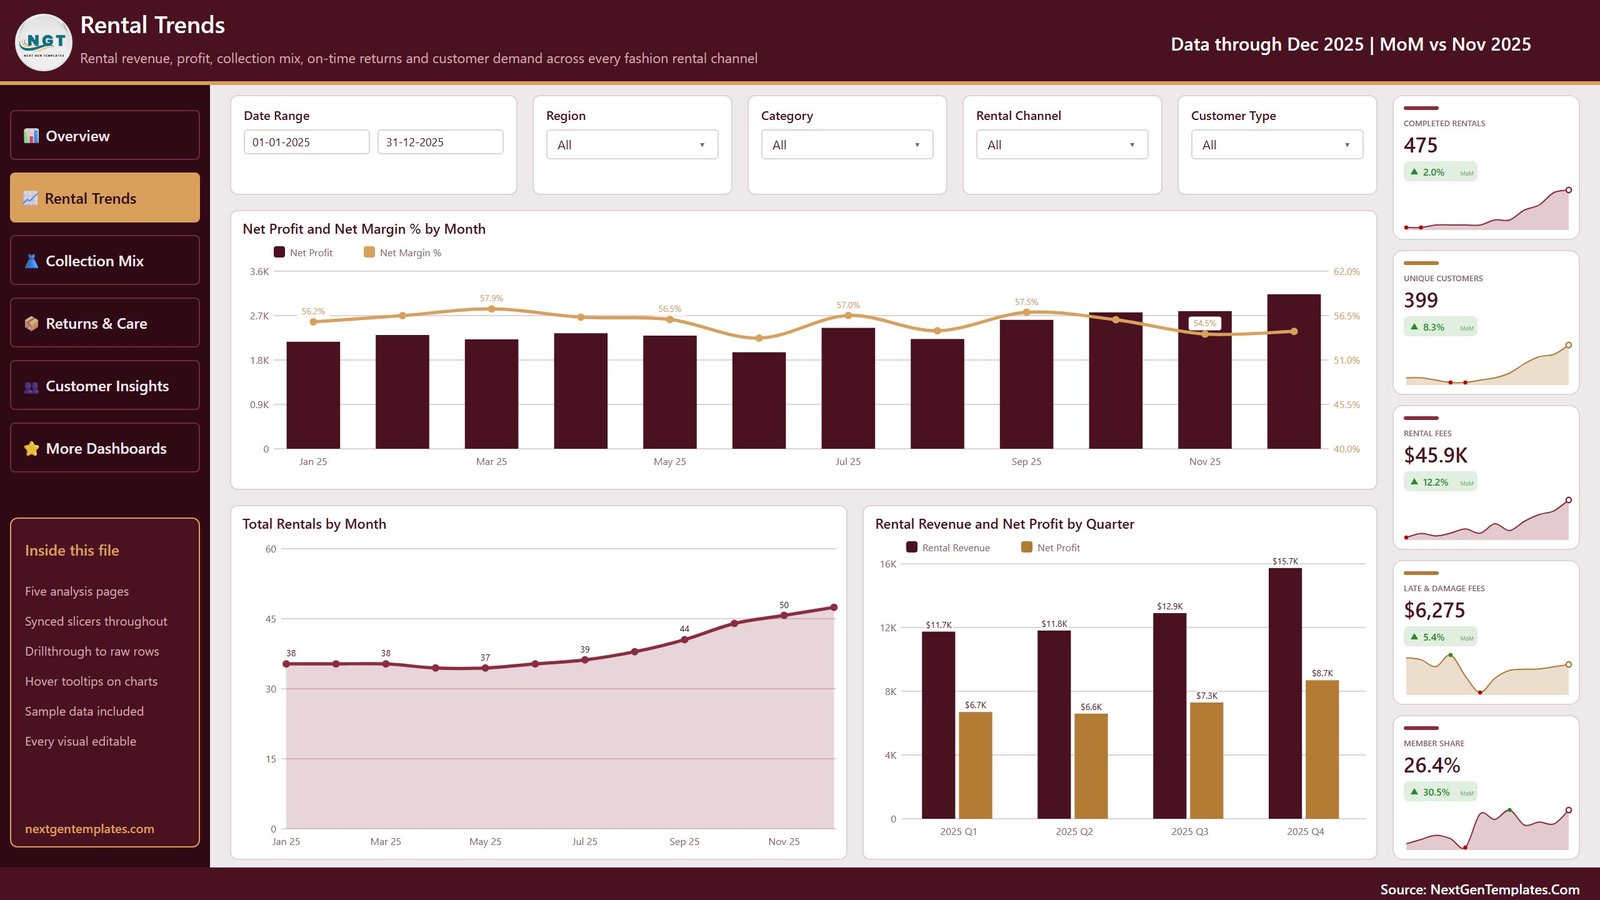
This page follows the business over time. Cards cover Completed Rentals, Unique Customers, Rental Fees, Late & Damage Fees and Member Share. Charts show Net Profit and Net Margin % by Month, Total Rentals by Month and Rental Revenue and Net Profit by Quarter, which makes seasonal peaks easy to spot.
3. Collection Mix
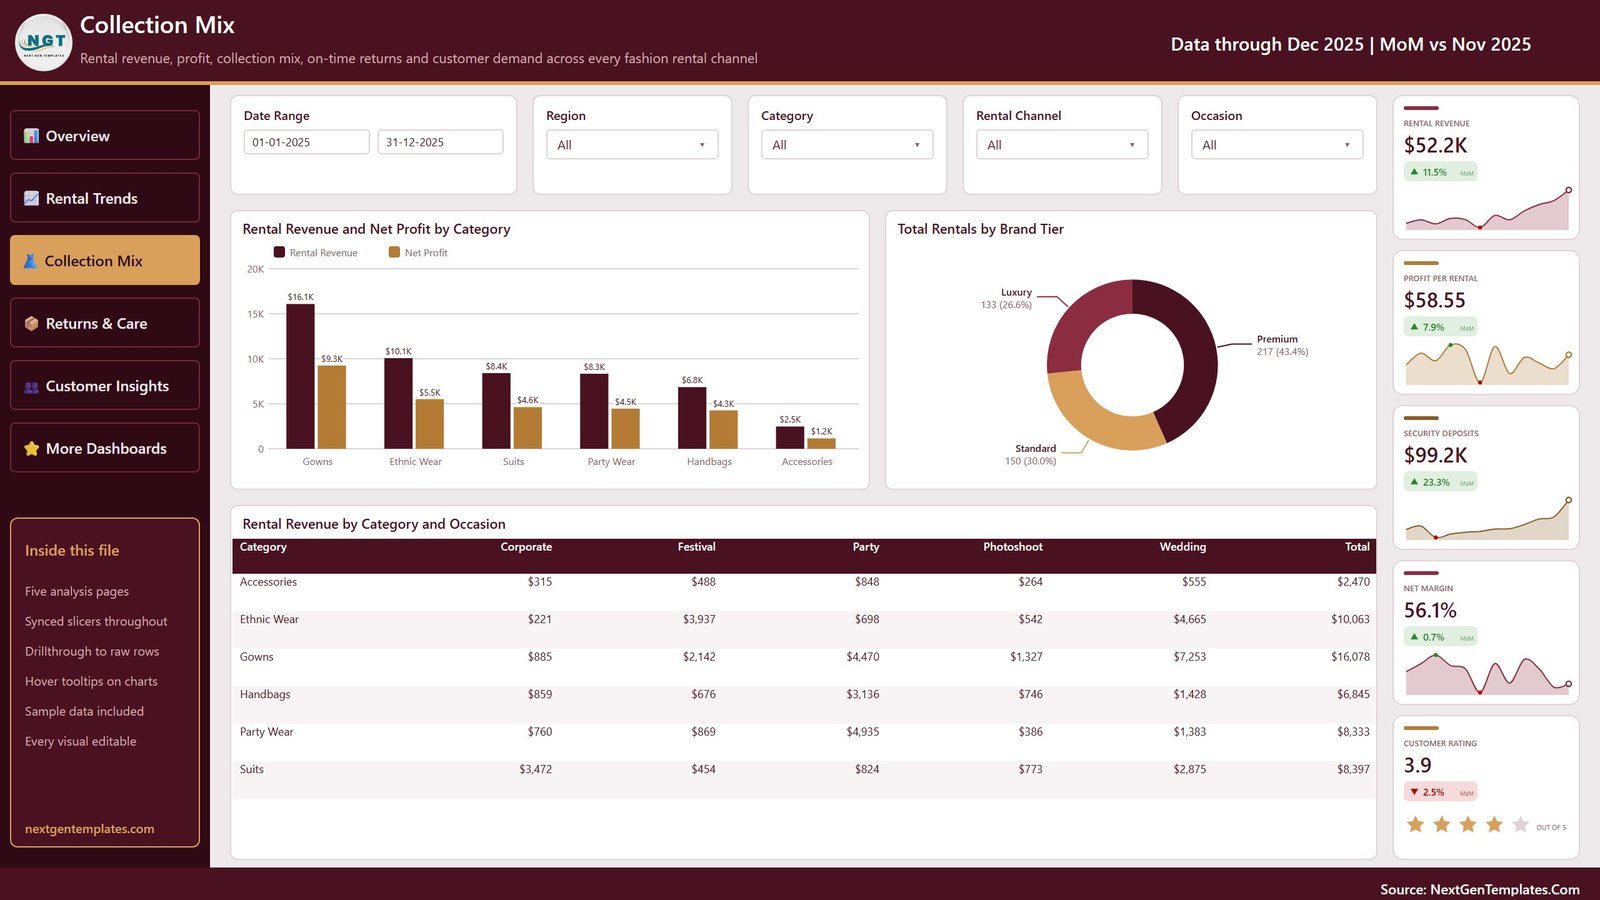
Collection Mix shows what earns money. Cards include Rental Revenue, Profit per Rental, Security Deposits, Net Margin and Customer Rating. Rental Revenue and Net Profit by Category compares the six categories, Total Rentals by Brand Tier splits Standard, Premium and Luxury, and a matrix breaks Rental Revenue by Category and Occasion.
4. Returns & Care
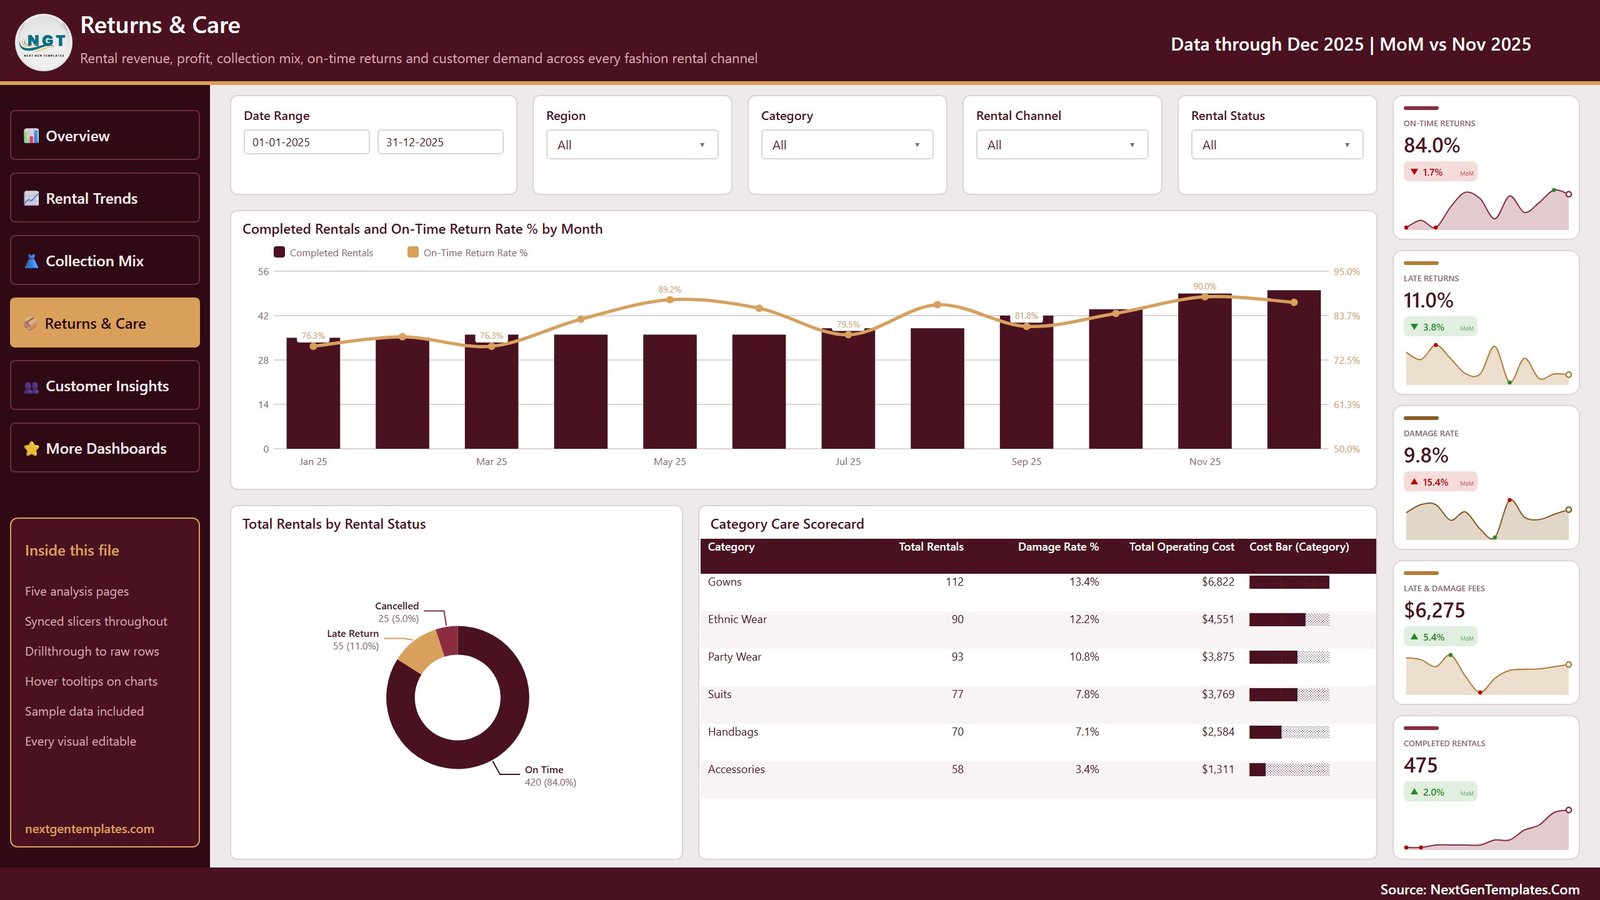
Returns & Care is where rental stock is protected. Cards show On-Time Returns, Late Returns, Damage Rate, Late & Damage Fees and Completed Rentals. Completed Rentals and On-Time Return Rate % by Month tracks punctuality, Total Rentals by Rental Status splits On Time, Late Return and Cancelled, and the Category Care Scorecard lists rentals, damage rate and total operating cost per category.
5. Customer Insights
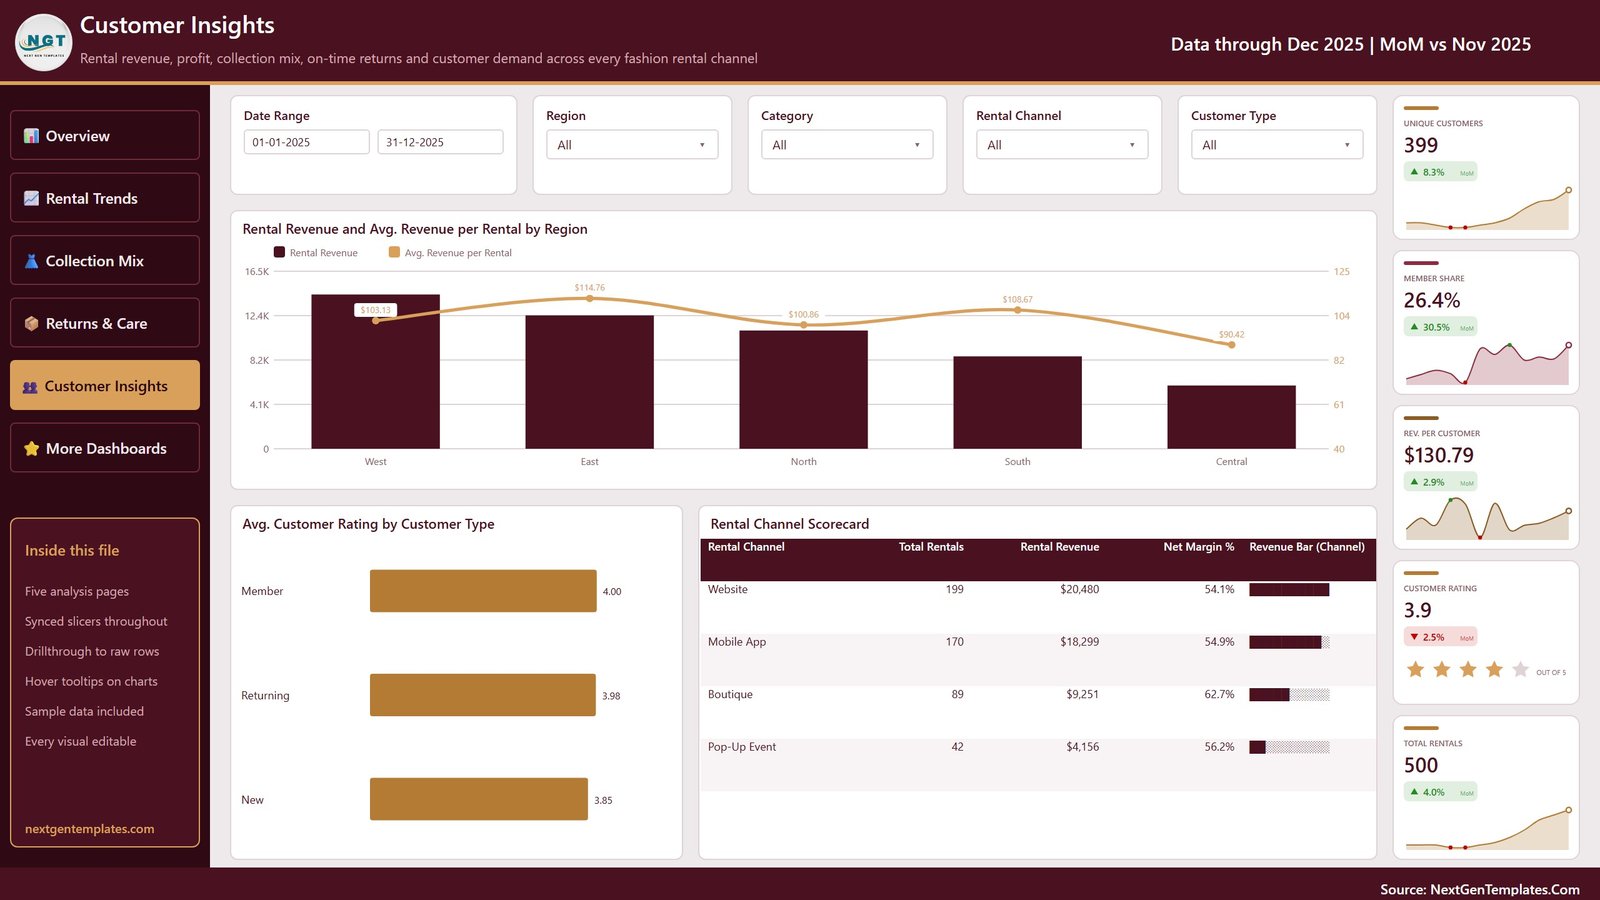
The last page looks at who rents and where. Cards include Unique Customers, Member Share, Rev. per Customer, Customer Rating and Total Rentals. Rental Revenue and Avg. Revenue per Rental by Region compares five regions, Avg. Customer Rating by Customer Type compares Member, Returning and New customers, and the Rental Channel Scorecard lists rentals, revenue and net margin for each channel.
Power BI Template vs. Tableau / Qlik vs. Rental Management SaaS
| Feature | Fashion Rentals Power BI template | Tableau / Qlik build | Rental management SaaS |
|---|---|---|---|
| Cost | ✅ One-time purchase | Tool licence plus build time | Monthly subscription |
| Platform | Power BI Desktop (free, Windows) | Tableau or Qlik | Vendor web app |
| Setup time | ✅ Opens populated with sample data | Built from scratch | Onboarding and data import |
| Bookings, payments, availability | Not included (reporting only) | Not included | ✅ Core feature |
| Returns and damage reporting | ✅ Dedicated page | Build it yourself | Varies by vendor |
| Custom visuals and measures | ✅ Fully editable | ✅ Yes | Limited |
| Team sharing | Power BI Service (licence needed) | Server or cloud licence | ✅ Built-in accounts |
| Data ownership | ✅ Your own Excel file | ✅ Your own source | Stored with the vendor |
If you already keep a rental log and want clear reporting without a new subscription, this template is the practical middle ground.
Who Should Use This Template
Perfect for:
- Dress, suit, ethnic wear and handbag rental shops that record rentals in Excel
- Rental operators selling through a website, an app, boutiques and pop-up events
- Power BI consultants who want a ready report to adapt for a rental client
Not a fit if:
- You need booking calendars, stock holds, payments or deposit refunds. This is a reporting template, not rental management software.
- You cannot run Power BI Desktop, which is a Windows application.
Real-World Use Cases
A bridal rental studio. Meera filters Collection Mix to the Wedding occasion to see which categories earn the most, then checks the Category Care Scorecard before adding more gowns to her collection.
A suit rental chain. Daniel runs a website and two boutiques. The Rental Channel Scorecard shows him net margin by channel, and Rental Revenue by Region tells him where promotion pays back.
A BI consultant. Aisha swaps a client’s rental log into Data.xlsx, refreshes the report and restyles the theme, delivering a working report the same day.
Advantages of This Rental Dashboard
- Returns get equal billing with revenue. Late returns and damage are on their own page instead of hidden in a notes column.
- Month-on-month context on every card. Each KPI shows its change against the previous month, so a slow month stands out at once.
- One filter set, five pages. Synced slicers mean you pick a region or category once.
- Your data stays yours. The report reads a local Excel workbook you control.
Opportunities for Improvement
- The report reads one Excel workbook. Businesses on a booking platform must export rentals to Excel first.
- Security Deposits is a total of deposits recorded, not a live liability or refund ledger.
- There is no stock or garment-level utilisation view. Adding an item ID column would allow one.
- Customer Rating is an average of recorded ratings; it does not collect feedback.
Best Practices
- Keep the 21 column headers in Data.xlsx unchanged so every measure keeps working.
- Record every rental, including cancelled ones, so on-time and cancellation rates stay honest.
- Log damage charges and late fees in their own columns rather than folding them into the rental fee.
- Refresh after each month closes and compare the MoM badges before planning purchases.
- Read Microsoft’s guide to refreshing a dataset created from a local Power BI Desktop file before publishing to the Service.
Explore Relevant Templates
If you run a wider rental operation, the Rental Services Dashboard in Power BI covers general rental businesses. Fashion retailers can compare the Fashion Boutiques Dashboard in Power BI and the Luxury Handbags Dashboard in Power BI. For KPI tracking in Excel, see the Fast Fashion Brands KPI Dashboard in Excel. An Excel edition of this rental dashboard is in preparation.
Frequently Asked Questions
What do I need to open this dashboard?
You need Power BI Desktop, which is free from Microsoft and runs on Windows. Download it from the Power BI Desktop page, unzip the purchase and open the .pbix file. Sharing with colleagues online needs a Power BI licence.
How long does setup take?
The report opens already populated with sample data, so you can explore it at once. Replacing the sample rows with your own rentals and refreshing usually takes as long as preparing your export, because the pages, measures and slicers are already built.
Can it take bookings or manage rental stock?
No. It is a reporting template that analyses rentals you have already recorded. It does not take bookings, block availability, process payments or refund deposits. Use it alongside your booking tool or spreadsheet.
Which KPIs are included?
The report shows 17 distinct KPIs on 25 cards, including Rental Revenue, Net Profit, Net Margin, Avg. per Rental, On-Time Returns, Late Returns, Damage Rate, Security Deposits, Member Share, Rev. per Customer and Customer Rating.
How does it compare with rental management software?
Rental management software runs day-to-day bookings on a subscription. This template is a one-time purchase focused on analysis: revenue, returns, damage and customer trends from your own data. Many owners use both, exporting rentals from their system into the workbook.
Is the sample data real?
No. All 500 rentals and customer names in Data.xlsx are fictional and only demonstrate the report.
About the Author
Built by PK, a Microsoft Certified Professional with 15+ years of Excel, Google Sheets and Power BI experience and founder of NextGenTemplates. Every template is built and checked before release.
Conclusion
If your rental log already holds dates, categories, channels, fees and return status, the Fashion Rentals Dashboard in Power BI turns it into a five-page report on revenue, collection mix, returns and customers without building a single visual yourself.
👉 Click here to purchase the Fashion Rentals Dashboard in Power BI
✅ Instant download · One-time payment · No subscription
🎥 Watch more tutorials on Youtube.com/@PKAnExcelExpert
Last updated: September 2026