Managing monthly tasks, audits, reviews, and follow-ups becomes easy when you use a structured system. Many teams struggle with missed
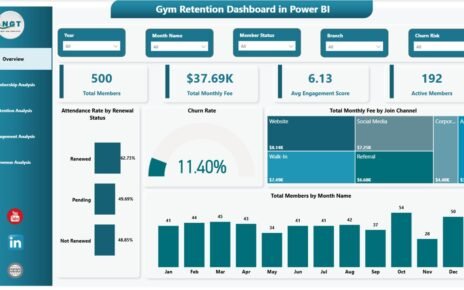
The Gym Retention Dashboard in Power BI tracks 4 headline KPIs across 5 interactive report pages, with 13 pre-built visuals
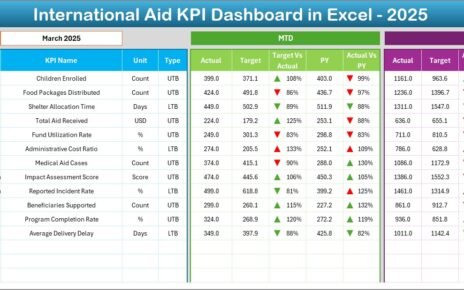
International aid organizations handle complex projects. They manage funds, monitor field activities, track beneficiaries, and report impact to donors. However,