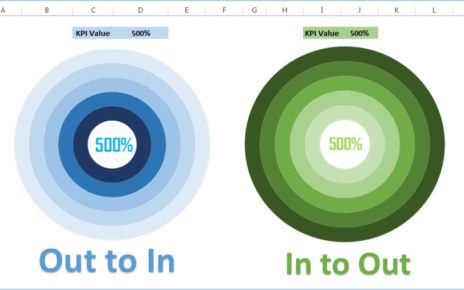
5 Layered Advanced Doughnut Chart In this article, we have created the 5 Layered Doughnut Chart to display the KPI
Effective hospital operations management relies on accurate data monitoring. A Hospital Operations KPI Dashboard in Excel offers a streamlined approach
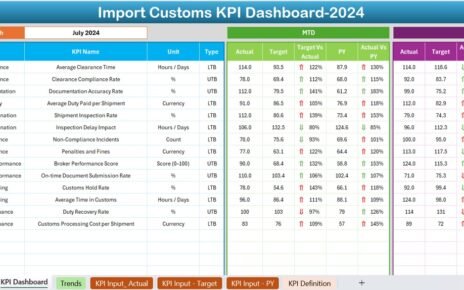
Managing import customs operations involves tracking complex data, deadlines, compliance rules, and performance metrics. To simplify and streamline this process,