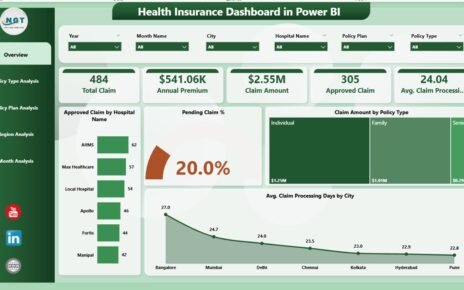
Managing health insurance data without clear visibility often leads to delayed decisions, rising claim costs, and compliance risks. Health insurance
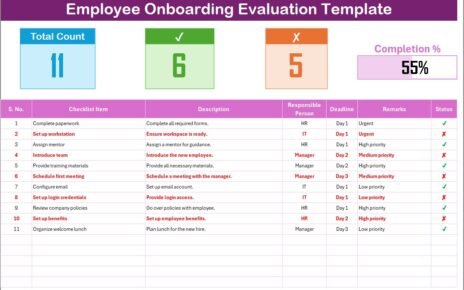
Onboarding is one of the most important processes in an organization, as it sets the foundation for a new hire’s
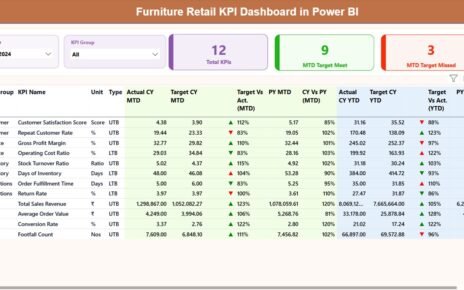
Running a furniture retail business requires sharp visibility into sales, margins, inventory, customer trends, and operational efficiency. However, when managers