Home>Blogs>Dashboard>Supply Chain and Logistics Process Improvement KPI Dashboard in Excel>Supply Chain and Logistics Process Improvement KPI Dashboard-3
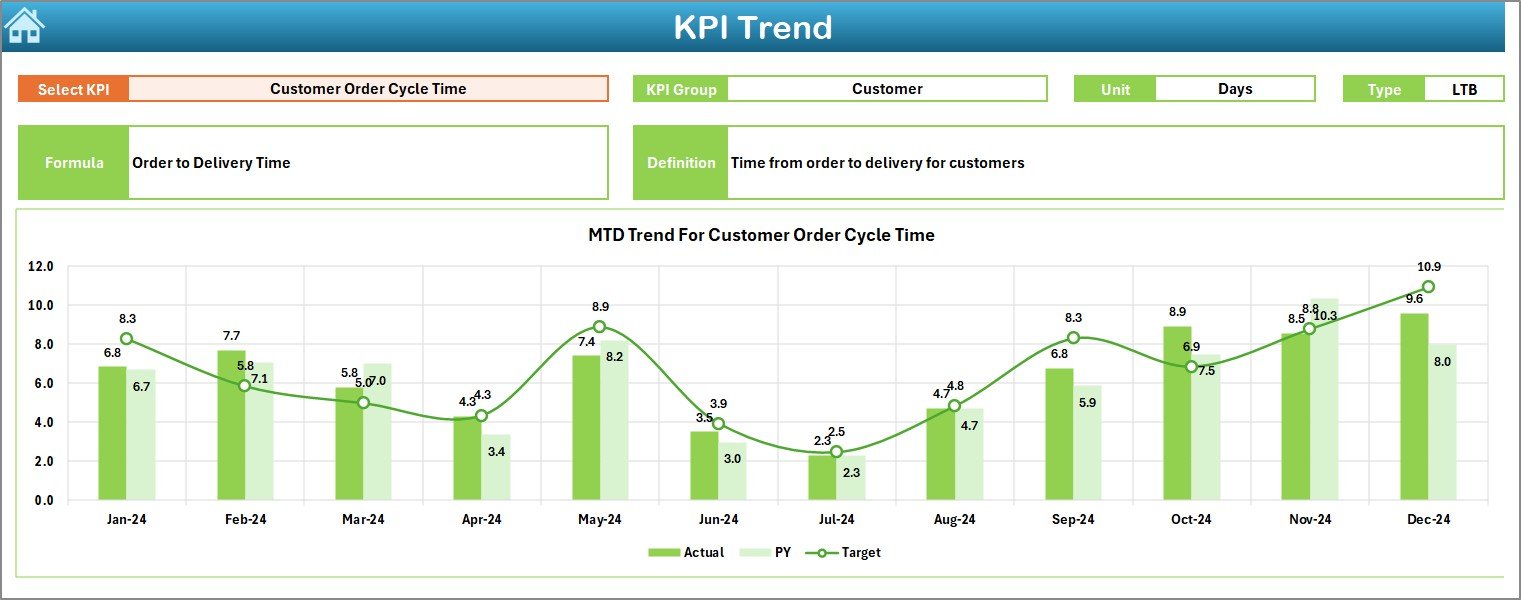
Supply Chain and Logistics Process Improvement KPI Dashboard-3
Related Articles

Transforming Data into Decisions