Home>Blogs>Dashboard>Digital Transformation KPI Dashboard in Power BI>Digital Transformation KPI Dashboard in Power BI 2
Digital Transformation KPI Dashboard in Power BI 2
29
May 2025
0Comments Off on Digital Transformation KPI Dashboard in Power BI 2
PK
Meet PK, the founder of PK-AnExcelExpert.com! With over 15 years of experience in Data Visualization, Excel Automation, and dashboard creation. PK is a Microsoft Certified Professional who has a passion for all things in Excel. PK loves to explore new and innovative ways to use Excel and is always eager to share his knowledge with others. With an eye for detail and a commitment to excellence, PK has become a go-to expert in the world of Excel. Whether you're looking to create stunning visualizations or streamline your workflow with automation, PK has the skills and expertise to help you succeed. Join the many satisfied clients who have benefited from PK's services and see how he can take your Excel skills to the next level!
https://www.pk-anexcelexpert.com
Related Articles
HR Report in Excel
Human Resource (HR) management is one of the most critical functions in any organization. Whether you’re managing recruitment, training, attendance,
Printing and Publishing Dashboard in Excel
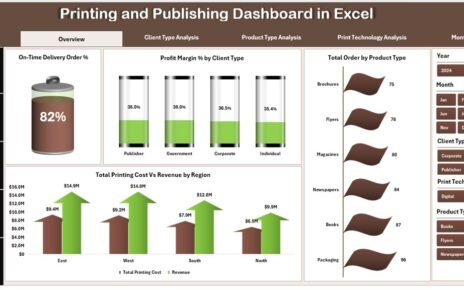
The printing and publishing industry moves fast. Clients demand quality. Deadlines stay tight. Costs fluctuate daily. Meanwhile, profit margins shrink
Finance Operations Customer Experience Calendar in Excel
Managing customer experience in finance operations is more important than ever. Customers expect transparency, speed, and personalized services, while organizations


