In today’s fast-paced business world, every organization aims to maximize productivity while minimizing wasted time and resources. However, without proper tracking, managing workflow efficiency can quickly become a challenge. This is where the Office Workflow Efficiency Report in Excel comes into play.
This ready-to-use Excel template is designed to help teams monitor task completion rates, identify bottlenecks, analyze workloads, and ensure that projects stay on track. Whether you are a manager overseeing multiple departments or an employee striving to meet deadlines, this report can be your go-to tool for improving office productivity.
In this article, we will explore what the Office Workflow Efficiency Report in Excel is, its features, advantages, best practices, and practical usage examples. We will also answer frequently asked questions to ensure you can get started with confidence.
Click to Purchases Office Workflow Efficiency Report in Excel
What Is the Office Workflow Efficiency Report in Excel?
The Office Workflow Efficiency Report in Excel is a structured, interactive reporting tool designed to track, analyze, and visualize key metrics related to office productivity. By using this template, organizations can:
-
Monitor task completion rates to ensure deadlines are met.
-
Evaluate departmental workload and identify areas of imbalance.
-
Track on-time delivery percentages to maintain high-quality output.
-
Analyze task types to optimize resource allocation.
-
Gain real-time insights using slicers and interactive charts.
Unlike generic reports, this template organizes data into three main sheets—Summary, Report, and Data—making it easy to navigate, customize, and update.
Key Features of the Office Workflow Efficiency Report
The report is neatly divided into sections that make data analysis quick and actionable.
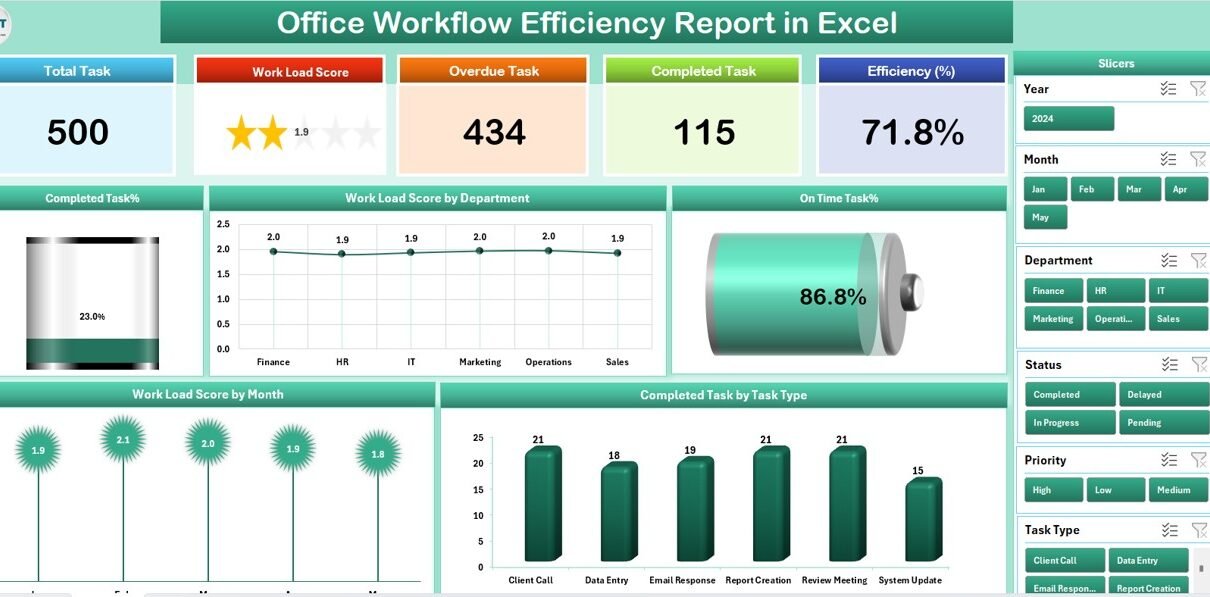
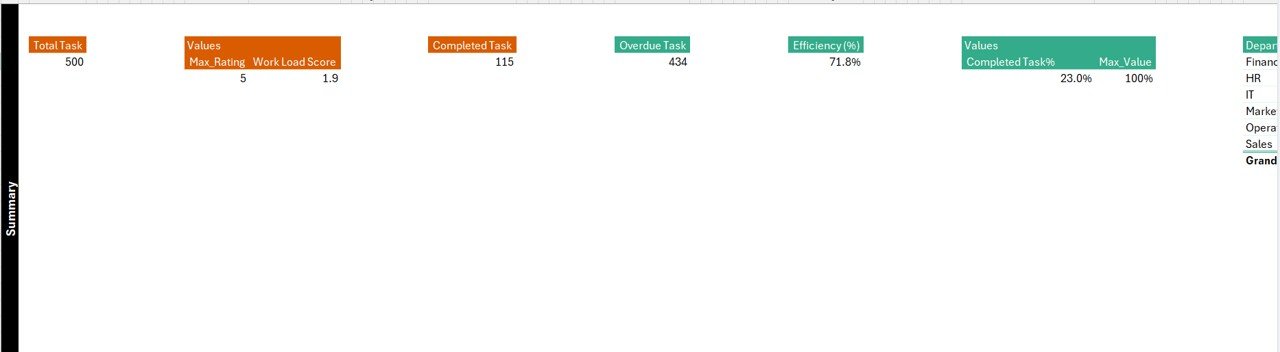
Summary Page
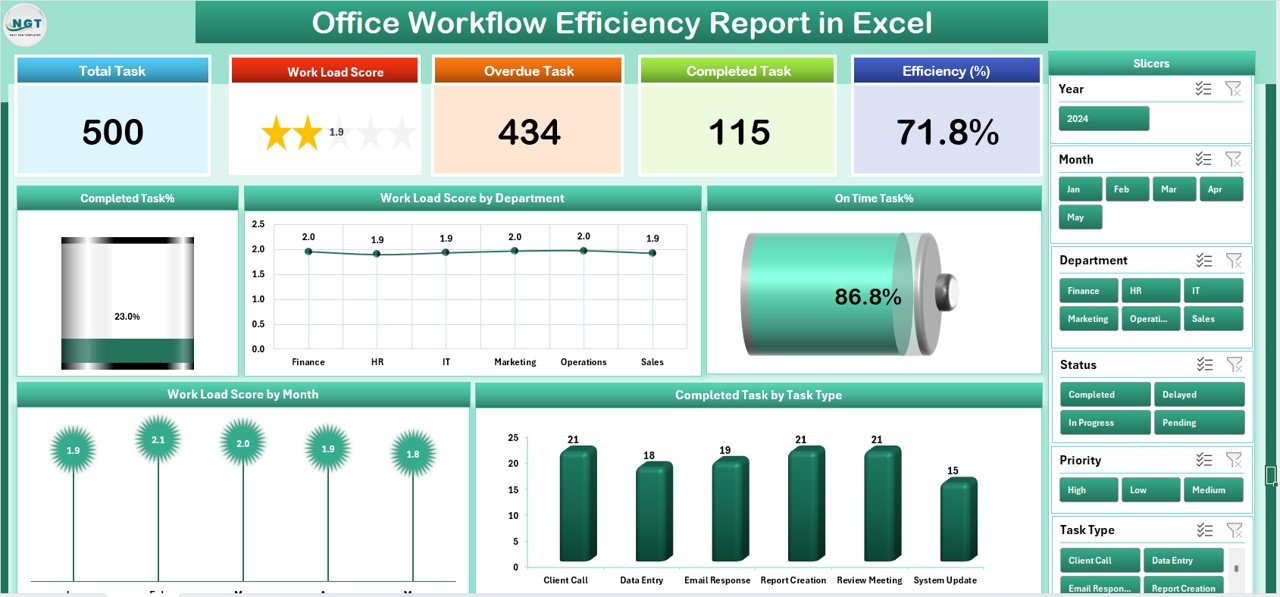
The Summary Page acts as the dashboard and provides a quick glance at performance metrics.
Top 5 Cards:
These display key metrics such as:
- Completed Task %
- Workload Score by Department
- On-Time Task %
- Workload Score by Month
- Completed Task by Task Type
-
Right-Side Slicer:
Enables you to filter data instantly based on parameters such as department, time period, or task type.
Charts:
Visuals make data easy to understand and compare:
- Completed Task %
- Workload Score by Department
- On-Time Task %
- Workload Score by Month
- Completed Task by Task Type
Report Page
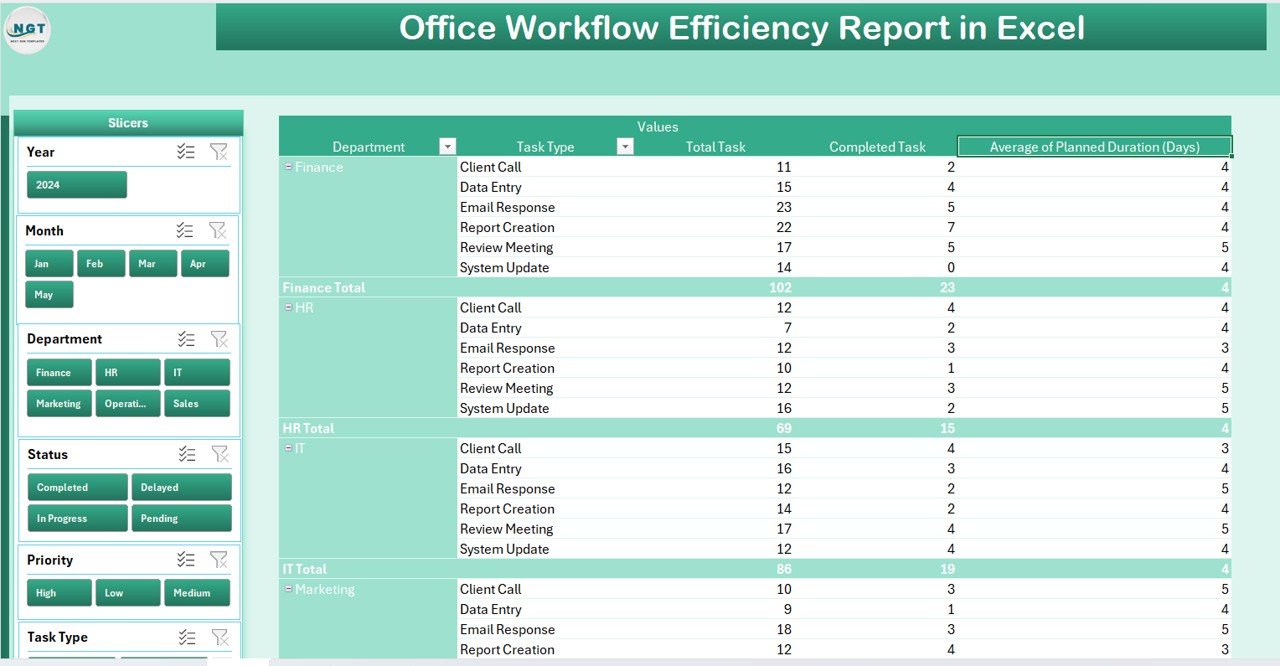
The Report Page provides detailed breakdowns for deeper analysis.
-
Left-Side Slicer:
Allows filtering of data to focus on specific departments or timeframes.
Information Table:
Displays granular data such as:
- Task Name
- Assigned Department
- Task Start Date and End Date
- Assigned Person
- Completion Status
- On-Time or Delayed Flag
Data Sheet
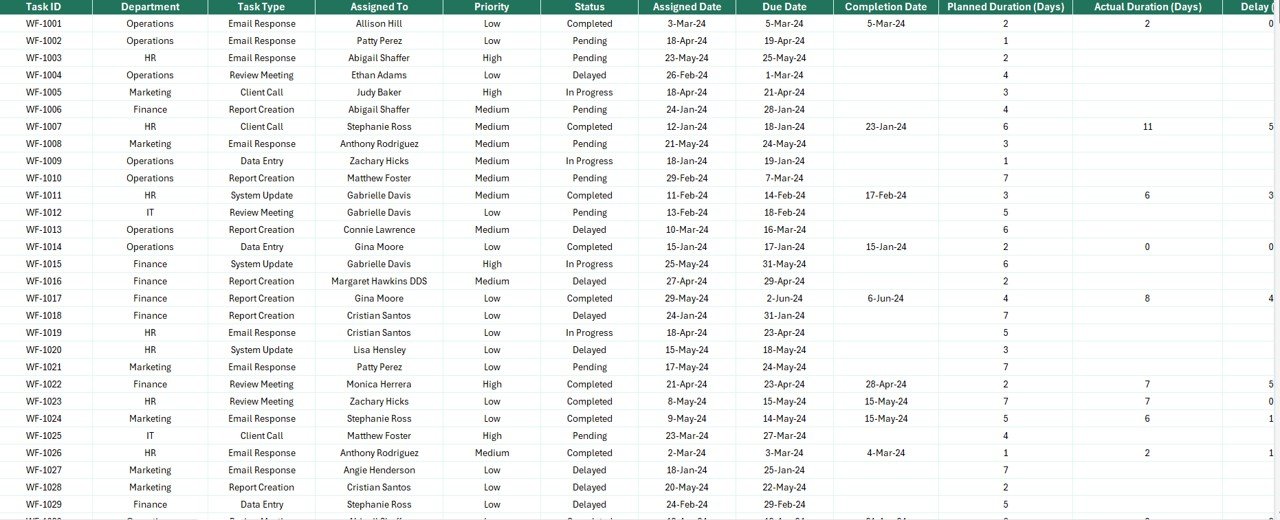
The Data Sheet contains raw data that powers the visualizations and summaries.
Here you can:
-
Add new records.
-
Update existing data.
-
Import from external systems.
Click to Purchases Office Workflow Efficiency Report in Excel
Support Sheet
The Support Sheet contains reference lists, dropdown values, and configuration settings for slicers and charts. This ensures the template is flexible and easy to update.
Why Use the Office Workflow Efficiency Report?
A well-structured workflow report can transform how you manage productivity. Without it, managers often face issues like:
-
Unclear workload distribution.
-
Difficulty tracking delayed tasks.
-
Lack of visibility on departmental performance.
-
Overlooked recurring bottlenecks.
By using the Office Workflow Efficiency Report in Excel, you gain real-time clarity and can take proactive steps to enhance efficiency.
Advantages of the Office Workflow Efficiency Report in Excel
Here are some compelling reasons to integrate this report into your daily operations:
-
Centralized Data:
All task and performance data is stored in one place for easy reference. -
Real-Time Updates:
Automatic refresh of charts and metrics when data is updated. -
Customizable Layout:
Easily adapt metrics, slicers, and visuals to your organization’s needs. -
Better Decision-Making:
Data-driven insights help you allocate resources effectively. -
Visual Storytelling:
Charts and graphs simplify complex datasets. -
Error Reduction:
Standardized formats minimize data entry mistakes.
How to Use the Office Workflow Efficiency Report Effectively
Step 1: Gather Task Data
Before using the report, collect all relevant data such as:
-
Task names
-
Assigned departments
-
Start and end dates
-
Task types
-
Completion status
Step 2: Input Data into the Data Sheet
Enter the collected data into the Data Sheet. Make sure to follow the correct column format.
Step 3: Analyze the Summary Page
Check the cards and charts to get a quick overview of:
-
Departmental performance
-
Task completion rates
-
On-time percentages
Step 4: Drill Down in the Report Page
Use slicers to filter data by department, time period, or task type for detailed analysis.
Step 5: Take Action
Identify underperforming areas and implement targeted improvements.
Key Metrics to Track in the Office Workflow Efficiency Report
Here are the most valuable metrics this report can track:
-
Completed Task % – Measures the proportion of completed tasks.
-
Workload Score by Department – Shows task distribution across departments.
-
On-Time Task % – Indicates the rate of timely task completions.
-
Workload Score by Month – Highlights monthly workload trends.
-
Completed Task by Task Type – Helps identify which task types consume the most resources.
Opportunities for Improvement
Even though this report provides strong insights, there’s always room for optimization:
-
Automate Data Import:
Link the Excel file with project management tools to reduce manual entry. -
Add More Metrics:
Track additional KPIs like average task completion time or employee utilization rates. -
Enhance Visualization:
Use conditional formatting and dynamic colors to highlight performance trends. -
Create Department-Specific Dashboards:
Give each department a tailored view of their performance.
Best Practices for the Office Workflow Efficiency Report
To get the most from this report, follow these best practices:
-
Maintain Data Consistency:
Use standardized formats for dates, names, and status fields. -
Update Regularly:
Refresh the report at least weekly to keep insights relevant. -
Encourage Team Collaboration:
Share the report with all relevant stakeholders. -
Use Filters Wisely:
Apply slicers to zoom in on specific issues or trends. -
Document Changes:
Keep a log of any updates made to the data or structure.
Practical Use Cases
The Office Workflow Efficiency Report in Excel is useful across industries:
-
Corporate Offices:
Monitor departmental workloads and task completions. -
Project Management Teams:
Track deliverables against deadlines. -
Customer Support Departments:
Ensure service requests are handled promptly. -
Human Resources:
Manage recruitment, onboarding, and training tasks efficiently.
Conclusion
The Office Workflow Efficiency Report in Excel is more than just a spreadsheet—it is a complete solution for monitoring, analyzing, and improving productivity in any office setting. By combining structured data entry, interactive dashboards, and insightful visualizations, it empowers managers and teams to make informed decisions that lead to higher efficiency.
When used consistently and combined with the best practices outlined in this guide, this report can become an indispensable part of your business operations.
Frequently Asked Questions (FAQs)
1. Can I customize the Office Workflow Efficiency Report in Excel?
Yes, you can easily add or remove charts, modify slicers, and change the layout to fit your needs.
2. Do I need advanced Excel skills to use this template?
Not necessarily. Basic Excel skills are enough to input data and use slicers, though advanced users can unlock more customization.
3. How often should I update the data?
Weekly updates are ideal for most teams, but high-activity environments may require daily updates.
4. Can this report track multiple projects?
Yes, as long as you include relevant project identifiers in your data, the report can track multiple projects simultaneously.
5. Does it work on Mac and Windows versions of Excel?
Yes, it is compatible with both Mac and Windows, though some features like slicers work best on the latest versions.
Visit our YouTube channel to learn step-by-step video tutorials

