In today’s competitive world, customer feedback is the foundation of growth for every industry. For construction and real estate businesses, listening to customers is even more critical. Projects involve huge investments, long timelines, and high expectations. A small gap in understanding client needs can result in major financial losses, delays, or reputational damage.
This is where a Customer Feedback KPI Dashboard in Excel becomes an essential tool. With a ready-to-use Excel-based dashboard, businesses can track satisfaction levels, analyze performance trends, and compare actual results against targets in real-time.
In this article, we will explore the features, structure, advantages, best practices, and FAQs about the Construction and Real Estate Customer Feedback KPI Dashboard in Excel.
Click to Purchases Construction and Real Estate Customer Feedback KPI Dashboard in Excel
What is a Customer Feedback KPI Dashboard in Excel?
A Customer Feedback KPI Dashboard in Excel is a pre-built template designed to capture, organize, and analyze customer feedback for construction and real estate projects. It provides an interactive interface where managers can measure satisfaction levels, response time, issue resolution rate, and many other key performance indicators (KPIs).
Instead of managing scattered surveys or manual reports, this dashboard consolidates everything into a single file, making it easier to:
-
Track Month-to-Date (MTD) and Year-to-Date (YTD) performance.
-
Compare Actuals vs Targets vs Previous Year.
-
Highlight improvement areas through visual indicators.
-
Monitor feedback trends over time.
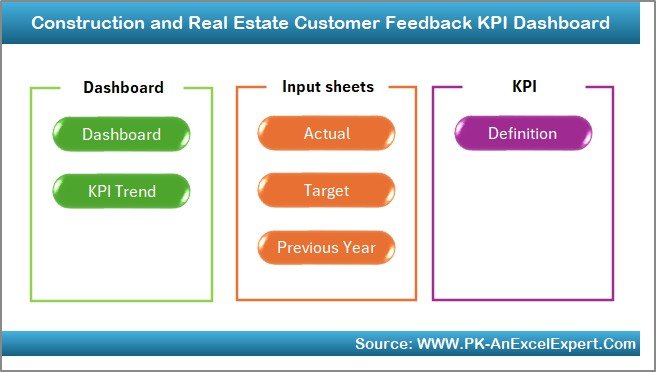
Structure of the Construction and Real Estate Customer Feedback KPI Dashboard
The dashboard is designed with seven interconnected worksheets, each with a specific purpose. Let’s go through them one by one:
Home Sheet
-
Acts as the index page of the dashboard.
-
Includes 6 navigation buttons to quickly jump to other sheets.
-
Makes the file user-friendly and structured.
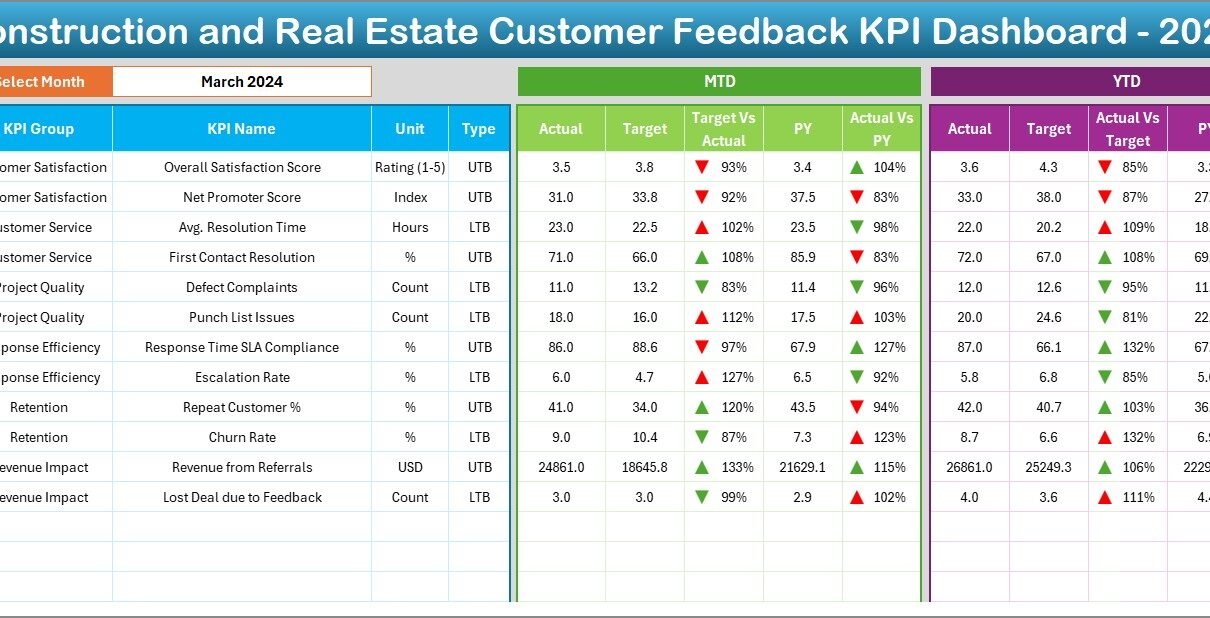
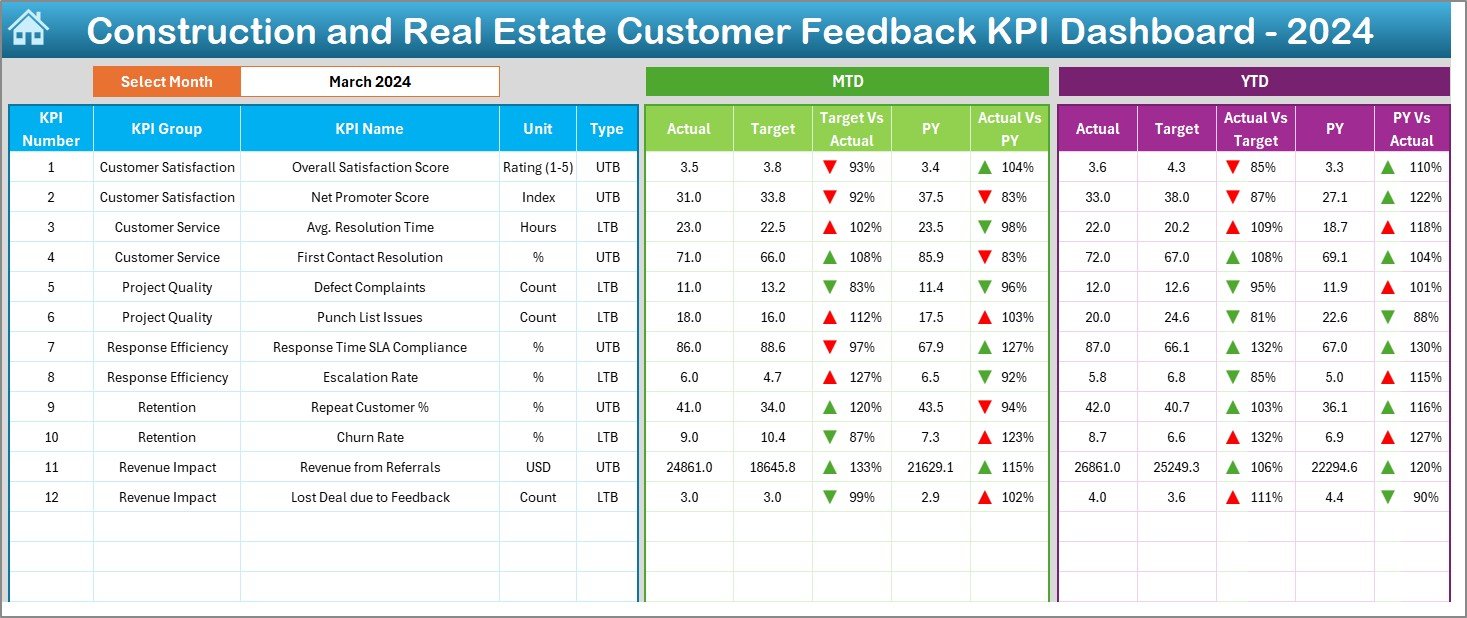
Dashboard Sheet
-
The core of the system, showing consolidated KPIs.
-
On cell D3, users can select a month from a drop-down.
-
Automatically updates all figures for the selected period.
-
Displays MTD Actual, Target, and Previous Year (PY) data.
-
Shows variance analysis (Target vs Actual, PY vs Actual) with conditional formatting like green/red arrows.
-
Includes YTD comparison for longer-term performance.
KPI Trend Sheet
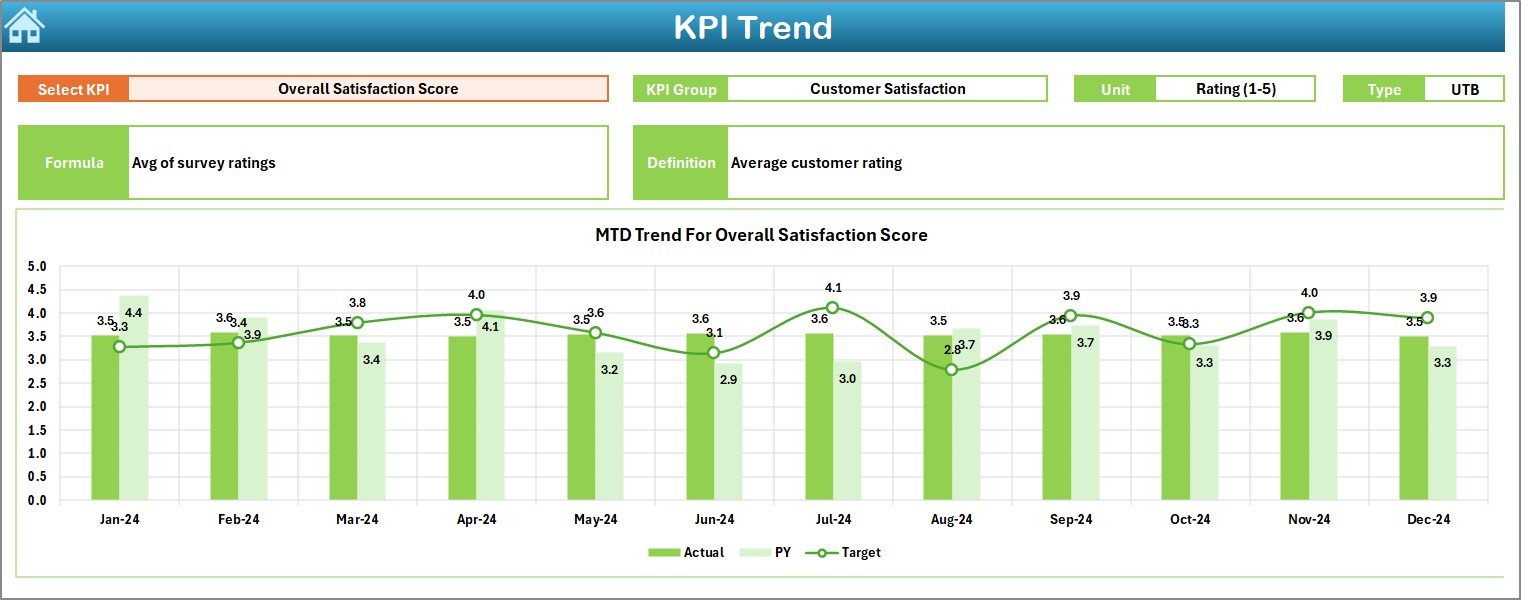
-
Allows selection of any KPI from a drop-down list in C3.
Displays KPI details:
- KPI Group
- Unit
- Type (UTB – Upper the Better or LTB – Lower the Better)
- Formula
- Definition
-
Shows MTD and YTD trend charts for Actual, Target, and PY values.
Actual Numbers Input Sheet
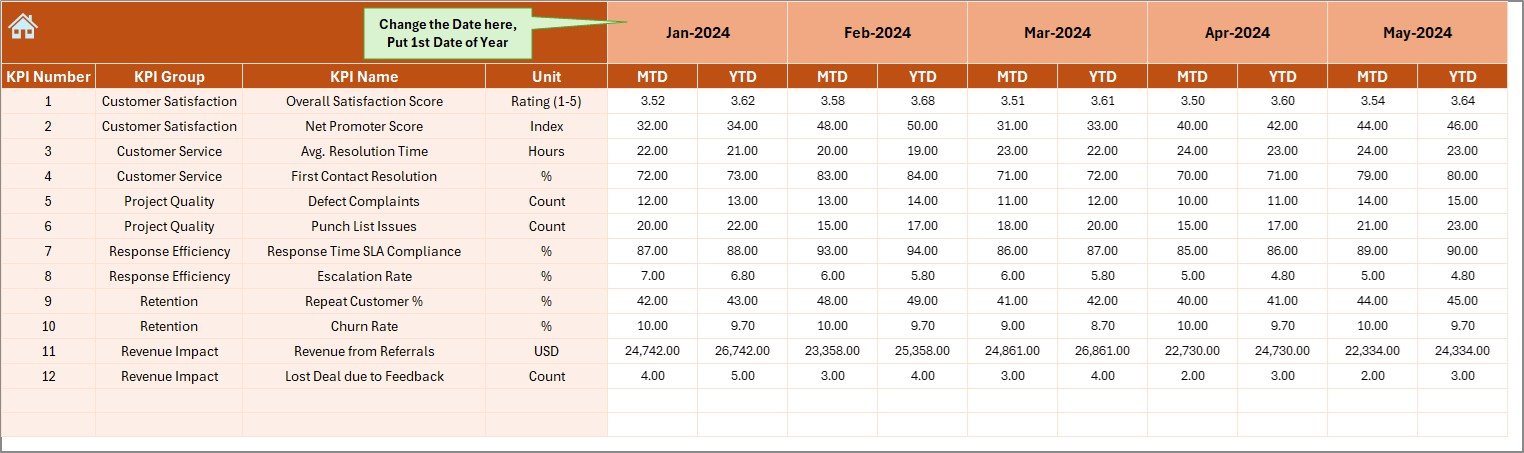
-
Designed for data entry of monthly and yearly actual results.
-
Month selection is possible from cell E1.
-
Users just input the first month of the year to set the calendar.
Target Sheet
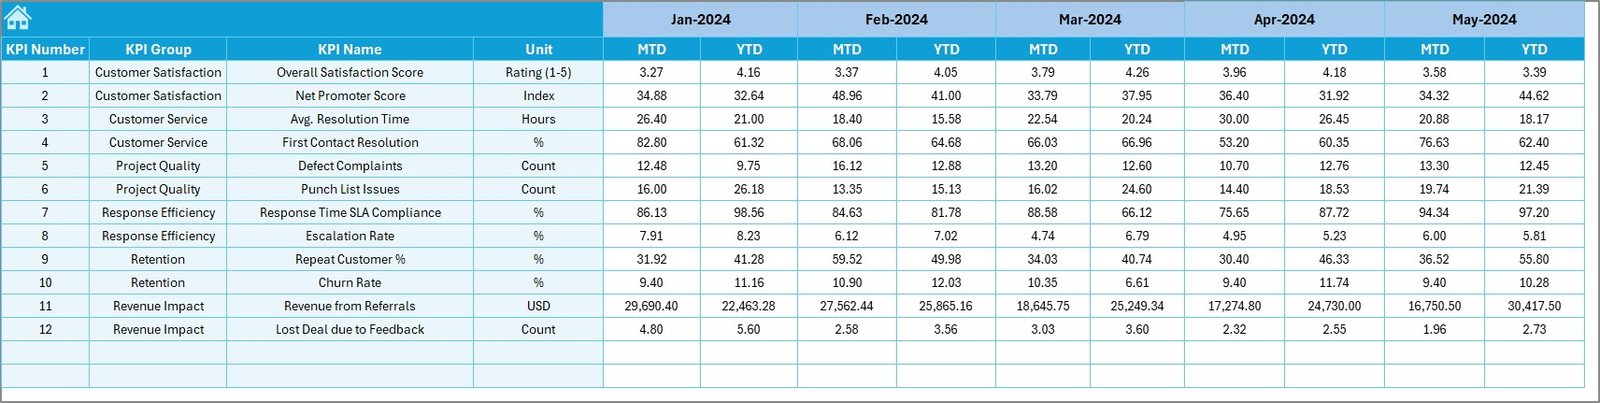
-
Stores monthly and yearly targets for each KPI.
Click to Purchases Construction and Real Estate Customer Feedback KPI Dashboard in Excel
-
Helps in setting benchmarks for comparison.
Previous Year Number Sheet
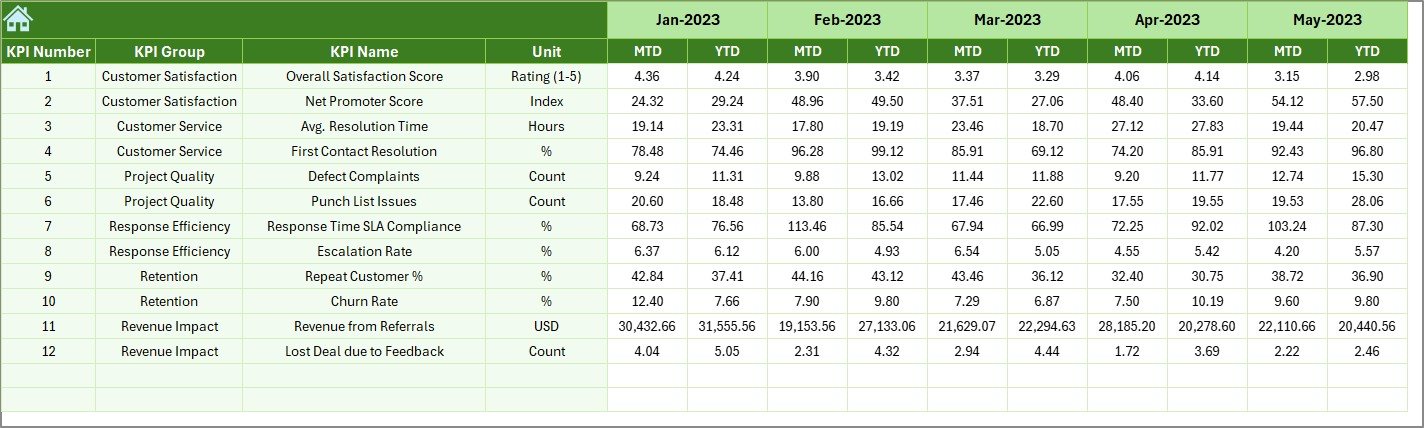
-
Keeps historical data for the previous year.
-
Used for year-over-year performance analysis.
KPI Definition Sheet
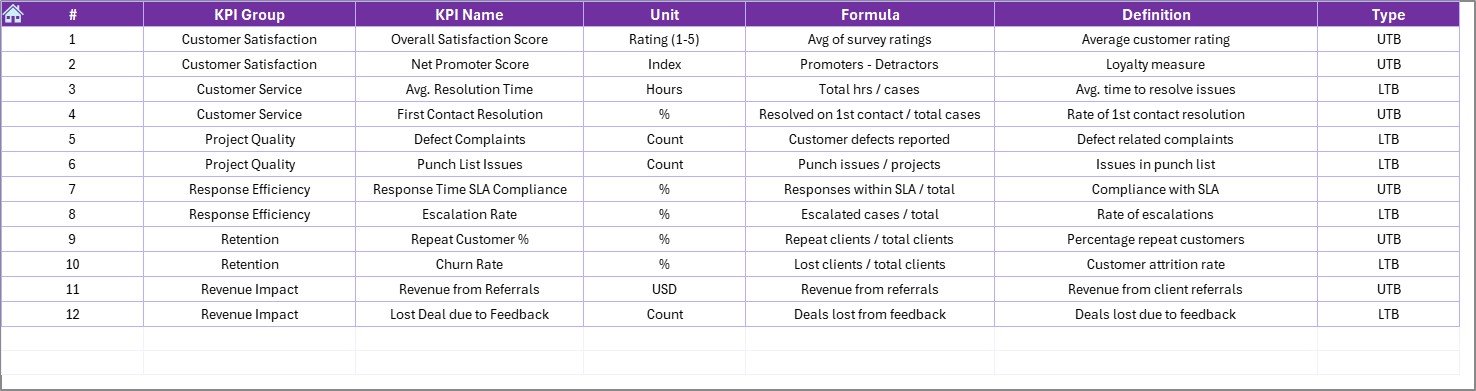
Stores metadata about KPIs, such as:
- KPI Name
- Group
- Unit
- Formula
- Definition
-
Makes the dashboard self-explanatory for all users.
Why Customer Feedback Matters in Construction and Real Estate
Customer satisfaction plays a direct role in:
-
Winning repeat projects.
-
Building long-term trust and reputation.
-
Securing referrals in a highly competitive market.
-
Improving project delivery timelines.
-
Reducing complaints and costly rework.
A Customer Feedback KPI Dashboard in Excel ensures that management never loses sight of client expectations.
Key KPIs Tracked in the Dashboard
Some of the most useful KPIs for construction and real estate customer feedback include:
-
Customer Satisfaction Score (CSAT): Percentage of satisfied clients after project delivery.
-
Net Promoter Score (NPS): Measures the likelihood of customers recommending the company.
-
Complaint Resolution Time: Average time taken to resolve customer issues.
-
On-time Delivery Rate: Percentage of projects delivered within the promised timeline.
-
Defect Rate: Number of reported quality issues per project.
-
Communication Effectiveness: Rating of how well updates are shared with clients.
-
Repeat Customer Percentage: Share of projects from existing clients.
-
Overall Customer Rating: General feedback score across multiple parameters.
Advantages of Construction and Real Estate Customer Feedback KPI Dashboard
Using this Excel-based dashboard provides numerous benefits:
-
Centralized Tracking: All customer-related data in one place.
-
Quick Analysis: Automated charts and variance analysis.
-
Improved Decision-Making: Managers can focus on problem areas quickly.
-
Time-Saving: Eliminates manual reporting.
-
User-Friendly: Excel-based, so no additional software required.
-
Scalable: Works for small contractors as well as large real estate firms.
-
Data Transparency: Clear records of actual vs target vs previous year performance.
-
Visual Insights: Conditional formatting helps in quick performance review.
Opportunities for Improvement in Customer Feedback Management
Even though dashboards streamline customer feedback, businesses should look for improvement in:
-
Automating Data Collection: Integrating survey tools or online forms directly into Excel.
-
Expanding KPI Coverage: Adding financial KPIs linked to customer issues (e.g., cost of rework).
-
Regular Updates: Updating KPI definitions as market expectations evolve.
-
Training Teams: Ensuring project managers know how to interpret dashboard insights.
-
Linking Feedback to Strategy: Using insights for continuous business process improvement.
Best Practices for the Construction and Real Estate Customer Feedback KPI Dashboard
To get maximum value from this dashboard, businesses should follow these best practices:
✅ Define KPIs Clearly: Make sure each KPI has a clear formula and unit.
✅ Set Realistic Targets: Targets should be ambitious yet achievable.
✅ Review Monthly: Always compare Actual vs Target and Previous Year.
✅ Use Conditional Formatting Wisely: Arrows, colors, and progress bars help in quick interpretation.
✅ Update Data Promptly: Enter actuals, targets, and PY data regularly.
✅ Share with Teams: Encourage project teams to review the dashboard, not just management.
✅ Integrate with Other Tools: Link customer surveys or CRM systems with Excel.
How Businesses Can Use This Dashboard
The dashboard is versatile and can be used by:
-
Construction Companies: To track project delivery satisfaction.
-
Real Estate Developers: To measure homebuyer happiness and referral potential.
-
Contractors: To analyze complaint trends and improve service quality.
-
Consultants: To present client-focused reports backed by data.
Conclusion
The Construction and Real Estate Customer Feedback KPI Dashboard in Excel is more than a reporting tool. It acts as a decision-making partner for businesses aiming to improve customer satisfaction, build trust, and deliver high-quality projects on time.
By using structured KPIs, automated variance analysis, and visual insights, businesses can stay ahead of competition while meeting client expectations consistently.
Frequently Asked Questions (FAQs)
1. What is a Customer Feedback KPI Dashboard in Excel?
It is an Excel-based tool that captures, tracks, and analyzes customer satisfaction KPIs for construction and real estate projects.
2. How does this dashboard help construction companies?
It helps in monitoring satisfaction, complaint resolution, repeat business, and delivery timelines. This supports better decision-making and client relationships.
3. Do I need advanced Excel knowledge to use this dashboard?
No. The dashboard is user-friendly, with drop-downs, charts, and automated calculations that make it easy for anyone to use.
4. What kind of KPIs can be tracked?
KPIs such as CSAT, NPS, complaint resolution time, defect rate, on-time delivery rate, and repeat customer percentage can be tracked.
5. Can I customize the dashboard?
Yes. Since it is built in Excel, you can add or modify KPIs, update targets, and expand charts based on your needs.
6. How often should I update the data?
It is recommended to update data monthly, but you can also track it weekly or quarterly depending on project timelines.
7. Can this dashboard replace CRM systems?
No. CRM systems are broader. This dashboard is ideal for feedback analysis and KPI monitoring, not for complete customer management.
8. Who can benefit from this dashboard?
Construction managers, real estate developers, contractors, and consultants who want to measure and improve customer satisfaction.
Visit our YouTube channel to learn step-by-step video tutorials