Employee development is a key driver of organizational growth. Tracking training programs, measuring completion rates, feedback scores, and training hours is essential for HR and learning & development teams.
Our Training and Development Report in Excel is a ready-to-use tool designed to simplify tracking, reporting, and analysis of all training activities. In this article, we will explain its features, benefits, and best practices to make the most of this report.
What is a Training and Development Report?
A Training and Development Report in Excel allows organizations to monitor all learning initiatives systematically. With Excel’s powerful analytics and visualization capabilities, this report provides:
-
Centralized Data: All training information in one file.
-
Interactive Analysis: Use pivot tables, charts, and slicers for insights.
-
Real-Time Tracking: Monitor training progress as data updates.
-
Performance Measurement: Evaluate employee engagement, trainer efficiency, and training outcomes.
This report is ideal for HR professionals, learning and development managers, and training coordinators who want to ensure that training initiatives are impactful and aligned with organizational goals.
Key Features of the Training and Development Report
Click to Buy Training and Development Report in Excel
The report consists of 3 worksheet tabs, each serving a distinct purpose:
1. Summary Sheet Tab
The Summary Sheet is the main overview page, providing a snapshot of training performance.
Cards Section:
-
Total Trainings Conducted: Number of trainings held in the selected period.
-
Total Training Hours: Sum of all hours spent on training programs.
-
Avg. Feedback Score: Average participant feedback rating.
-
Avg. Training Duration (Hours): Mean duration of training sessions.
-
In Progress Training: Trainings that are ongoing and yet to be completed.
Charts Section:
-
Certification Rate (%): Percentage of participants who achieved certification.
-
Total Trainings Conducted by Training Type: Visual breakdown by type (e.g., Technical, Soft Skills, Compliance).
-
Completed Trainings (%): Track the proportion of completed training programs.
-
Total Trainings Conducted by Month: Monthly trend of training activities.
-
Total Trainings Conducted by Trainer Name: Insights into trainer contribution and performance.
This sheet provides a quick snapshot of overall training effectiveness, allowing managers to make data-driven decisions.

Click to Buy Training and Development Report in Excel
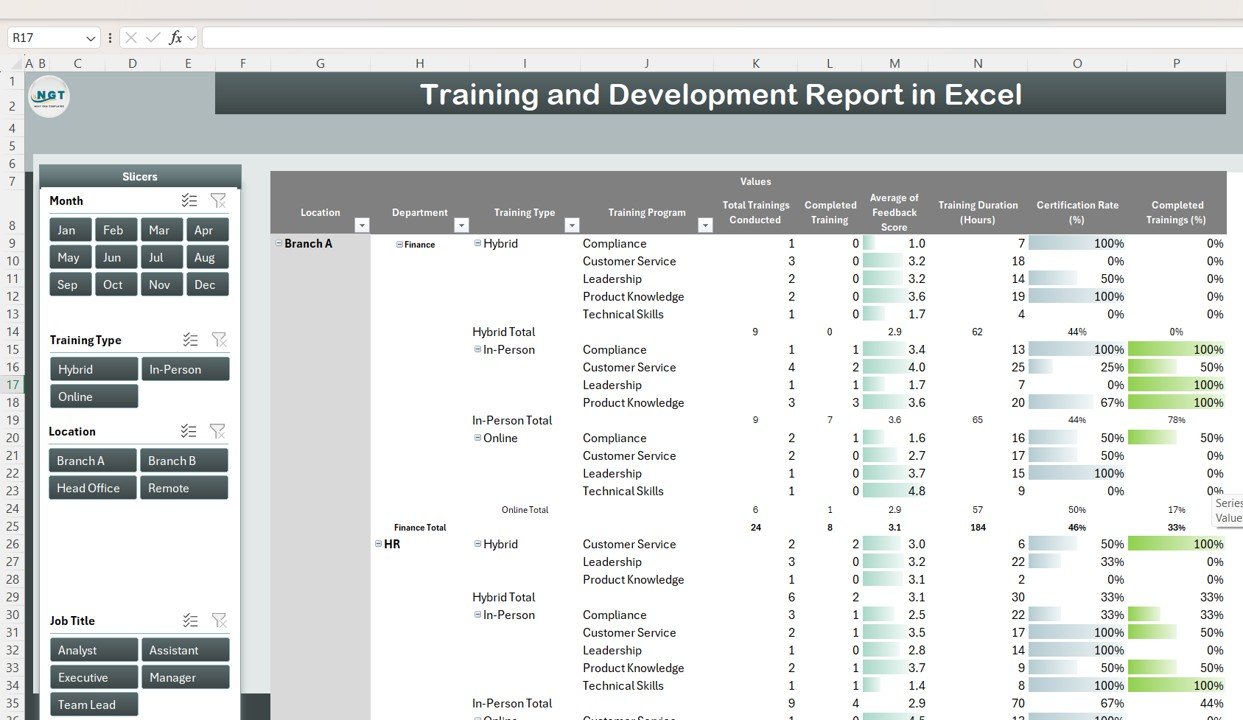
2. Report Sheet Tab
The Report Sheet leverages Power Pivot features to provide advanced analytics and interactive reporting.
Key Features:
-
Pivot Tables: Summarize data by employee, training type, department, or trainer.
-
Interactive Slicers: Filter data dynamically by month, training type, or status.
-
Trend Analysis: Compare training performance across months or departments.
-
Detailed Drill-Down: Click on a summary figure to view underlying participant-level data.
This sheet is ideal for in-depth reporting, enabling HR teams to identify training gaps, high-performing trainers, and areas requiring improvement.
Click to Buy Training and Development Report in Excel
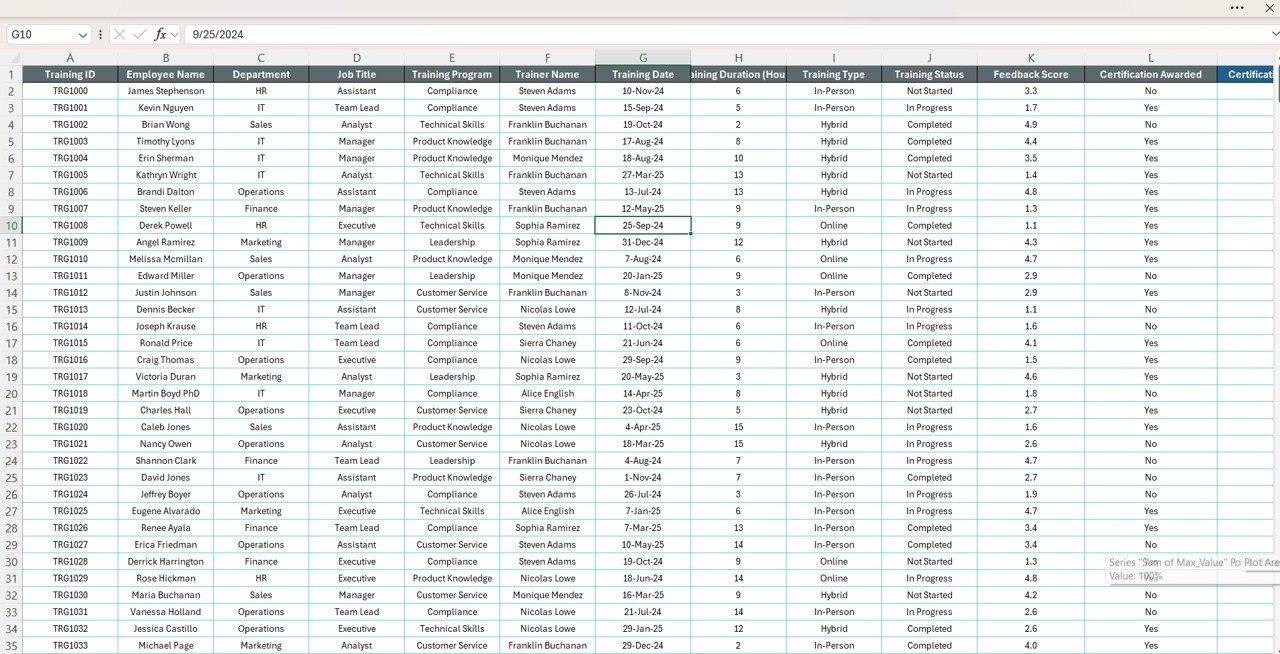
3. Data Sheet Tab
The Data Sheet serves as the backend input sheet, where all training information is stored.
Key Features:
-
Record all training details: Training Name, Training Type, Trainer, Date, Duration, Number of Participants, Feedback Score, Certification Status, and Department.
-
Updates in this sheet automatically reflect in the Summary and Report sheets.
-
Ensures centralized data management and consistency for reporting.
This structure guarantees that the dashboard and reports are always up-to-date, providing real-time analytics without manual calculations.
Click to Buy Training and Development Report in Excel
Benefits of Using the Training and Development Report
-
Monitor Employee Development: Track training completion, hours, and feedback efficiently.
-
Identify Skill Gaps: Highlight departments or employees needing additional training.
-
Measure Training Effectiveness: Evaluate the impact of programs using feedback scores and certification rates.
-
Optimize Training Investment: Monitor costs and duration to allocate resources effectively.
-
Interactive Reporting: Use pivot tables and charts for actionable insights.
Opportunities for Improvement
-
Automate Feedback Collection: Integrate Google Forms or Microsoft Forms to feed feedback directly into the Excel report.
-
Add Conditional Formatting: Highlight low feedback scores or overdue training programs.
-
Trend Analysis: Compare training hours and completion rates month-over-month.
-
Departmental Comparison: Analyze which departments require more training focus.
-
Interactive Dashboards: Use slicers for quick filtering by trainer, type, or department.
Best Practices
Click to Buy Training and Development Report in Excel
-
Regular Data Entry: Keep the data sheet updated after every training session.
-
Track Feedback Scores: Collect participant feedback consistently to evaluate training quality.
-
Monitor Certification Rates: Ensure training outcomes align with organizational goals.
-
Review Trends Periodically: Monthly or quarterly review of training effectiveness ensures timely interventions.
-
Use the Summary Sheet: Leverage the cards and charts to make quick management decisions.
Conclusion
The Training and Development Report in Excel is a comprehensive tool for HR and L&D teams to:
-
Monitor training activities and completion rates
-
Measure participant engagement and trainer performance
-
Optimize training programs for better ROI
-
Make informed decisions based on real-time data
By combining summary cards, charts, and Power Pivot analytics, this report ensures that organizations can track, analyze, and improve their training initiatives efficiently.
Visit our YouTube channel to learn step-by-step video tutorials
Click to Buy Training and Development Report in Excel