Nonprofit organizations play a critical role in society by addressing social, cultural, educational, and humanitarian needs. However, they often struggle with limited resources, multiple programs, and accountability to donors and stakeholders. To thrive, nonprofits need to measure their performance, track funds, and monitor program impact effectively.
This is where a Nonprofit Organizations Dashboard in Excel becomes a powerful solution. With this tool, nonprofits can centralize their data, gain real-time insights, and present a clear picture of their activities.
In this article, we will explore what this dashboard is, its key features, benefits, best practices, and how it can help nonprofit organizations achieve their mission with greater efficiency.
Click to Purchases Nonprofit Organizations Dashboard in Excel
What Is a Nonprofit Organizations Dashboard in Excel?
A Nonprofit Organizations Dashboard in Excel is a data visualization and performance tracking tool. It consolidates program, region, and manager-level data into interactive pages that are easy to understand.
Unlike static reports, this dashboard enables real-time updates, comparisons, and insights across various dimensions like:
-
Program Performance (completed vs ongoing)
-
Donor Contributions (funds received vs utilized)
-
Impact Satisfaction (beneficiary feedback)
-
Regional and Managerial Analysis
-
Monthly Trends (program growth and fund utilization)
By using Excel’s built-in features like slicers, pivot tables, and charts, nonprofits can analyze large datasets and make informed decisions without needing advanced software.
Key Features of the Nonprofit Organizations Dashboard
This ready-to-use Excel dashboard comes with a Page Navigator on the left side and multiple analytical pages for different insights. Let’s break it down:
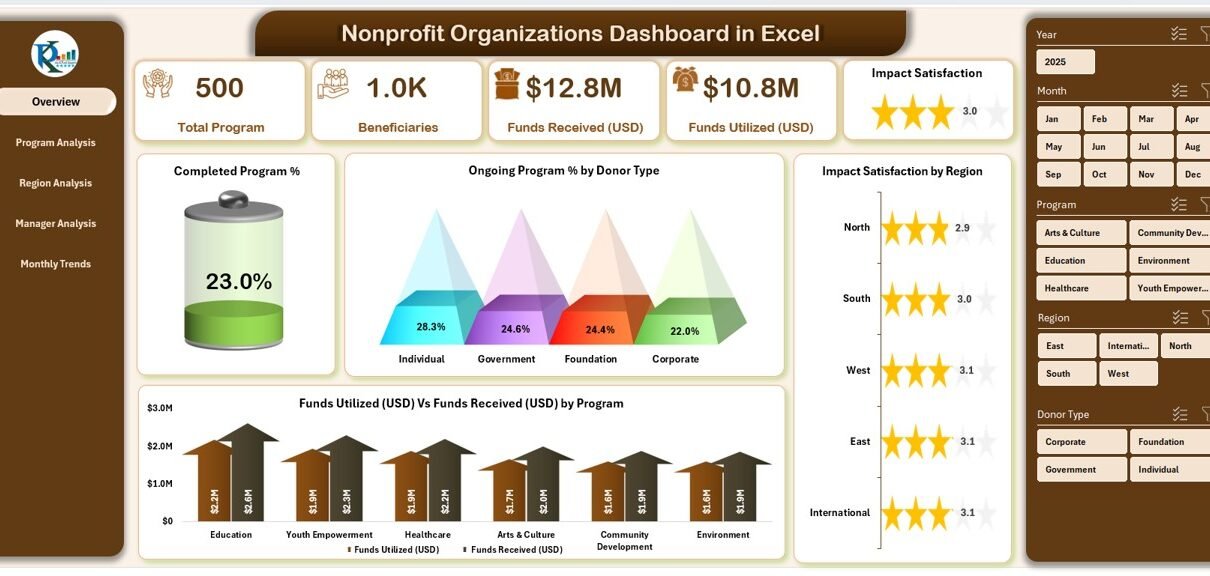
Overview Page
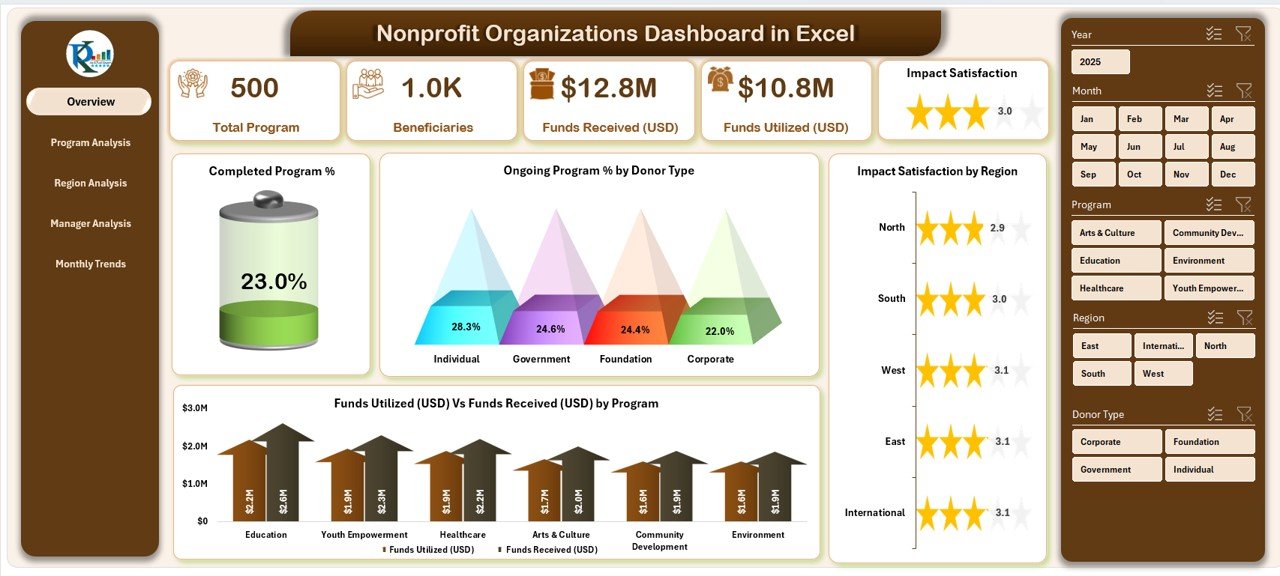
The Overview Page serves as the central hub of the dashboard. It includes:
-
5 Key Cards: Quick stats on program completion and donor performance.
Charts:
- Completed Program %
- Ongoing Program % by Donor Type
- Impact Satisfaction by Region
- Funds Utilized (USD) vs Funds Received (USD) by Program
Program Analysis
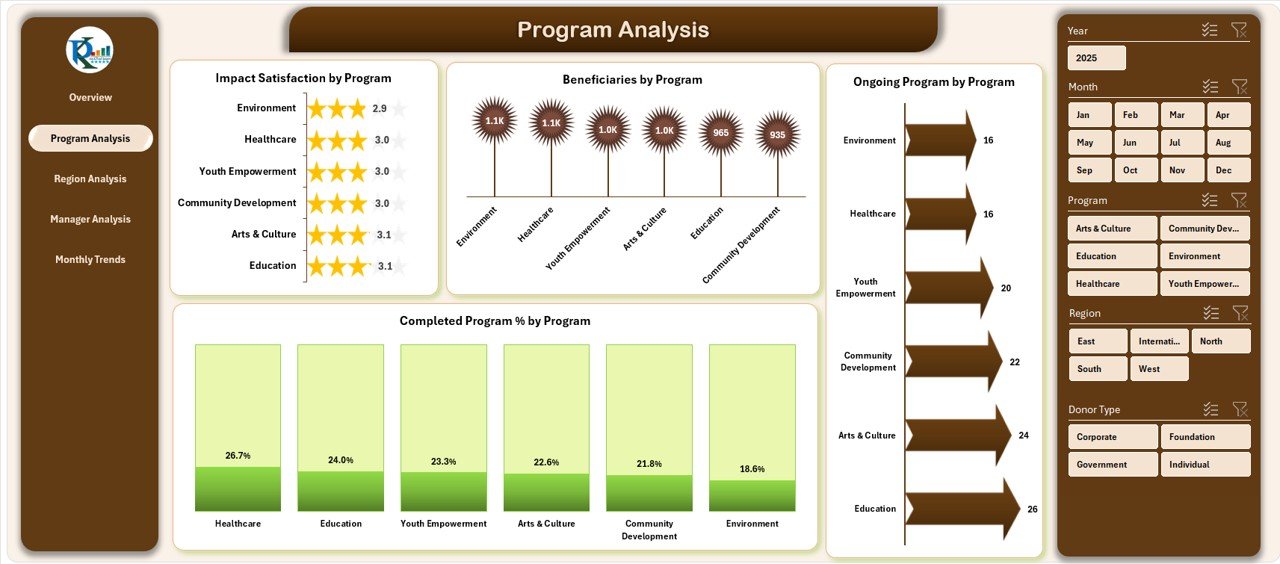
This page provides deep insights into how each program performs.
Charts:
- Impact Satisfaction by Program
- Beneficiaries by Program
- Completed Program % by Program
Region Analysis
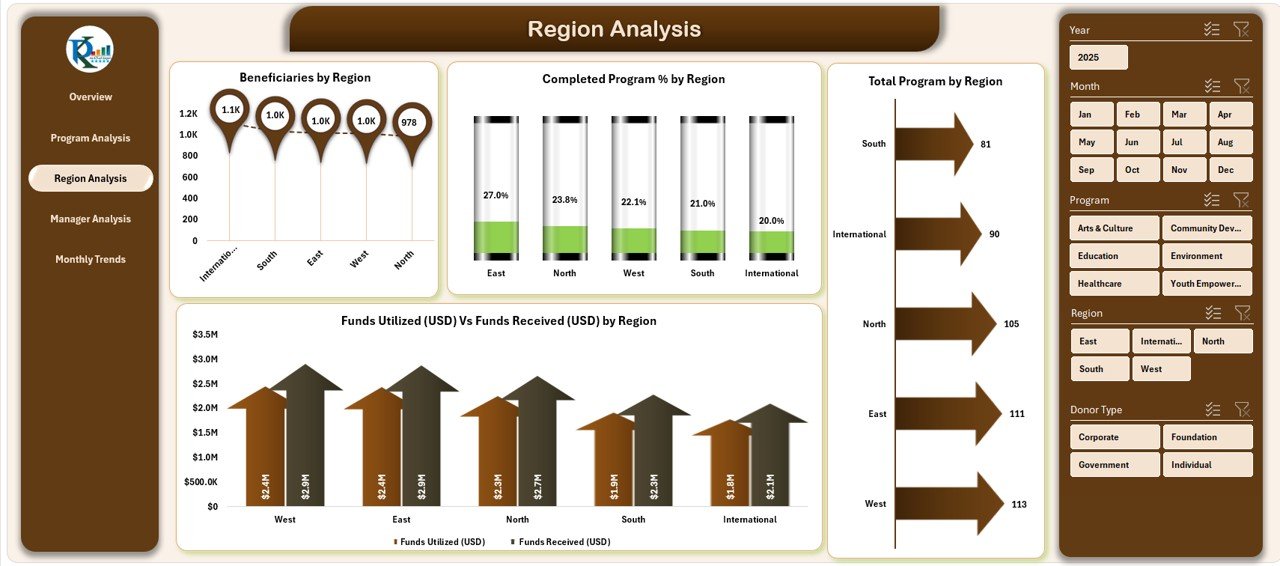
Regional analysis is crucial for nonprofits working across multiple locations.
Click to Purchases Nonprofit Organizations Dashboard in Excel
Charts:
- Beneficiaries by Region
- Completed Program % by Region
- Total Program by Region
- Funds Utilized vs Funds Received by Region
Manager Analysis
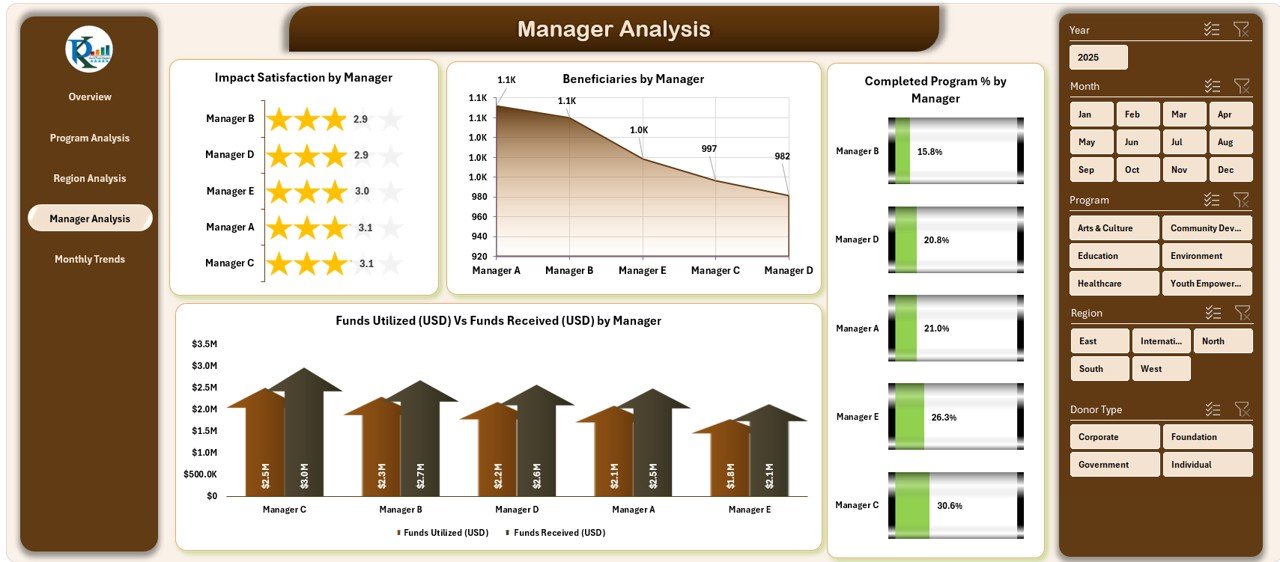
Managers play a key role in nonprofit success. This page tracks performance by manager.
Charts:
- Impact Satisfaction by Manager
- Beneficiaries by Manager
- Completed Program % by Manager
- Funds Utilized vs Funds Received by Manager
Monthly Trends
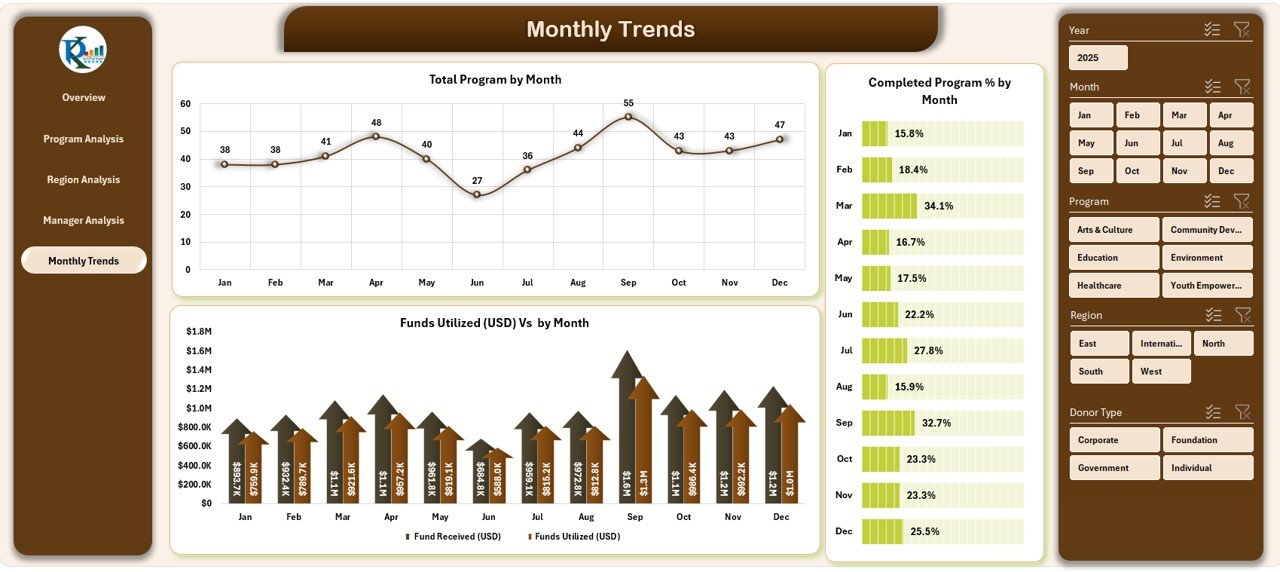
Monitoring performance over time helps nonprofits stay consistent.
Charts:
- Total Program by Month
- Completed Program % by Month
- Funds Utilized vs Funds Received by Month
Why Do Nonprofits Need a Dashboard in Excel?
Many nonprofits rely on spreadsheets for record-keeping, but data often becomes scattered and difficult to analyze. A dashboard solves this problem by:
-
Centralizing all program and financial data in one place.
-
Creating interactive visuals instead of static tables.
-
Allowing leadership to make data-driven decisions.
-
Increasing transparency for donors and stakeholders.
-
Saving time and resources spent on manual reporting.
Advantages of a Nonprofit Organizations Dashboard
Here are the key advantages:
1. Improved Transparency
Donors and stakeholders want proof of how their contributions are used. The dashboard shows exactly how funds are allocated and utilized.
2. Better Decision-Making
With real-time data, leaders can quickly identify which programs need more support or funding.
3. Efficient Fund Management
Comparing funds received vs utilized helps reduce waste and ensures accountability.
4. Enhanced Impact Measurement
Charts showing impact satisfaction and beneficiary numbers help nonprofits measure success.
5. Time-Saving Automation
Instead of creating manual reports, teams can update the dashboard and get instant results.
Best Practices for Using the Dashboard
To maximize the value of the Nonprofit Organizations Dashboard in Excel, follow these best practices:
1. Keep Data Clean and Updated
-
Regularly input accurate program and financial data.
-
Use dropdowns and lists to avoid manual entry errors.
2. Use Standardized Metrics
-
Define clear KPIs like Completion %, Impact Satisfaction %, Fund Utilization %.
-
Use consistent units (e.g., USD for funds, number of beneficiaries).
3. Train Your Team
-
Ensure staff understand how to use slicers and charts.
-
Provide simple training sessions to build confidence.
4. Share with Stakeholders
-
Export charts into reports for donor presentations.
-
Use the dashboard during board meetings to showcase performance.
5. Review Monthly
-
Regularly track progress through the Monthly Trends page.
-
Compare performance with previous months to identify growth.
How Does the Dashboard Help Nonprofit Growth?
The dashboard does more than track numbers. It:
-
Builds trust with donors.
-
Attracts more funding by proving impact.
-
Improves operational efficiency.
-
Helps scale programs to more regions.
By using this Excel-based solution, nonprofits can balance accountability and efficiency while focusing on their mission.
Conclusion
The Nonprofit Organizations Dashboard in Excel is more than a reporting tool. It is a complete performance management solution designed for transparency, accountability, and growth. With its easy-to-use design, nonprofits can track programs, manage funds, measure impact, and present clear reports to donors and stakeholders.
By adopting this dashboard, nonprofits not only improve internal efficiency but also strengthen donor trust, which ultimately helps them achieve their mission.
Frequently Asked Questions (FAQs)
1. What is a Nonprofit Organizations Dashboard in Excel?
It is an Excel-based tool that helps nonprofits track program performance, funds, impact satisfaction, and regional analysis using interactive charts and slicers.
2. Can small nonprofits use this dashboard?
Yes, even small organizations can benefit as it is affordable, easy to use, and does not require advanced technical skills.
3. How does the dashboard improve donor relations?
It provides clear visuals of fund utilization, program completion, and beneficiary impact, increasing transparency and donor trust.
4. Do I need advanced Excel skills to use it?
No. Basic knowledge of Excel is enough. The dashboard comes with slicers, pre-built charts, and easy-to-navigate pages.
5. How often should nonprofits update the dashboard?
Ideally, update it monthly or after major program activities to keep data accurate and useful.
Visit our YouTube channel to learn step-by-step video tutorials