Managing office furniture might not seem like a priority at first glance, but when organizations deal with hundreds or even thousands of assets across multiple locations, tracking furniture becomes a real challenge. Companies must know where their furniture is located, its condition, how much it costs, and whether it needs repair or replacement. Without a proper system, businesses risk overspending, underutilizing resources, and facing operational inefficiencies.
This is where an Office Furniture Inventory Dashboard in Power BI makes all the difference. Built on top of an Excel dataset, this dashboard allows businesses to track furniture-related costs, usage, condition, and vendor performance in a highly visual and interactive way. Unlike static reports, the Power BI dashboard updates dynamically, giving real-time insights for better decision-making.
In this article, we will explore:
Click to Purchases Office Furniture Inventory Dashboard in Power BI
-
What the Office Furniture Inventory Dashboard is.
-
The structure of the dashboard with its five pages.
-
The advantages of using Power BI for office asset management.
-
Best practices for setting up and using the dashboard.
-
Common FAQs to guide first-time users.
By the end, you’ll clearly understand why this dashboard is a valuable tool for facility managers, finance teams, and decision-makers.
What Is an Office Furniture Inventory Dashboard in Power BI?
An Office Furniture Inventory Dashboard in Power BI is a ready-to-use reporting solution designed to provide a centralized view of furniture data. The underlying data is maintained in an Excel file, which Power BI connects to, processes, and visualizes.
Instead of scrolling through endless spreadsheets, users can view charts, KPIs (Key Performance Indicators), and trends across different dimensions such as department, category, vendor, and time.
Key insights include:
-
Total Cost (USD) of furniture assets.
-
Repair Needed %, showing items requiring maintenance.
-
In Use %, highlighting utilization levels.
-
Condition % across departments and categories.
-
Disposed Items % and vendor performance analysis.
-
Monthly Trends for cost, repairs, and disposals.
Structure of the Dashboard
The Office Furniture Inventory Dashboard consists of five interactive pages in the Power BI file. Each page focuses on a specific area of analysis.
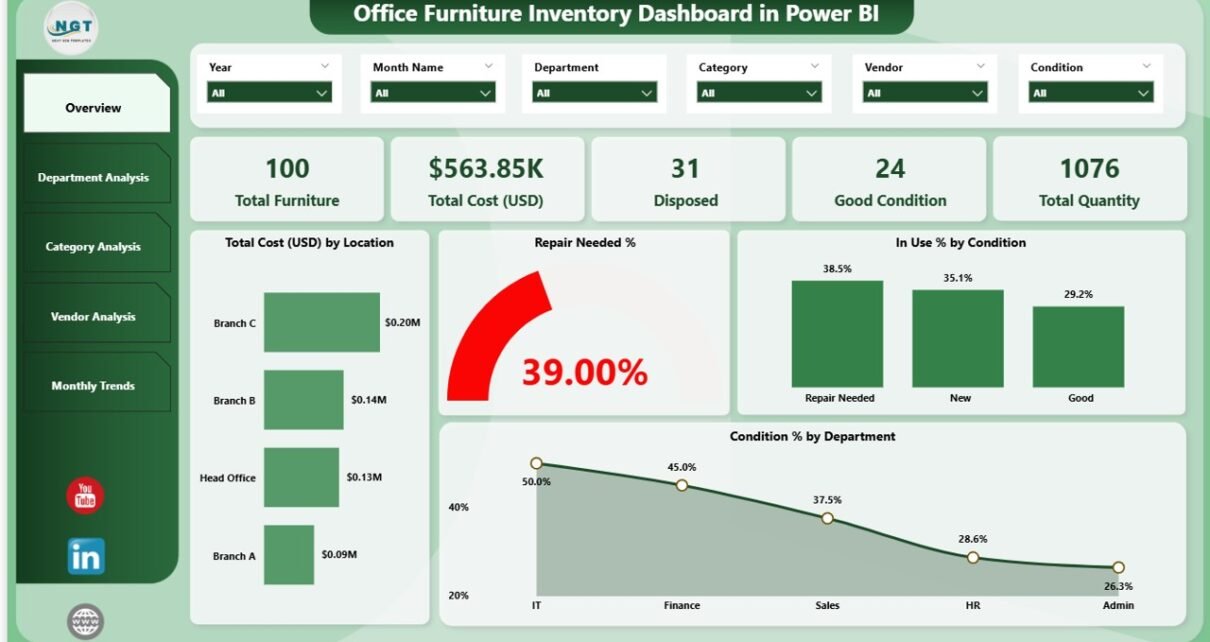
Overview Page
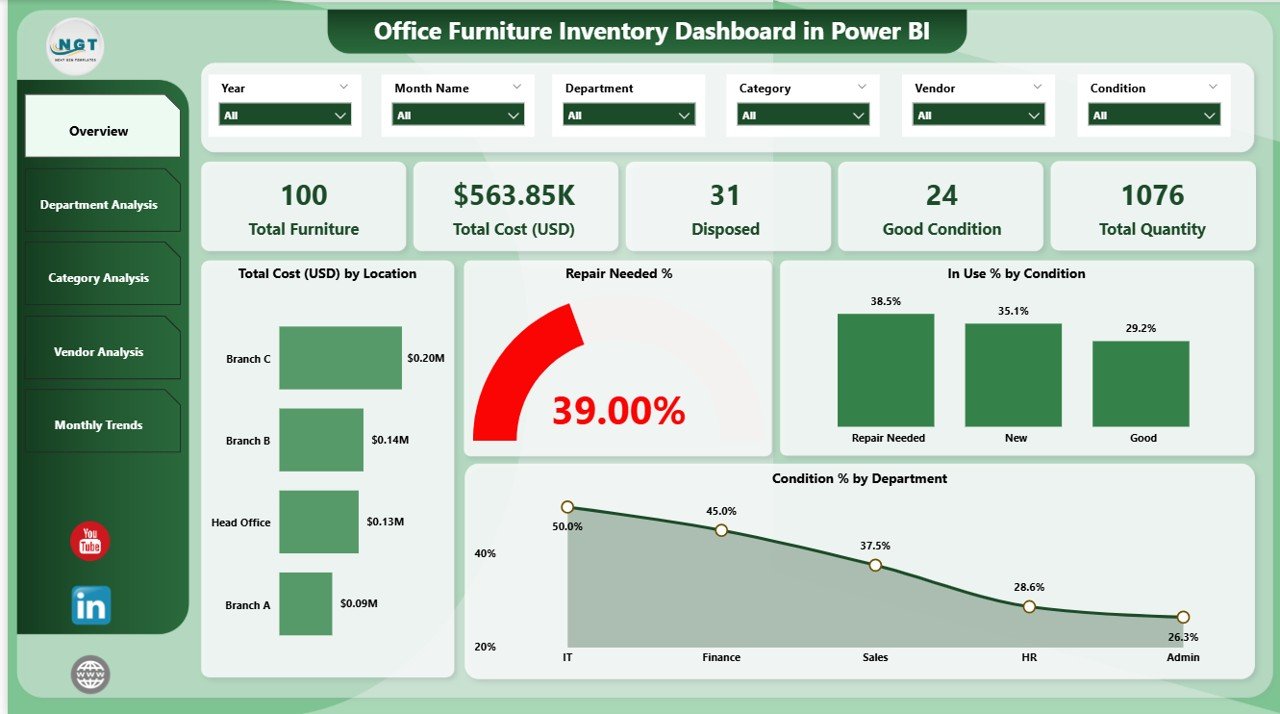
The Overview page acts as the control center for the dashboard.
-
5 KPI Cards: These cards summarize critical information such as Total Cost, Repair Needed %, In Use %, Disposed %, and Good Condition %.
4 Charts for Snapshot Analysis:
- Total Cost (USD) by Location.
- Repair Needed % by Condition.
- In Use % by Condition.
- Condition % by Department.
This page gives decision-makers a quick health check of office furniture across the organization.
Department Analysis
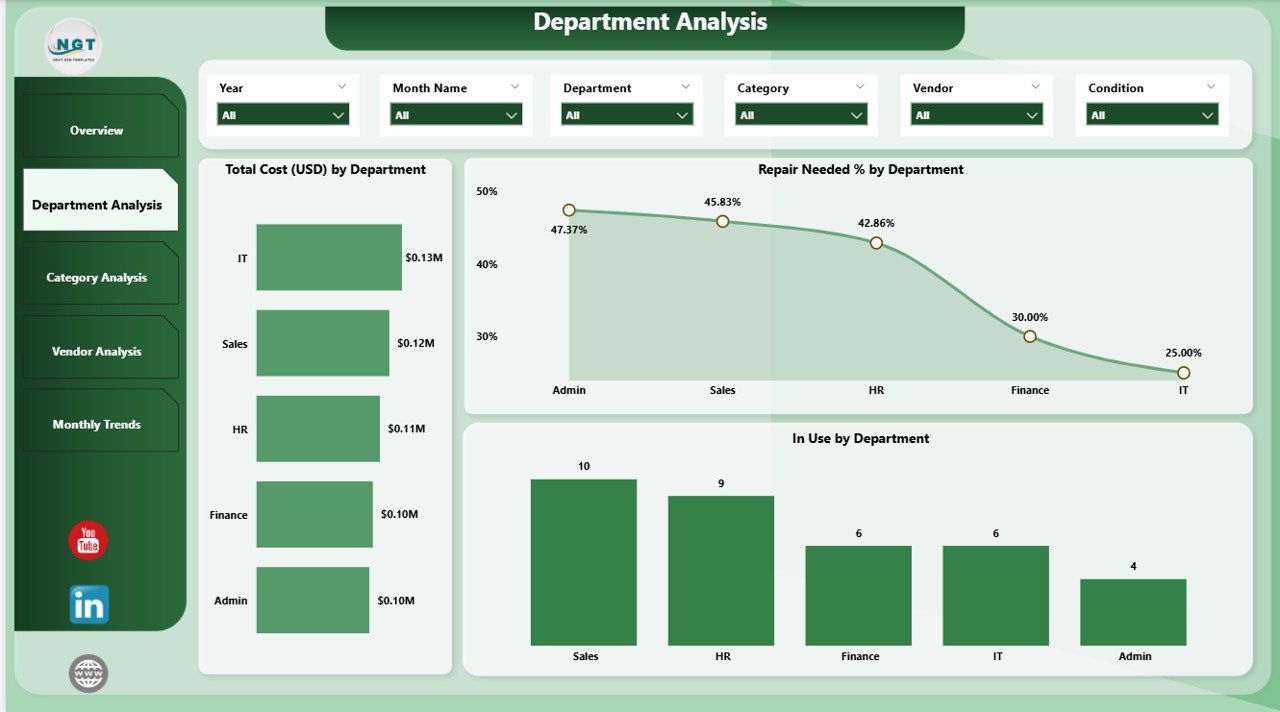
The Department Analysis page dives deeper into how each department manages its assets.
-
Total Cost (USD) by Department: Identifies cost distribution across teams.
-
Repair Needed % by Department: Highlights departments with higher maintenance requirements.
-
In Use by Department: Shows how actively different teams use their allocated furniture.
This view helps managers identify cost-heavy departments, monitor usage patterns, and take corrective actions.
Click to Purchases Office Furniture Inventory Dashboard in Power BI
Category Analysis
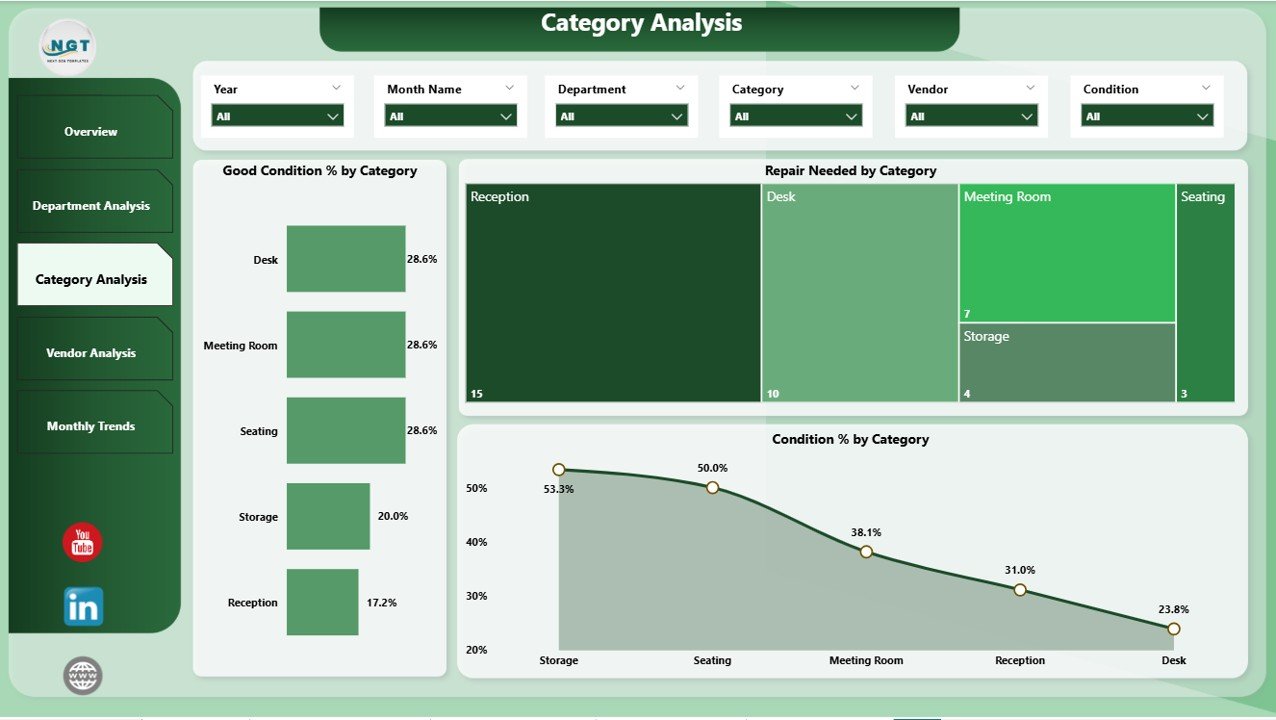
Furniture categories like desks, chairs, storage units, and meeting tables often differ in usage and lifecycle. The Category Analysis page tracks these variations.
-
Good Condition % by Category: Displays categories with long-lasting quality.
-
Repair Needed by Category: Flags categories frequently requiring repairs.
-
Condition % by Category: Gives an overall distribution of asset health.
This page supports purchasing and budgeting decisions by pinpointing which categories deliver the most value.
Vendor Analysis
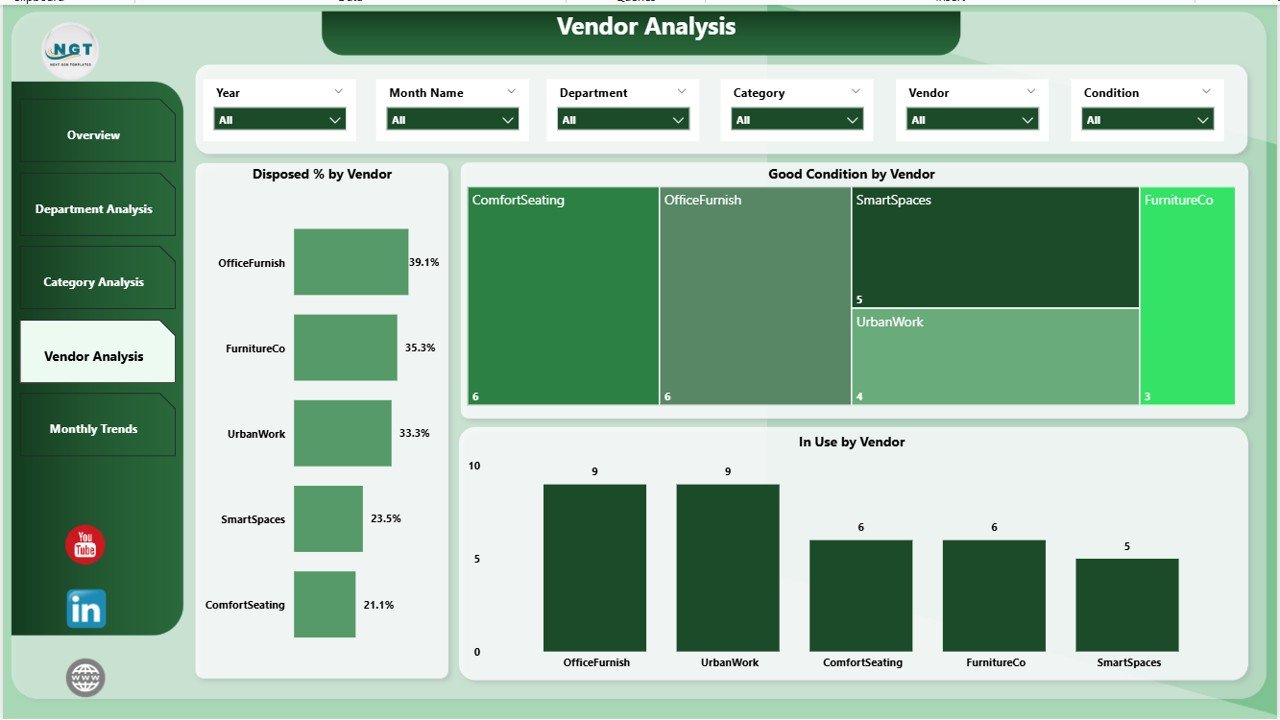
Vendors play a major role in asset quality and lifecycle. The Vendor Analysis page evaluates suppliers on multiple KPIs.
-
Disposed % by Vendor: Identifies vendors whose products fail faster.
-
Good Condition by Vendor: Highlights vendors delivering durable furniture.
-
In Use by Vendor: Shows which vendors supply the most-used assets.
This view helps procurement teams negotiate better deals, choose reliable vendors, and eliminate underperforming ones.
Monthly Trends
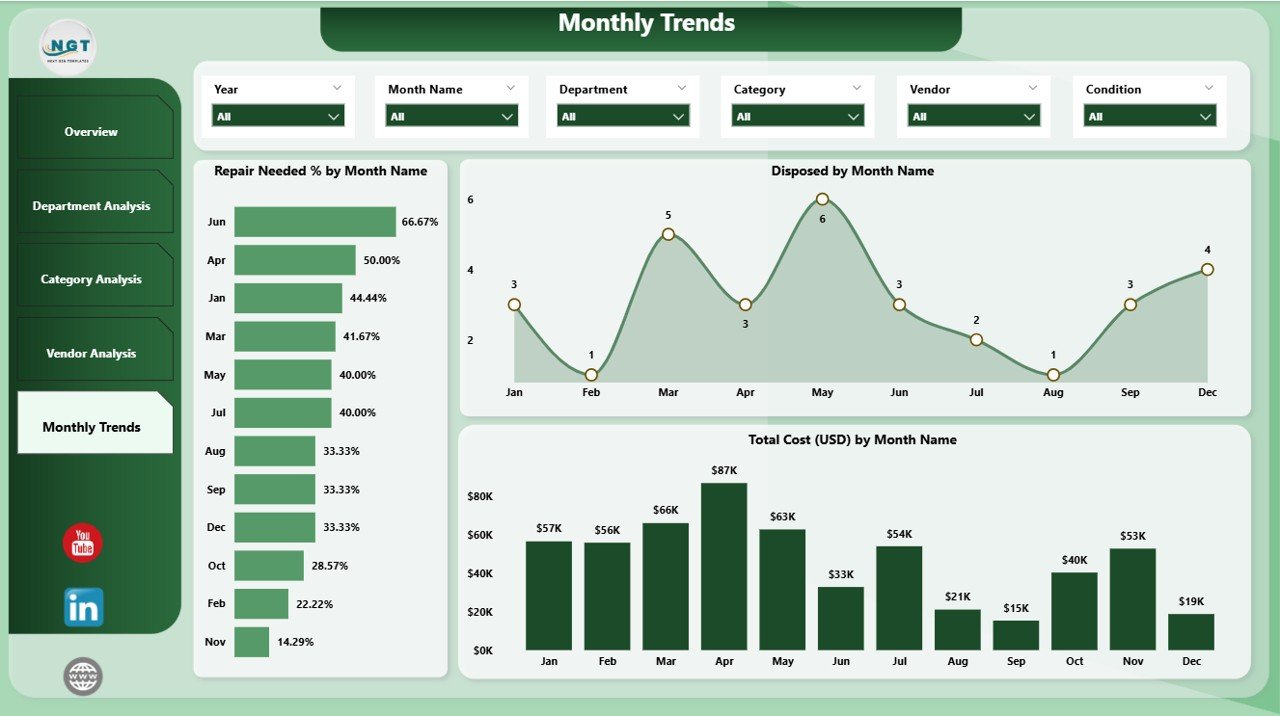
The Monthly Trends page brings a time-based perspective to furniture management.
-
Repair Needed % by Month Name: Tracks how repair needs evolve.
-
Disposed by Month Name: Shows disposal patterns over time.
-
Total Cost (USD) by Month Name: Provides cost trends for better forecasting.
This time-series analysis helps spot seasonal patterns, predict future expenses, and optimize budgeting.
Advantages of Using the Office Furniture Inventory Dashboard
Using this Power BI dashboard comes with several benefits:
-
Centralized Data View – Brings all furniture information into one interactive platform.
-
Improved Cost Management – Helps monitor expenses by department, category, and vendor.
-
Enhanced Decision-Making – Provides real-time KPIs and trends.
-
Better Vendor Negotiations – Compares vendor performance objectively.
-
Proactive Maintenance – Identifies furniture needing repairs before issues escalate.
-
Time Savings – Automates reporting, reducing manual Excel work.
-
User-Friendly Interface – Clear visuals make data easy to interpret for non-technical users.
Best Practices for Using the Dashboard
To maximize the value of the Office Furniture Inventory Dashboard, follow these best practices:
-
Keep Data Updated: Regularly refresh the Excel source file to ensure accuracy.
-
Use Slicers and Filters: Allow managers to slice data by department, category, or vendor for deeper insights.
-
Set Benchmarks: Define acceptable thresholds for repair %, disposal %, and utilization.
-
Automate Alerts: Configure Power BI alerts for high repair needs or cost spikes.
-
Review Trends Monthly: Compare actual vs. forecasted expenses for better financial control.
-
Train Teams: Ensure department heads and facility managers understand how to interpret visuals.
Real-World Use Cases
The Office Furniture Inventory Dashboard is not limited to large enterprises. It benefits organizations of all sizes:
-
Corporate Offices: Track assets across multiple branches.
-
Educational Institutions: Manage classroom and office furniture.
-
Healthcare Facilities: Monitor beds, chairs, and specialized furniture.
-
Government Departments: Ensure accountability in asset utilization.
-
SMEs: Reduce unnecessary purchases through better visibility.
Click to Purchases Office Furniture Inventory Dashboard in Power BI
Conclusion
Furniture management may not always receive attention, but it plays a critical role in cost efficiency and workplace comfort. With the Office Furniture Inventory Dashboard in Power BI, organizations gain complete visibility over costs, usage, conditions, vendors, and trends.
By using this interactive tool, decision-makers can reduce waste, improve asset utilization, negotiate better with vendors, and forecast costs more accurately.
If your organization still relies on static reports, now is the right time to switch to Power BI for office asset management.
Frequently Asked Questions (FAQs)
1. What data sources can be used for the Office Furniture Inventory Dashboard?
You can use Excel, CSV files, or even direct connections to ERP systems as the data source. In most cases, Excel is the starting point.
2. Can small businesses benefit from this dashboard?
Yes. Even small offices benefit because it helps reduce unnecessary purchases and control costs.
3. How often should the dashboard be updated?
Ideally, refresh the data at least once a month. However, weekly or real-time refresh is possible if connected to live systems.
4. Can I customize the KPIs shown on the dashboard?
Yes. Power BI allows customization of KPIs based on your organization’s goals.
5. Do I need technical expertise to use it?
No. The dashboard is user-friendly, and once set up, managers can explore insights without technical training.
6. Can it integrate with asset management systems?
Yes. Power BI can connect with external databases and asset management tools for a seamless experience.
7. What are the licensing requirements?
You need Power BI Desktop for creating the dashboard. To share with teams, Power BI Pro or Premium may be required.
Visit our YouTube channel to learn step-by-step video tutorials
Click to Purchases Office Furniture Inventory Dashboard in Power BI