Managing community programs requires clear insights, measurable outcomes, and reliable data. The Community Services KPI Dashboard in Power BI provides a powerful way for organizations to track key performance indicators (KPIs), analyze progress, and present impact visually — all through a single, interactive report.
Built with Power BI and powered by Excel data, this ready-to-use dashboard helps social organizations, NGOs, and local authorities measure service effectiveness, funding utilization, and community engagement metrics efficiently.
Click to Purchases Community Services KPI Dashboard in Power BI
What Is a Community Services KPI Dashboard in Power BI?
A Community Services KPI Dashboard is a digital analytics tool created using Microsoft Power BI. It consolidates data from multiple sources, such as Excel files or internal systems, and transforms it into visual insights.
It enables organizations to:
-
Track service delivery performance against set goals.
-
Compare actual results with targets and previous years.
-
Identify underperforming areas early.
-
Communicate impact to stakeholders transparently.
With this dashboard, decision-makers no longer need to sift through spreadsheets — instead, they gain instant access to KPIs that truly matter.
Click to Purchases Community Services KPI Dashboard in Power BI
Why Use Power BI for Community Service Tracking?
Power BI brings automation, clarity, and interactivity to performance reporting. For community services, it offers several key advantages:
-
Centralized Data Visualization – Consolidate data from Excel, databases, or cloud sources in one place.
-
Interactive Analysis – Drill through KPIs, apply filters, and explore insights dynamically.
-
Automated Refreshes – Update data effortlessly through Excel imports or Power BI Service connections.
-
Visual Impact – Use intuitive charts, cards, and slicers to communicate performance at a glance.
-
Accessibility – Share dashboards across departments, offices, or partners securely.
For non-profits and local agencies, this Power BI dashboard provides professional-grade analytics without expensive software investments.
Key Features of the Community Services KPI Dashboard
The Community Services KPI Dashboard in Power BI is organized into three interactive pages, each designed for a specific level of analysis and user experience.
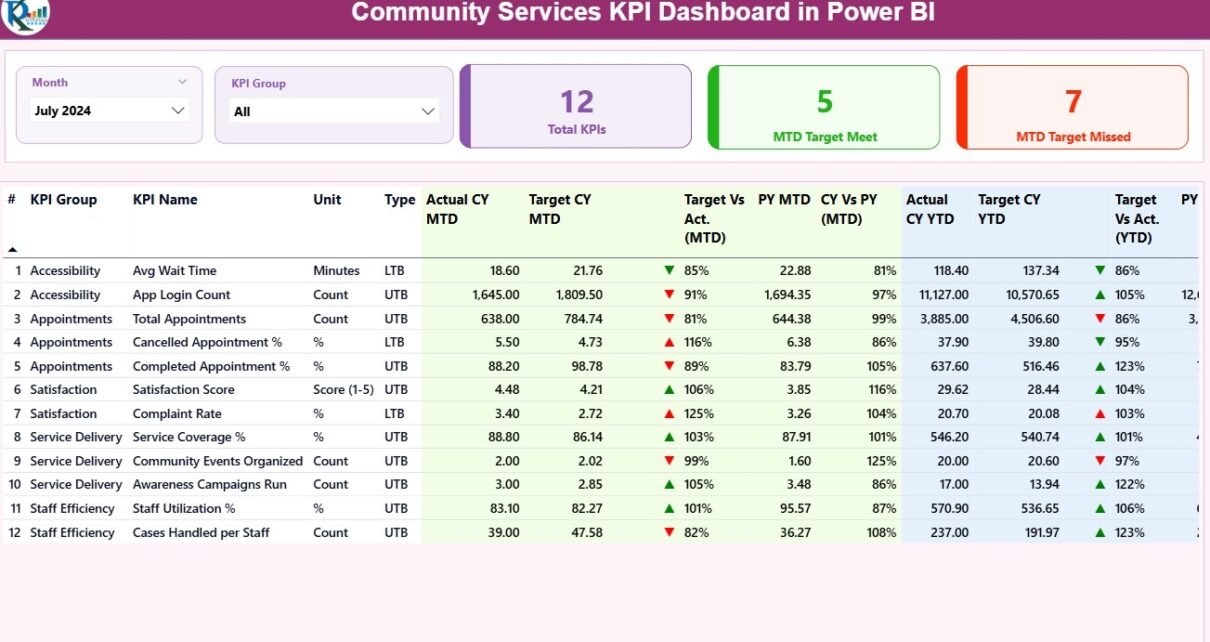
1. Summary Page – The Executive Overview
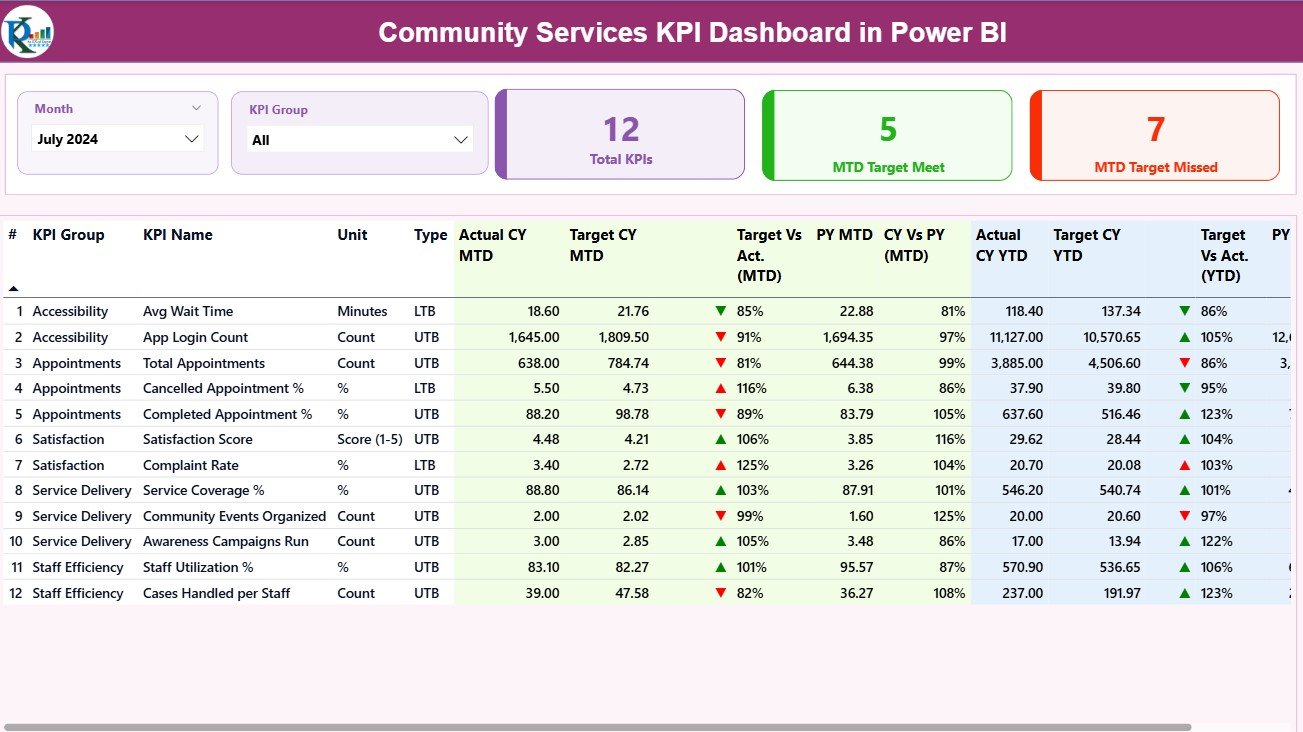
The Summary Page acts as the main view of the dashboard, presenting all essential KPIs and comparisons in one screen.
Top Highlights:
-
Month & KPI Group Slicers: Quickly filter data by period or category.
-
Three KPI Cards:
-
Total KPIs Count – Displays the number of active KPIs.
-
MTD Target Met Count – Shows how many KPIs met their current month targets.
-
MTD Target Missed Count – Indicates KPIs that fell short of goals.
-
-
Detailed KPI Table: A dynamic table lists every KPI with MTD and YTD values, enabling granular performance review.
This summary offers a snapshot of organizational health — whether the community programs are on track or require strategic attention.
2. KPI Trend Page – Visualizing Performance Over Time
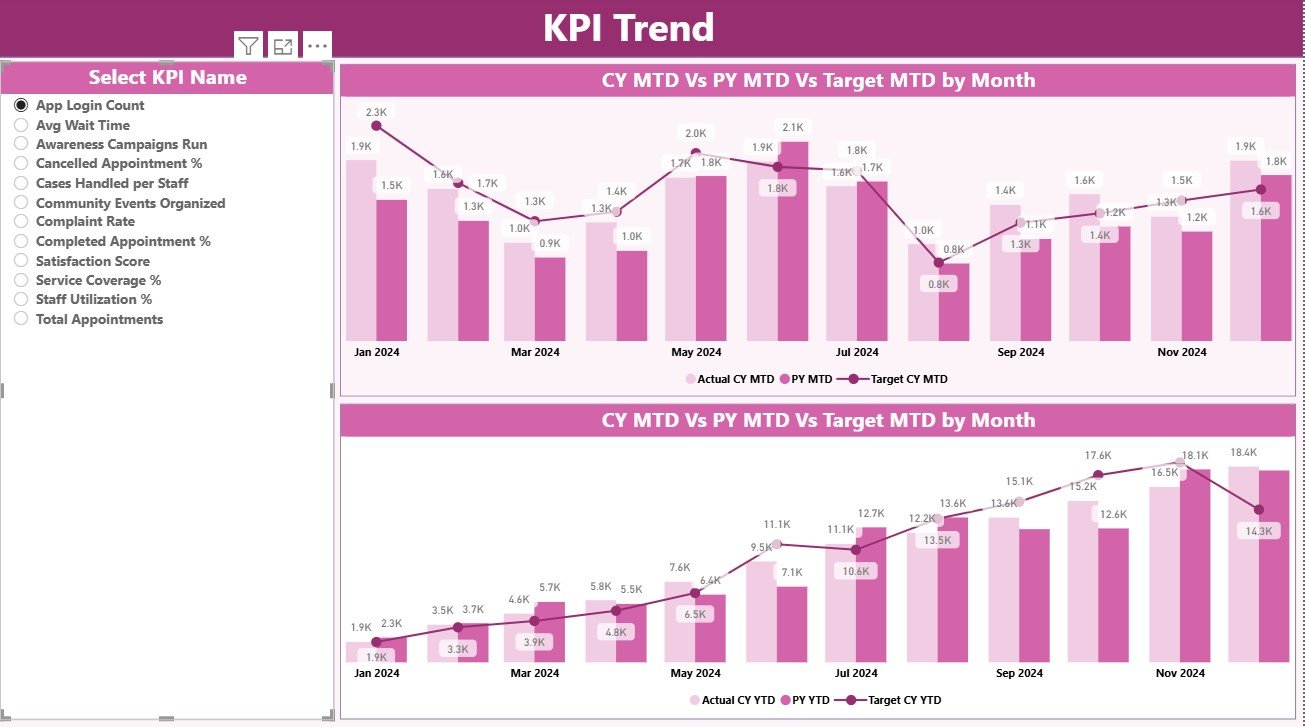
The KPI Trend Page provides a graphical view of progress across months and years.
Key Elements:
-
Slicer on Left Panel: Select a KPI name to focus on.
-
Two Combo Charts:
-
MTD Chart – Displays Actual vs Target vs Previous Year.
-
YTD Chart – Shows cumulative trends for the same metrics.
-
This dual-chart layout reveals how each KPI behaves over time — allowing analysts to spot growth patterns, seasonality, or declining areas at a glance.
3. KPI Definition Page – KPI Reference and Drill-Through View
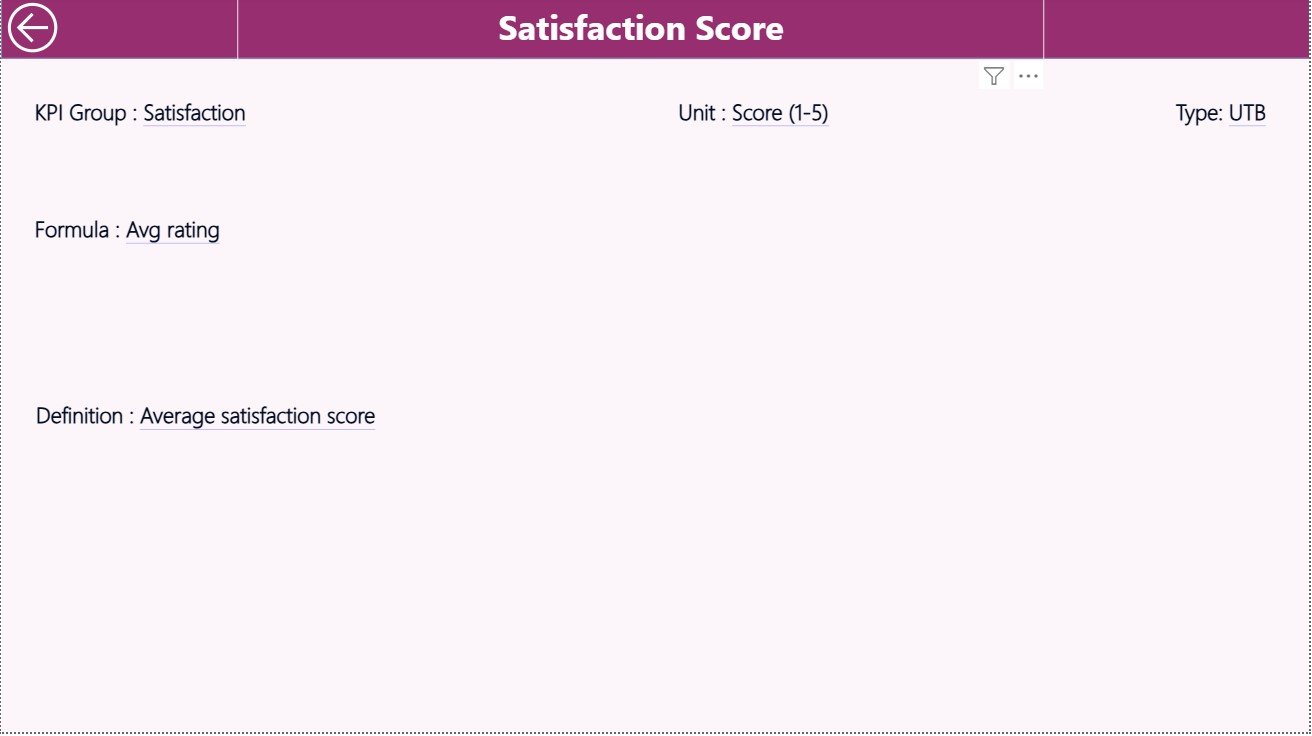
This hidden drill-through page acts as the backend documentation and contextual reference for each KPI.
Features:
-
Displays KPI Group, Unit, Formula, Definition, and Type (UTB / LTB).
-
Automatically accessible by right-clicking on a KPI in the Summary Page → “Drill through to Definition.”
-
Includes a Back Button in the top-left corner to return easily to the main dashboard.
This page ensures transparency and understanding across departments by defining how each KPI is calculated and interpreted.
Excel Data Source Structure
The Power BI dashboard uses a linked Excel file as its core data source. The Excel workbook includes three structured sheets:
1. Input_Actual Sheet
-
Columns: KPI Name, Month (first date of the month), MTD Actual, YTD Actual.
-
Contains real-time results for each KPI.
2. Input_Target Sheet
-
Columns: KPI Name, Month (first date of the month), MTD Target, YTD Target.
-
Defines planned or expected performance values.
3. KPI Definition Sheet
-
Columns: KPI Number, KPI Group, KPI Name, Unit, Formula, Definition, Type (UTB / LTB).
-
Provides reference details for consistency and reporting clarity.
Once this Excel file is connected to Power BI, refreshing the dataset updates the dashboard automatically — eliminating manual work.
Advantages of the Community Services KPI Dashboard
🌟 1. Centralized Performance Monitoring
Track every KPI from service delivery to funding utilization in one dashboard.
🌟 2. Visual Impact
Color coding, icons, and charts make performance insights easy to understand.
🌟 3. Automated Comparisons
See MTD and YTD differences against targets and previous years instantly.
🌟 4. Data-Driven Accountability
Assign KPI ownership to departments and measure their contributions.
🌟 5. Scalable and Customizable
Add new KPIs, service groups, or years without rebuilding the dashboard.
🌟 6. Transparency for Stakeholders
Provide clear, professional visual reports to boards, donors, and public agencies.
Click to Purchases Community Services KPI Dashboard in Power BI
How to Use the Dashboard Effectively
-
Prepare Excel Data: Update Actual and Target sheets monthly.
-
Refresh Data in Power BI: Use the “Refresh” button to load new data.
-
Use Slicers for Filtering: Choose Month or KPI Group to narrow results.
-
Review Cards and Icons: Green ▲ shows success; Red ▼ signals underperformance.
-
Drill Through KPIs: Right-click any KPI for definition details.
-
Export Reports: Share as PDF, image, or Power BI link for presentations.
-
Repeat Monthly: Regular updates keep insights accurate and timely.
How the Dashboard Enhances Community Impact
Community service organizations manage numerous programs — from education to health to social support. The KPI dashboard ensures every initiative remains measurable.
It helps teams to:
-
Monitor beneficiary reach and impact.
-
Track budget utilization against grants or funding.
-
Evaluate program effectiveness and service quality.
-
Provide transparent reports for audits and funders.
The result is a culture of accountability, transparency, and improvement.
Best Practices for the Community Services KPI Dashboard
✅ 1. Choose Relevant KPIs
Focus on metrics that directly align with your mission (e.g., beneficiaries served, program completion rate).
✅ 2. Maintain Data Quality
Use consistent units, dates, and naming conventions in Excel.
✅ 3. Set Achievable Targets
Define realistic goals that motivate teams without being unrealistic.
✅ 4. Refresh Data Regularly
Schedule monthly or quarterly updates for accuracy.
✅ 5. Use Drill-Through Features
Analyze each KPI’s formula and definition to understand root causes.
✅ 6. Protect the Excel Source
Restrict edit access to prevent data manipulation or accidental changes.
✅ 7. Engage Stakeholders
Share dashboards during reviews to drive collaborative decisions.
Common Mistakes to Avoid
-
Uploading Excel files with inconsistent date formats.
-
Forgetting to update targets for new program years.
-
Ignoring negative performance trends in charts.
-
Overcrowding the dashboard with too many visuals.
-
Not documenting KPI definitions clearly.
Avoiding these mistakes keeps your dashboard clean, accurate, and actionable.
Conclusion
The Community Services KPI Dashboard in Power BI transforms how social organizations measure and report performance. It brings together automation, visual insights, and real-time analytics — enabling faster, evidence-based decisions that maximize community impact.
From local councils to non-profits and NGOs, this dashboard is a must-have tool for any organization committed to improving lives through data-driven accountability.
Start using the Community Services KPI Dashboard in Power BI today and turn your data into impact.
Click to Purchases Community Services KPI Dashboard in Power BI
Frequently Asked Questions (FAQs)
1. What is the Community Services KPI Dashboard used for?
It monitors key metrics like service delivery, funding efficiency, and beneficiary impact through Power BI visuals.
2. Who can use this dashboard?
Non-profits, government departments, and community service managers tracking program performance.
3. How is data updated?
By refreshing the Power BI file after updating the Excel source sheets (Input_Actual, Input_Target, KPI Definition).
4. Can I add new KPIs?
Yes — simply add them to the Excel KPI Definition sheet and refresh the dashboard.
5. Do I need advanced Power BI skills?
No — basic navigation and Excel knowledge are enough to manage this dashboard.
6. Can I publish this online?
Yes, it can be published to Power BI Service for team access and scheduled refreshes.
7. Is this dashboard customizable?
Fully — you can change colors, themes, KPI groups, and visual layouts as needed.
Click to Purchases Community Services KPI Dashboard in Power BI
Visit our YouTube channel to learn step-by-step video tutorials