In the modern world of digital banking, data is the lifeblood that drives decision-making, risk assessment, and operational efficiency. Banks generate a massive volume of data every day — from customer transactions and service fees to risk analysis and departmental performance. To make sense of this data, financial institutions need a powerful, visual, and interactive tool — and that’s where the Banking Dashboard in Power BI steps in.
This comprehensive guide will explore everything you need to know about the Banking Dashboard in Power BI, including its structure, key features, advantages, and best practices to maximize its potential. Whether you’re a data analyst, bank executive, or financial manager, this article will help you understand how this dashboard can transform raw banking data into actionable insights.
Click to Purchases Banking Dashboard in Power BI
What Is a Banking Dashboard in Power BI?
A Banking Dashboard in Power BI is a dynamic, data-driven visualization tool that helps banks and financial institutions monitor performance metrics in real time. Built using Microsoft Power BI, this dashboard connects to data stored in Excel or databases and converts complex figures into interactive visuals — providing a 360° view of the organization’s financial health.
It enables teams to track transactions, service fees, risk levels, customer segmentation, and departmental performance — all through an easy-to-navigate interface. By leveraging this dashboard, decision-makers can quickly identify trends, detect anomalies, and take data-backed actions that enhance efficiency and profitability.
Structure of the Banking Dashboard in Power BI
The Banking Dashboard in Power BI is thoughtfully designed with five analytical pages, each serving a specific purpose to provide a complete view of the bank’s performance metrics.
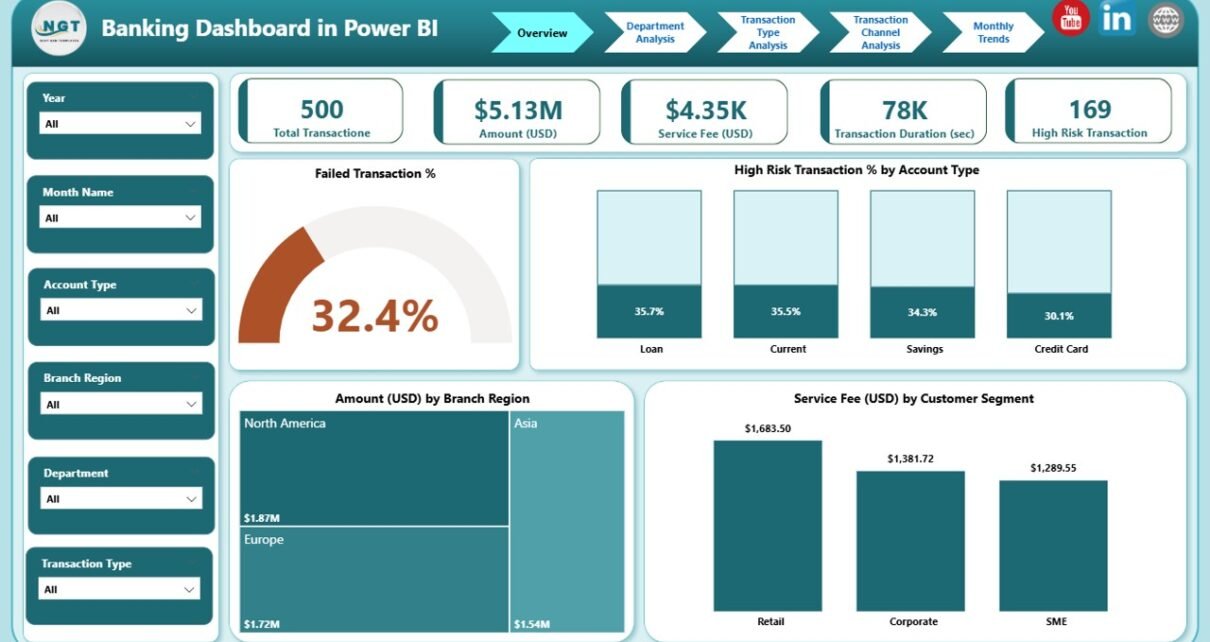
1️⃣ Overview Page

The Overview Page acts as the central control panel for the entire dashboard. It provides a quick summary of key banking KPIs and trends.
Key Features:
-
Five performance cards summarizing critical metrics.
Visuals showing:
- Failed Transaction (%)
- High-Risk Transaction (%) by Account Type
- Amount (USD) by Branch Region
- Service Fee (USD) by Customer Segment
This page provides instant insight into overall performance, operational health, and customer engagement — allowing executives to identify issues or growth areas at a glance.
2️⃣ Department Analysis Page

The Department Analysis Page breaks down performance by department, making it easier to evaluate operational efficiency and revenue contribution.
Key Insights Include:
-
Failed Transaction (%) by Department
-
Service Fee (USD) by Department
-
Amount (USD) by Department
This page helps managers compare how various departments perform in terms of transaction handling, fee generation, and risk exposure. With these insights, banks can identify underperforming departments and implement corrective measures promptly.
Click to Purchases Banking Dashboard in Power BI
3️⃣ Transaction Type Analysis Page

This page focuses on understanding transaction patterns based on transaction types — whether they are deposits, withdrawals, transfers, or payments.
Core Metrics Visualized:
-
High-Risk Transaction (%) by Transaction Type
-
Total Transactions by Transaction Type
-
Amount (USD) by Transaction Type
The insights from this page help in monitoring risk across different transaction types, identifying the most profitable ones, and streamlining operations accordingly.
4️⃣ Transaction Channel Analysis Page

With the growth of online banking, ATMs, and mobile transactions, analyzing transaction channels has become essential.
Visuals Displayed:
-
Amount (USD) by Transaction Channel
-
Failed Transactions by Transaction Channel
-
Transaction Duration (Sec) by Transaction Channel
This analysis enables banks to measure customer experience and performance across different channels — such as mobile apps, ATMs, or in-branch services — and optimize processes for better service delivery.
5️⃣ Monthly Trends Page
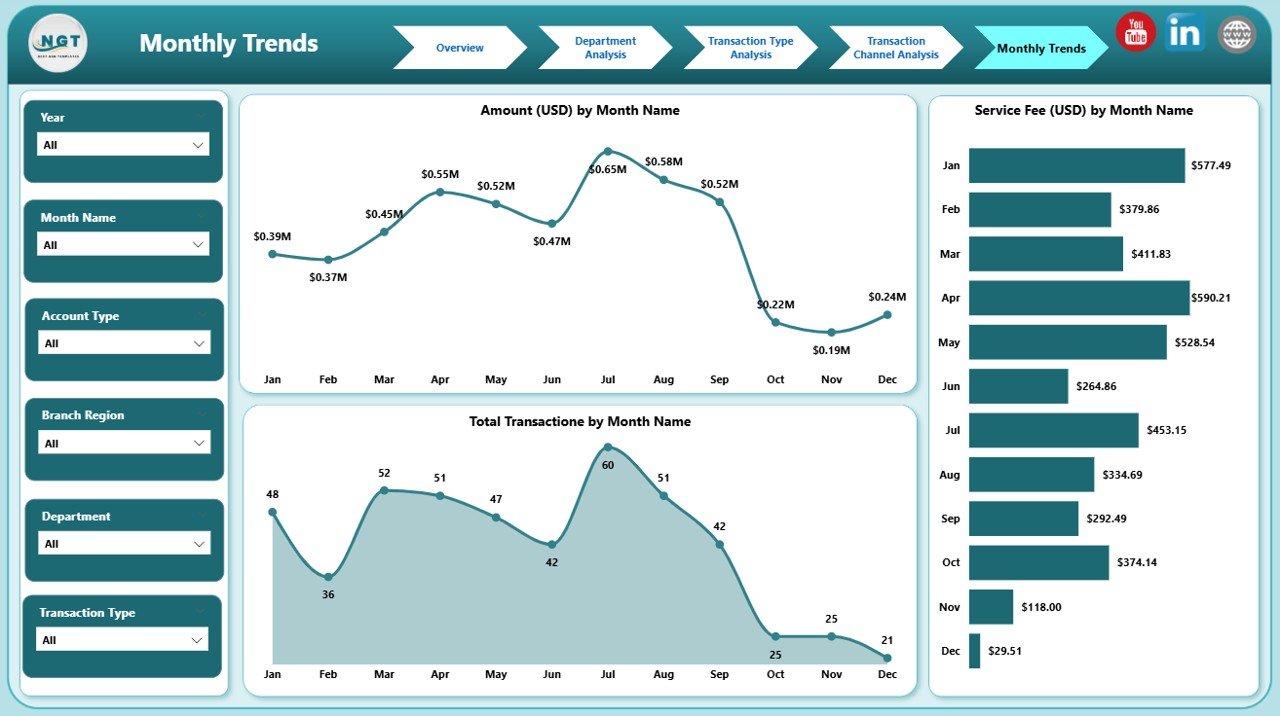
The Monthly Trends Page brings together a time-based analysis of performance metrics, providing a view of how the bank’s operations evolve month by month.
Charts Include:
-
Amount (USD) by Month
-
Total Transactions by Month
-
Service Fee (USD) by Month
This page helps management identify seasonality, growth patterns, and potential forecasting opportunities for upcoming quarters.
Why Use Power BI for Banking Analytics?
Power BI is one of the most robust business intelligence tools available, and it’s particularly powerful for the banking sector because of its ability to handle vast, complex datasets and present them visually.
Here’s why Power BI stands out for banking analytics:
-
Real-time Monitoring: Track KPIs instantly with automatic data refresh.
-
Interactive Visualizations: Drill down into specific branches, customers, or departments.
-
Customizable Reports: Tailor dashboards for different management levels.
-
Integration: Connect seamlessly with Excel, SQL, and other data sources.
-
Data-driven Culture: Empower staff to make informed, evidence-based decisions.
Advantages of the Banking Dashboard in Power BI
The Banking Dashboard in Power BI brings numerous advantages that transform how banks analyze and act upon data.
1️⃣ Comprehensive Visibility
The dashboard consolidates all data — from customer transactions to departmental metrics — into one view, providing leadership teams with complete organizational transparency.
2️⃣ Improved Decision-Making
Interactive visuals enable real-time decision-making based on accurate, updated data. Executives no longer rely on manual reports or assumptions.
3️⃣ Enhanced Risk Management
Monitoring high-risk and failed transactions helps banks detect potential frauds, identify bottlenecks, and improve compliance with financial regulations.
4️⃣ Performance Tracking
Each department or branch can be evaluated individually, ensuring accountability and performance-driven operations.
5️⃣ Operational Efficiency
Automated dashboards save time and effort by eliminating manual data compilation and report generation.
6️⃣ Customer-Centric Insights
By analyzing customer segments, transaction channels, and service fees, banks can personalize services and enhance client satisfaction.
How the Dashboard Improves Financial Performance
A well-implemented Power BI Banking Dashboard improves financial performance in multiple ways:
-
Informed Revenue Analysis – It identifies high-income branches or customer segments contributing most to profitability.
-
Expense Optimization – By visualizing service costs and transaction times, management can reduce inefficiencies.
-
Fraud Detection – Real-time anomaly detection on failed or risky transactions minimizes fraud losses.
-
Customer Retention – Understanding transaction behavior helps banks design better loyalty programs and offers.
-
Forecasting – Monthly trend analysis supports forecasting revenue, volume, and service demand.
Best Practices for the Banking Dashboard in Power BI
To get the most value from the Banking Dashboard, banks should adopt these best practices:
1️⃣ Ensure Data Accuracy
Integrate verified data sources (Excel, SQL, CRM, etc.) and maintain consistency across all records to avoid misleading visuals.
2️⃣ Automate Data Refresh
Set up automatic data refresh in Power BI Service to ensure all metrics reflect real-time insights.
3️⃣ Use Dynamic Filters and Slicers
Allow users to interact with the data — for instance, filtering by month, department, or transaction type — for deeper analysis.
4️⃣ Maintain Clean Visualization
Avoid cluttered dashboards. Use colors, KPIs, and icons strategically to highlight performance trends.
5️⃣ Regularly Review KPIs
Re-evaluate KPIs every quarter to ensure they align with current business goals and regulatory requirements.
6️⃣ Implement Security Controls
Since banking data is sensitive, apply Power BI row-level security (RLS) to control data access based on user roles.
7️⃣ Combine Power BI with Excel for Flexibility
Leverage Excel as the data backbone for Power BI for easy updates, simulations, and scenario planning.
How to Build a Banking Dashboard in Power BI
Here’s a step-by-step approach to building this dashboard effectively:
-
Collect Data: Gather transaction records, customer data, and departmental performance data in Excel or your database.
-
Clean the Data: Ensure the data is error-free, formatted, and standardized.
-
Import into Power BI: Connect your Excel or SQL files using Power BI’s data import tools.
-
Create Data Model: Establish relationships between tables like Departments, Transactions, Customers, and Branches.
-
Design Dashboard Pages: Add cards, KPIs, and charts such as bar graphs, pie charts, and line charts.
-
Add Slicers and Filters: Enhance user interactivity for better analysis.
-
Publish and Share: Publish to Power BI Service and share it securely with your organization.
Use Cases of the Banking Dashboard
The versatility of Power BI makes it suitable for various banking functions:
-
Retail Banking: Analyze customer transactions and service performance.
-
Corporate Banking: Track high-value client portfolios and profitability.
-
Risk & Compliance: Monitor fraud detection and suspicious activity.
-
Customer Service: Evaluate feedback, response times, and satisfaction.
-
Branch Management: Compare branch performance geographically.
Challenges Addressed by the Banking Dashboard
Banks face numerous data-related challenges that this dashboard effectively resolves:
-
Fragmented Data Sources: Power BI consolidates multiple systems into one view.
-
Manual Reporting Delays: Automated visuals save hundreds of reporting hours.
-
Lack of Real-Time Insights: Dashboards update dynamically, reducing lag.
-
Limited Transparency: All teams access consistent and centralized metrics.
-
Compliance Risks: Monitors key indicators aligned with audit requirements.
Click to Purchases Banking Dashboard in Power BI
Conclusion
The Banking Dashboard in Power BI is more than just a reporting tool — it’s a strategic asset that enables banks to make smarter, faster, and more confident decisions. By combining the power of Excel data with Power BI’s interactive analytics, banks can visualize every aspect of their operations — from risk and revenue to customer satisfaction — on a single, unified platform.
With real-time insights, drill-down analysis, and customizable visuals, this dashboard empowers decision-makers to transform data into action, ensuring continuous growth and operational excellence in the modern banking landscape.
Frequently Asked Questions (FAQs)
1️⃣ What is the purpose of a Banking Dashboard in Power BI?
The purpose is to visualize and analyze banking operations, transactions, and risk factors in a centralized, interactive format for better decision-making.
2️⃣ Can the dashboard connect to live banking data?
Yes, Power BI can connect to live databases, APIs, and cloud sources to update data in real time.
3️⃣ What are the key metrics tracked in this dashboard?
The key metrics include Failed Transaction %, High-Risk Transaction %, Service Fee (USD), Total Transactions, and Transaction Duration (Sec).
4️⃣ Who can benefit from this dashboard?
Bank executives, data analysts, branch managers, and compliance officers can all use this dashboard for data-driven insights.
5️⃣ Can I customize the dashboard for my bank’s needs?
Absolutely. The dashboard is fully customizable. You can modify visuals, KPIs, and data sources according to your institution’s requirements.
6️⃣ Does Power BI ensure data security?
Yes. Power BI includes encryption, role-based access, and row-level security features to keep financial data protected.
7️⃣ What is the best data source for this dashboard?
Excel files, SQL databases, or financial transaction logs are ideal starting points for integrating into Power BI.
8️⃣ How often should the dashboard be updated?
It’s recommended to refresh data automatically or at least daily to maintain accurate insights.
9️⃣ Can I share the dashboard with others?
Yes, dashboards can be published in Power BI Service and shared securely with authorized users.
🔟 Is Power BI suitable for small banks or startups?
Yes! Power BI is scalable — making it perfect for both small community banks and large financial institutions.
Visit our YouTube channel to learn step-by-step video tutorials
Click to Purchases Banking Dashboard in Power BI