Additive manufacturing (AM) moves fast. One day you test a new powder batch, and the next day you rush a critical prototype to meet a deadline. Because of this speed, small issues can quietly grow into big losses—like scrap builds, rework, missed delivery dates, and poor part quality.So, how do you stay in control?You need a simple but powerful way to track performance every month and across the year. That is exactly why we created the Additive Manufacturing KPI Dashboard in Excel.This ready-to-use dashboard helps you monitor your most important AM KPIs in one place. In addition, it lets you compare Actual vs Target, check Month-to-Date (MTD) and Year-to-Date (YTD) performance, and also compare with Previous Year (PY) numbers—all with clear up/down indicators.
In this complete guide, you will learn:Additive Manufacturing KPI Dashboard in Excel
- What an Additive Manufacturing KPI Dashboard in Excel is
- Why KPIs matter in 3D printing operations
- Which KPIs you should track
- How our ready-to-use Excel template works
- Best practices, advantages, and improvement opportunities
- FAQs with clear answers
Click to buy Additive Manufacturing KPI Dashboard in Excel
What Is an Additive Manufacturing KPI Dashboard in Excel?
An Additive Manufacturing KPI Dashboard in Excel is a performance tracking template that helps you measure and manage key manufacturing metrics for 3D printing operations.
Instead of checking multiple reports from MES, ERP, printer software, and quality logs, you track everything in one structured Excel dashboard. As a result, you gain clarity, speed, and control.
This dashboard focuses on:
- Production output
- Quality and defect rates
- Printer utilization and downtime
- Build success rate and scrap
- Cost efficiency
- Delivery and lead time performance
And because it runs in Excel, you can use it instantly without extra tools.Additive Manufacturing KPI Dashboard in Excel
Why Should You Track KPIs in Additive Manufacturing?
Additive manufacturing looks simple from the outside, but daily operations include many moving parts. You manage machines, materials, build parameters, post-processing, inspections, and delivery timelines. Therefore, KPIs become essential.
When you track KPIs properly:
- You quickly detect performance drops
- You reduce scrap and rework
- You improve machine usage
- You control material waste
- You forecast capacity correctly
- You deliver parts on time with fewer surprises
Also, KPIs help you align teams—engineering, production, quality, and planning—because everyone sees the same numbers.
Which KPIs Matter Most in Additive Manufacturing?
You can track many metrics in AM. However, the best dashboards focus on the KPIs that directly impact output, quality, cost, and delivery.
Here are common KPI groups you should include:
Production KPIs
- Total Builds Completed
- Parts Printed
- Build Completion Rate
- On-Time Delivery %
- Lead Time (Days)
Machine KPIs
- Printer Utilization %
- Downtime Hours
- Mean Time Between Failures (MTBF)
- Mean Time To Repair (MTTR)
Quality KPIs
- First Pass Yield (FPY)
- Defect Rate %
- Rework Rate %
- Dimensional Accuracy %
Material KPIs
- Material Consumption
- Material Waste %
- Powder Reuse Rate % (for metal AM)
Cost KPIs
- Cost per Part
- Cost per Build
- Energy Cost per Build
Because this dashboard is flexible, you can adjust KPI names and groups based on your process and technology (FDM, SLA, SLS, DMLS, MJF, etc.).
What Is Included in Our Additive Manufacturing KPI Dashboard Template?
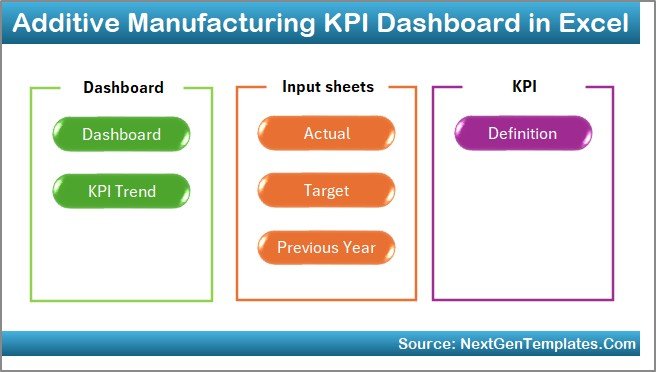
We designed this Excel dashboard as a ready-to-use system. It includes 7 worksheets, and each sheet plays a specific role.
Summary Page (Home / Index Sheet)
The Summary Page works like a navigation hub. Here, you get 6 buttons that jump to the main sheets. So, you do not waste time searching across tabs.
Why this helps:
- Faster navigation
- Cleaner user experience
- Better for managers and teams
Click to buy Additive Manufacturing KPI Dashboard in Excel
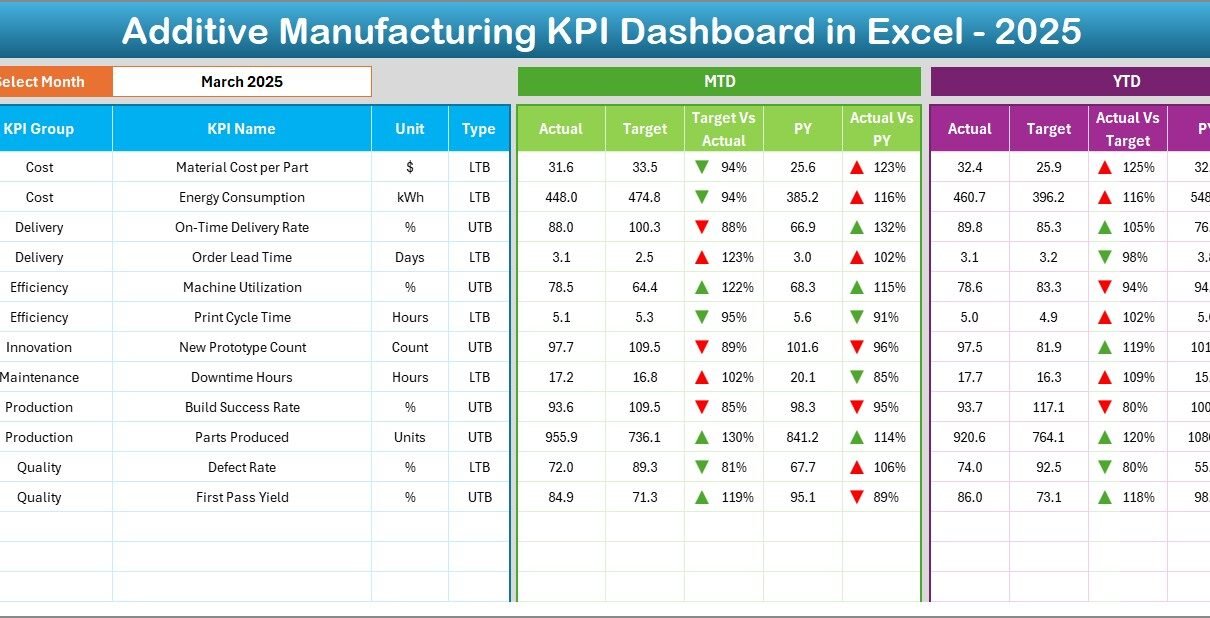
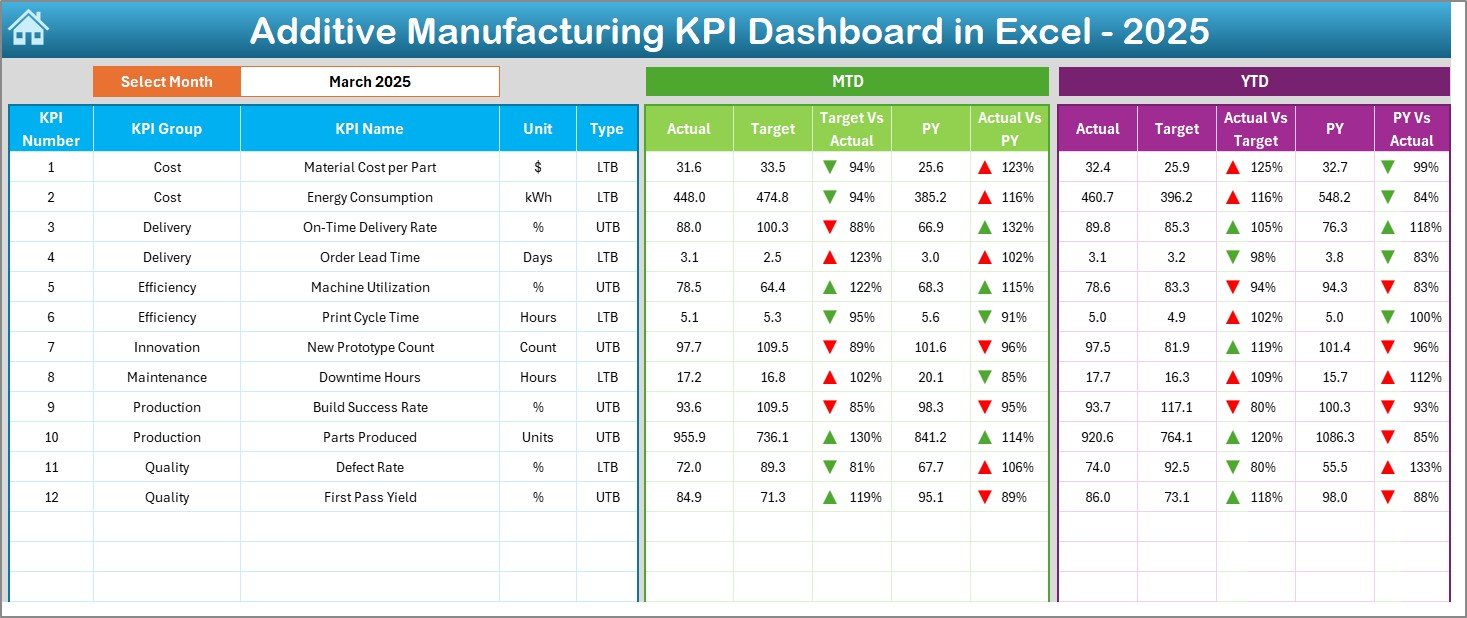
Dashboard Sheet (Main KPI View)
This is the most important sheet in the file. It shows all KPI performance in one view.
On cell D3, you can select the Month from a drop-down. After that, the entire dashboard updates automatically for the selected month.
In this dashboard, you see:
MTD Section
- MTD Actual
- MTD Target
- MTD Previous Year (PY)
- Target vs Actual (with up/down arrows)
- PY vs Actual (with up/down arrows)
YTD Section
- YTD Actual
- YTD Target
- YTD Previous Year (PY)
- Target vs Actual (with up/down arrows)
- PY vs Actual (with up/down arrows)
Because of these comparisons, you can instantly know:
- Are we improving or declining?
- Are we meeting targets or missing them?
- Are we better than last year or falling behind?
Click to buy Additive Manufacturing KPI Dashboard in Excel
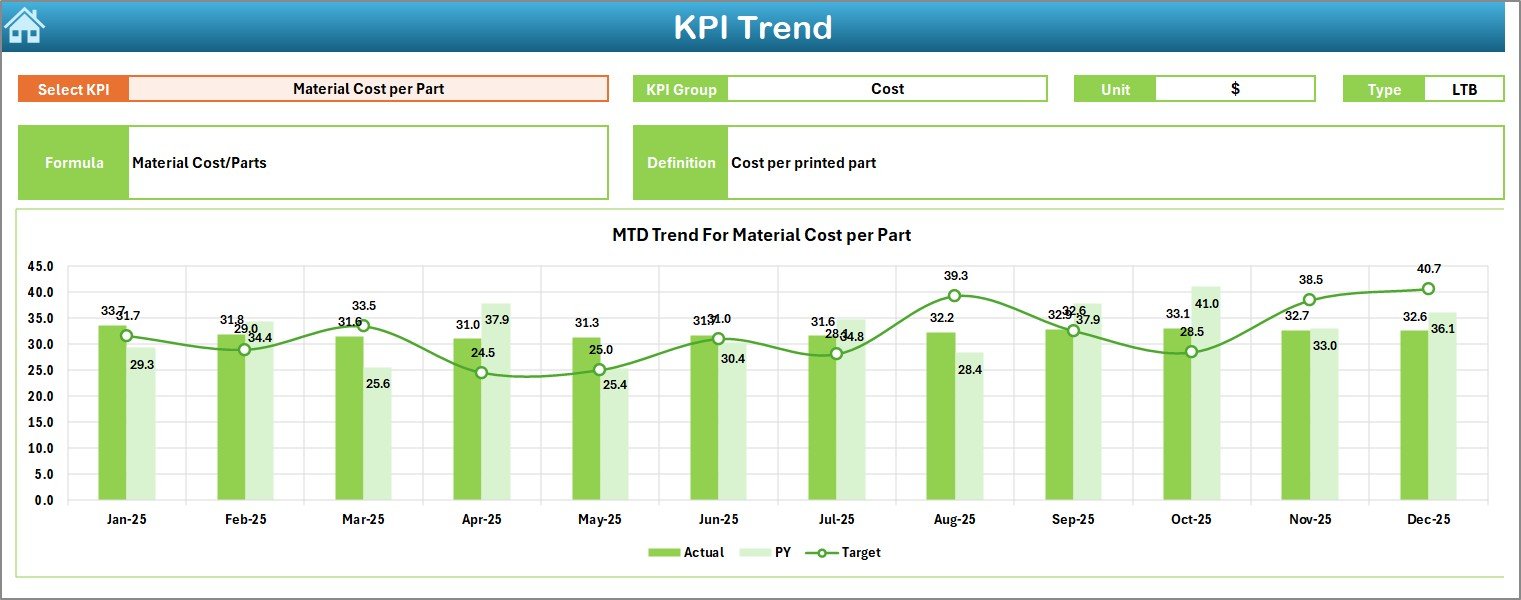
Trend Sheet (KPI Trend Analysis)
After the main dashboard, the next big question is:
Which KPI Is Improving and Which KPI Is Getting Worse?
That is where the Trend sheet helps.
On cell C3, you select the KPI Name from the drop-down. Then the sheet displays:
- KPI Group
- Unit of KPI
- KPI Type (Lower the Better / Upper the Better)
- KPI Formula (short format)
- KPI Definition (short format)
In addition, you get trend charts for:
- MTD trend (Actual, Target, PY)
- YTD trend (Actual, Target, PY)
So, you can track KPI movement month by month and quickly find the reason behind changes.
Click to buy Additive Manufacturing KPI Dashboard in Excel
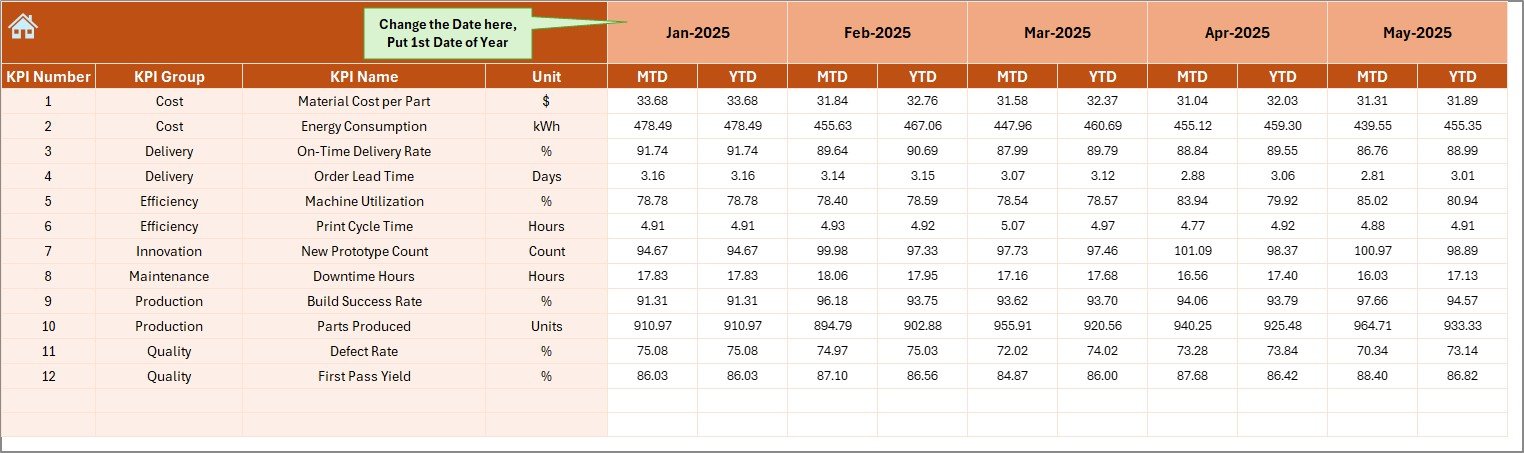
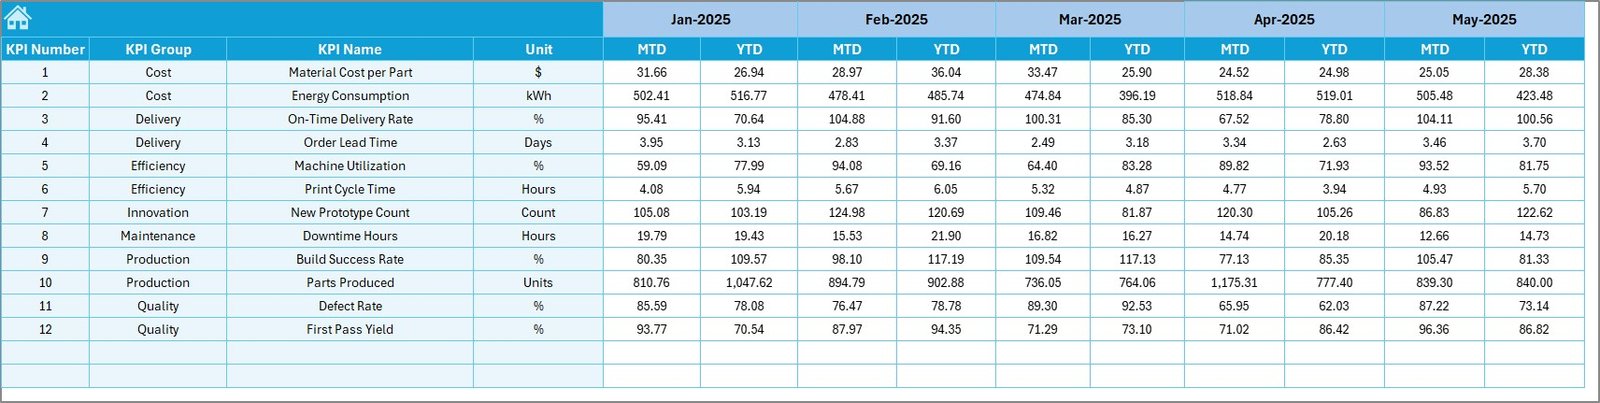
Actual Numbers Input Sheet
This is where you enter your Actual values.
You can input values for:
- MTD Actual numbers
- YTD Actual numbers
Also, you can change the month sequence using cell E1.
How it works:
- You type the first month of the year in E1
- Excel updates the month headers automatically
- Then you enter actual values month by month
This structure keeps the data clean and consistent.
Click to buy Additive Manufacturing KPI Dashboard in Excel
Target Sheet
Targets give direction. Therefore, this sheet stores monthly targets for every KPI.
Here, you enter:
- MTD Target
- YTD Target
Once you update targets, your dashboard comparisons update automatically.
Click to buy Additive Manufacturing KPI Dashboard in Excel
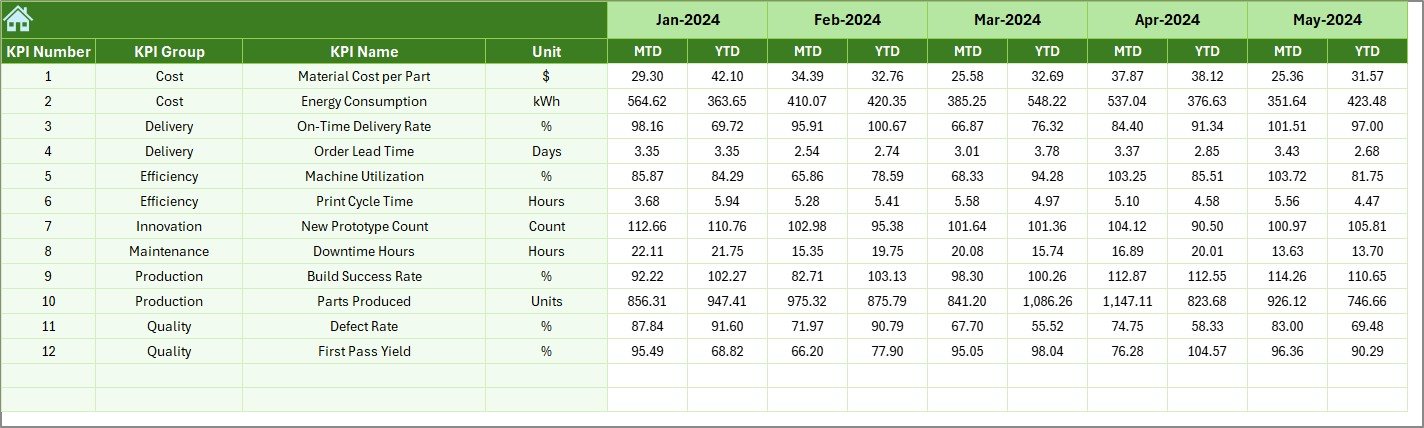
Previous Year Number Sheet
This sheet stores last year’s data. Because of that, you can compare your performance against last year trends.
You enter previous year numbers the same way you enter current year numbers:
- MTD Previous Year
- YTD Previous Year
Then the dashboard shows PY vs Actual results.
Click to buy Additive Manufacturing KPI Dashboard in Excel
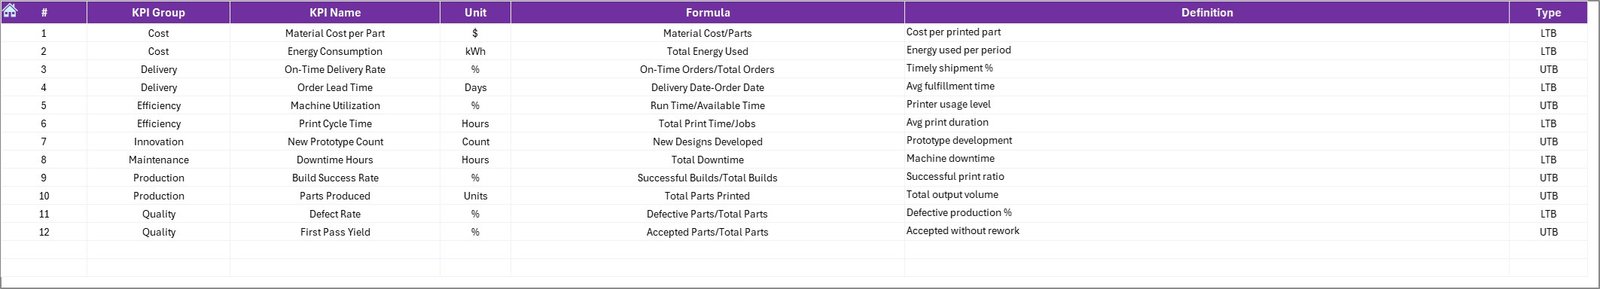
KPI Definition Sheet
This sheet defines your KPI list. It includes:
- KPI Name
- KPI Group
- Unit
- Formula (short)
- Definition (short)
This is useful because:
- Everyone understands KPI meaning
- The trend sheet can display KPI details
- You can change or add KPIs easily
Click to buy Additive Manufacturing KPI Dashboard in Excel
How Do You Use the Additive Manufacturing KPI Dashboard in Excel?
Here is a simple step-by-step workflow you can follow each month:
Step 1: Update KPI Definitions (First Time Setup)
- Open the KPI Definition sheet
- Enter KPIs, units, groups, and definitions
- Confirm KPI Type (LTB or UTB)
Step 2: Enter Monthly Targets
- Go to the Target sheet
- Input MTD and YTD targets for each KPI
Step 3: Enter Actual Numbers Monthly
- Go to Actual Numbers Input
- Select month sequence in E1
- Enter Actual MTD and YTD values
Step 4: Enter Previous Year Data (Optional but Recommended)
- Go to Previous Year Number sheet
- Enter last year MTD/YTD values
- Now you can compare performance year over year
Step 5: Review the Dashboard
- Go to Dashboard sheet
- Select month from D3
- Review KPI performance with arrows and comparisons
Step 6: Deep Dive into Trends
- Go to Trend sheet
- Select a KPI from C3
- Analyze MTD and YTD trend charts
Advantages of Additive Manufacturing KPI Dashboard in Excel
Tracking KPIs in Excel feels familiar. However, a well-designed dashboard gives you much more than a normal spreadsheet.
Key Advantages (Bullet Points)
- Centralized tracking: You manage all KPIs in one dashboard
- Faster decisions: You spot issues quickly with MTD/YTD and arrow indicators
- Better planning: You forecast capacity using utilization and lead time trends
- Improved quality control: You track defects, rework, and FPY trends
- Cost control: You monitor scrap, waste, and cost-per-part over time
- Year-over-year clarity: You compare current year vs previous year instantly
Opportunities for Improvement in Additive Manufacturing KPI Tracking
Even with a dashboard, you can still improve your KPI process. In fact, small changes can bring big impact.
Opportunities for Improvement (Bullet Points)
- Standardize data entry: Use one person or one process to avoid inconsistent numbers
- Track KPIs by machine: Separate trends for each printer for clearer root cause
- Add material batch tracking: Link powder/resin batch to defects and scrap
- Measure post-processing time: Many AM delays happen after printing
- Add Pareto analysis: Highlight top defect types and top downtime reasons
- Improve target setting: Adjust targets based on capacity and demand, not guesswork
Best Practices for Additive Manufacturing KPI Dashboard in Excel
If you want reliable KPI insights, you must use good habits consistently.
Best Practices (Bullet Points)
- Update monthly on a fixed date (example: 1st or 2nd day of each month)
- Validate data before entry (cross-check with printer logs and QA reports)
- Use clear KPI definitions so every team understands the same metric
- Set realistic targets based on real capacity, maintenance plans, and demand
- Review top 5 KPIs weekly even if you update the dashboard monthly
- Use the Trend sheet for root cause before taking action
- Keep a notes log for major changes (new material, new printer, new settings)
- Compare PY results to see real growth, not temporary spikes
Who Can Use This Dashboard?
This KPI dashboard helps many types of AM users, such as:
- Additive manufacturing companies and service bureaus
- 3D printing production teams
- Manufacturing managers and plant heads
- Quality and inspection teams
- Process engineers and continuous improvement teams
- Operations planners and supply chain teams
- R&D teams managing prototypes and trials
Because Excel is widely available, teams can start quickly and scale tracking over time.
Conclusion
Additive manufacturing delivers speed and flexibility, but it also requires strong control over output, quality, and cost. Therefore, KPI tracking becomes a must, not an option.
The Additive Manufacturing KPI Dashboard in Excel gives you a ready-to-use system to track KPIs monthly, compare Actual vs Target, measure MTD and YTD, and also benchmark against Previous Year results.
As you use this dashboard consistently, you will improve performance, reduce waste, increase machine utilization, and deliver better parts on time.
Frequently Asked Questions (FAQs)
What is the purpose of an Additive Manufacturing KPI Dashboard in Excel?
It helps you track key KPIs for 3D printing operations in one place. As a result, you can manage output, quality, utilization, and cost faster.
How does the month selection work in the dashboard?
You select the month in cell D3. Then the dashboard updates all KPI values and comparisons for that selected month.
What is the difference between MTD and YTD in this dashboard?
- MTD (Month-to-Date) shows performance for the selected month.
- YTD (Year-to-Date) shows total/average performance from the start of the year to the selected month.
Can I add more KPIs to this template?
Yes. You can add or edit KPIs in the KPI Definition sheet. Then you can update target, actual, and previous year values accordingly.
Why should I enter previous year values?
Because it helps you compare performance year over year. In addition, it shows whether improvement is real or temporary.
What KPI type should I use: Lower the Better or Upper the Better?
- Use Upper the Better (UTB) for KPIs like utilization, output, on-time delivery, FPY.
- Use Lower the Better (LTB) for KPIs like downtime, scrap rate, defect rate, cost per part.
Can I use this dashboard for metal 3D printing as well?
Yes. You can customize KPI groups and add KPIs such as powder reuse rate, oxygen level impact, or build failure reasons.
How often should I update the dashboard?
You should update it monthly. However, you can review trends weekly if you track operational KPIs frequently.
Watch the step-by-step video tutorial:
Visit our YouTube channel to learn step-by-step video tutorials
Click to buy Additive Manufacturing KPI Dashboard in Excel