The adhesives and sealants industry plays a critical role in modern manufacturing. From automotive and construction to electronics and packaging, almost every industry uses adhesives and sealants in production processes. However, companies that manufacture or distribute adhesives and sealants deal with large volumes of operational data such as production costs, raw material expenses, plant performance, sales revenue, and profit margins.When teams store this information across different spreadsheets and reports, managers struggle to analyze performance and make timely decisions. As a result, businesses often face issues such as rising production costs, declining profit margins, delayed deliveries, and inefficient plant operations.Therefore, organizations need a centralized analytics solution that converts raw operational data into meaningful insights.This is where the Adhesives and Sealants Dashboard in Excel becomes extremely powerful.
The Adhesives and Sealants Dashboard in Excel is a ready-to-use analytical dashboard that helps manufacturers, supply chain teams, and business managers track operational performance, analyze production costs, monitor revenue trends, and evaluate profitability.
Because Excel provides pivot tables, pivot charts, slicers, and automated calculations, users can easily transform raw data into interactive reports and visual dashboards.
In this comprehensive guide, you will learn everything about the Adhesives and Sealants Dashboard in Excel, including its structure, features, benefits, best practices, and practical applications.
Click to buy Adhesives and Sealants Dashboard in Excel
What is an Adhesives and Sealants Dashboard in Excel?
An Adhesives and Sealants Dashboard in Excel is a visual analytics tool designed to monitor key operational and financial metrics related to adhesives and sealant production and sales.
Instead of reviewing multiple spreadsheets, managers can view important business metrics in one centralized dashboard.
This dashboard consolidates information such as:
- Revenue performance
- Production cost analysis
- Raw material expenses
- Profit margin tracking
- Plant performance
- Regional sales trends
- Product category performance
- Monthly profitability trends
Because the dashboard uses interactive Excel features, users can easily filter and analyze the data based on region, plant location, product category, or time period.
As a result, decision-makers can quickly identify problems and opportunities.
Why Do Adhesive and Sealant Manufacturers Need a Dashboard?
The adhesives and sealants manufacturing industry operates with complex cost structures and supply chains. Raw materials such as resins, polymers, solvents, and additives often fluctuate in price.
Therefore, companies must continuously monitor production efficiency and profitability.
Without a proper dashboard, businesses face several challenges:
- Production costs increase without clear visibility.
- Profit margins decline due to rising raw material prices.
- Delivery delays affect customer satisfaction.
- Regional sales performance remains unclear.
- Plant efficiency becomes difficult to monitor.
However, a well-designed Excel dashboard solves these challenges by providing clear, visual insights.
Key Features of the Adhesives and Sealants Dashboard in Excel
The Adhesives and Sealants Dashboard in Excel includes multiple analysis pages that provide different perspectives of business performance.
Each page focuses on a specific area of analysis.
The dashboard typically includes five main analytical pages.
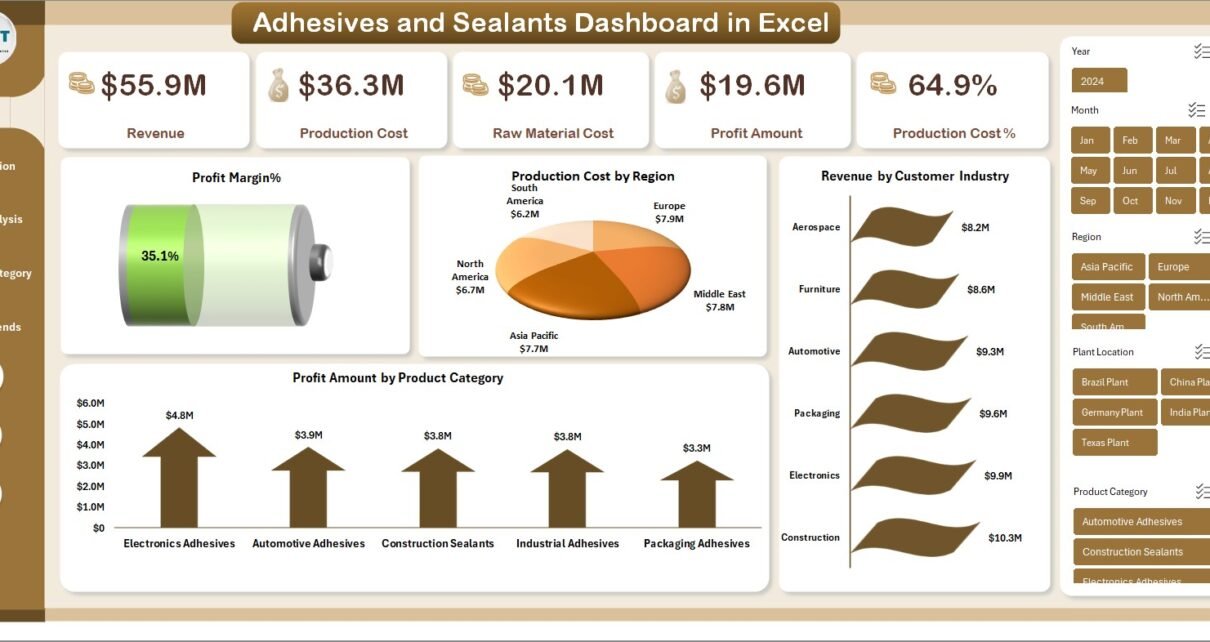
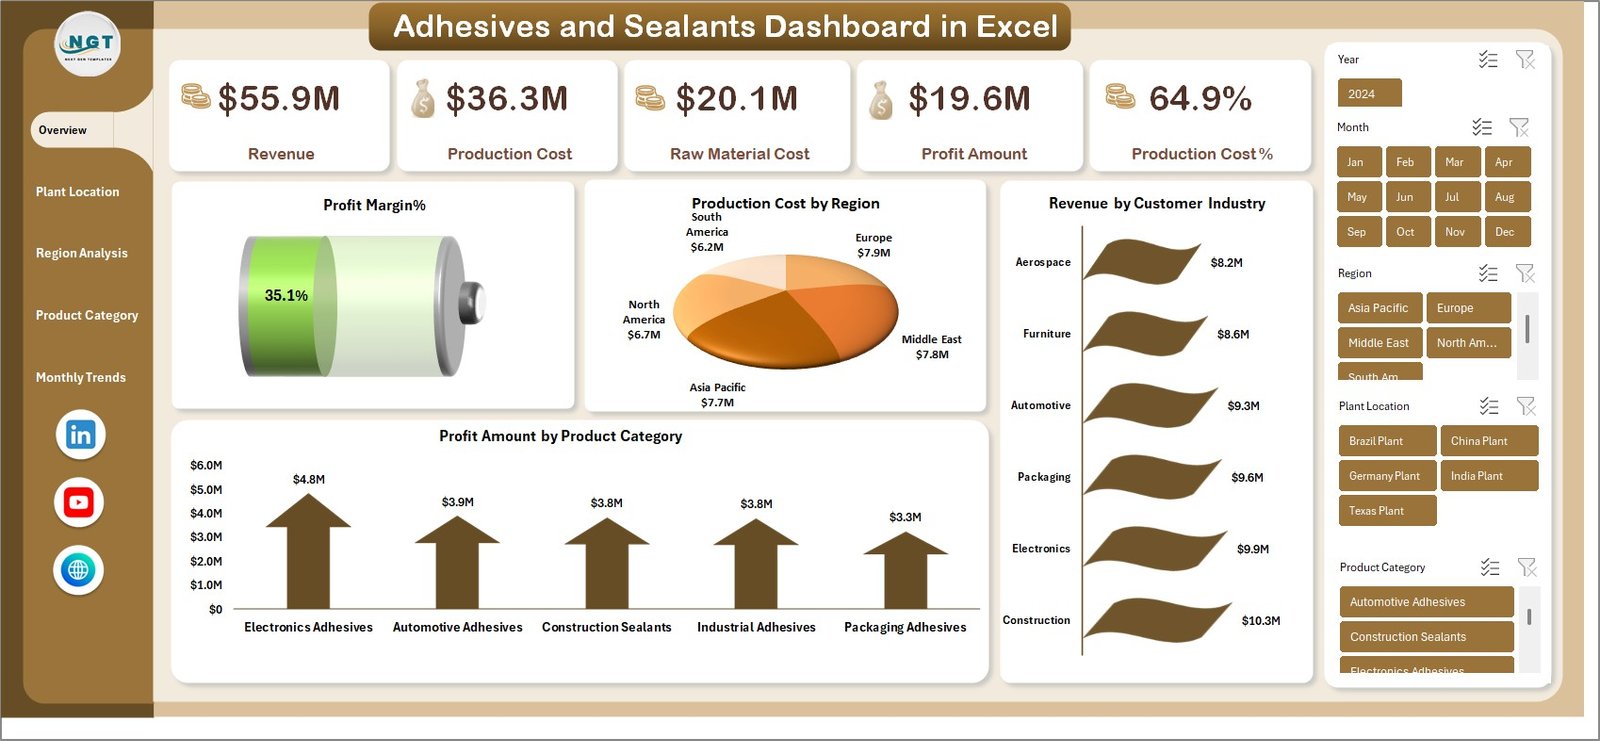
Overview Sheet – The Central Business Performance Snapshot
The Overview Sheet acts as the main dashboard page where users can quickly understand the overall business performance.
It displays key financial metrics along with summary charts.
Key KPIs displayed on the Overview Page
- Revenue
- Production Cost
- Raw Material Cost
- Profit Amount
- Production Cost %
- Profit Margin %
These KPIs help managers evaluate whether the business operates profitably.
Charts Included in the Overview Page
The dashboard also includes several visual charts:
- Production Cost by Region
- Revenue by Customer Industry
- Profit Amount by Product Category
These charts allow managers to quickly identify the most profitable regions, industries, and product categories.
As a result, decision-makers can allocate resources more effectively.
Click to buy Adhesives and Sealants Dashboard in Excel
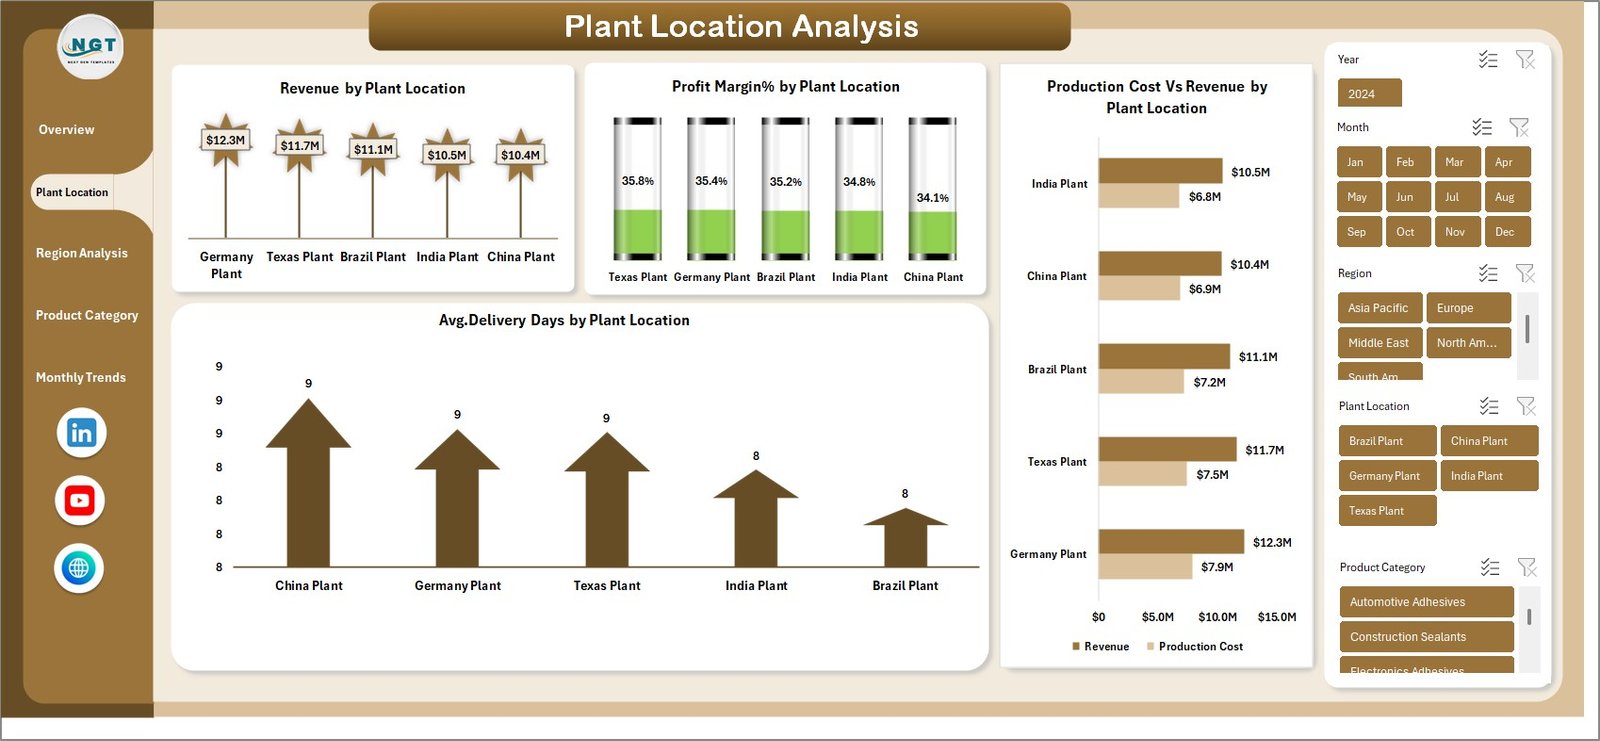
Plant Location Analysis – How Do Different Plants Perform?
Manufacturing companies often operate multiple production plants. Each plant may perform differently based on labor efficiency, logistics, and raw material availability.
Therefore, monitoring plant performance becomes extremely important.
The Plant Location Analysis page focuses on plant-level operational insights.
Charts Included in Plant Location Analysis
- Revenue by Plant Location
- Profit Margin % by Plant Location
- Average Delivery Days by Plant Location
- Production Cost vs Revenue by Plant Location
This analysis helps managers understand:
- Which plant generates the highest revenue
- Which plant delivers the highest profit margin
- Which plant has longer delivery times
- Which plant faces higher production costs
Consequently, companies can optimize production planning.
Click to buy Adhesives and Sealants Dashboard in Excel
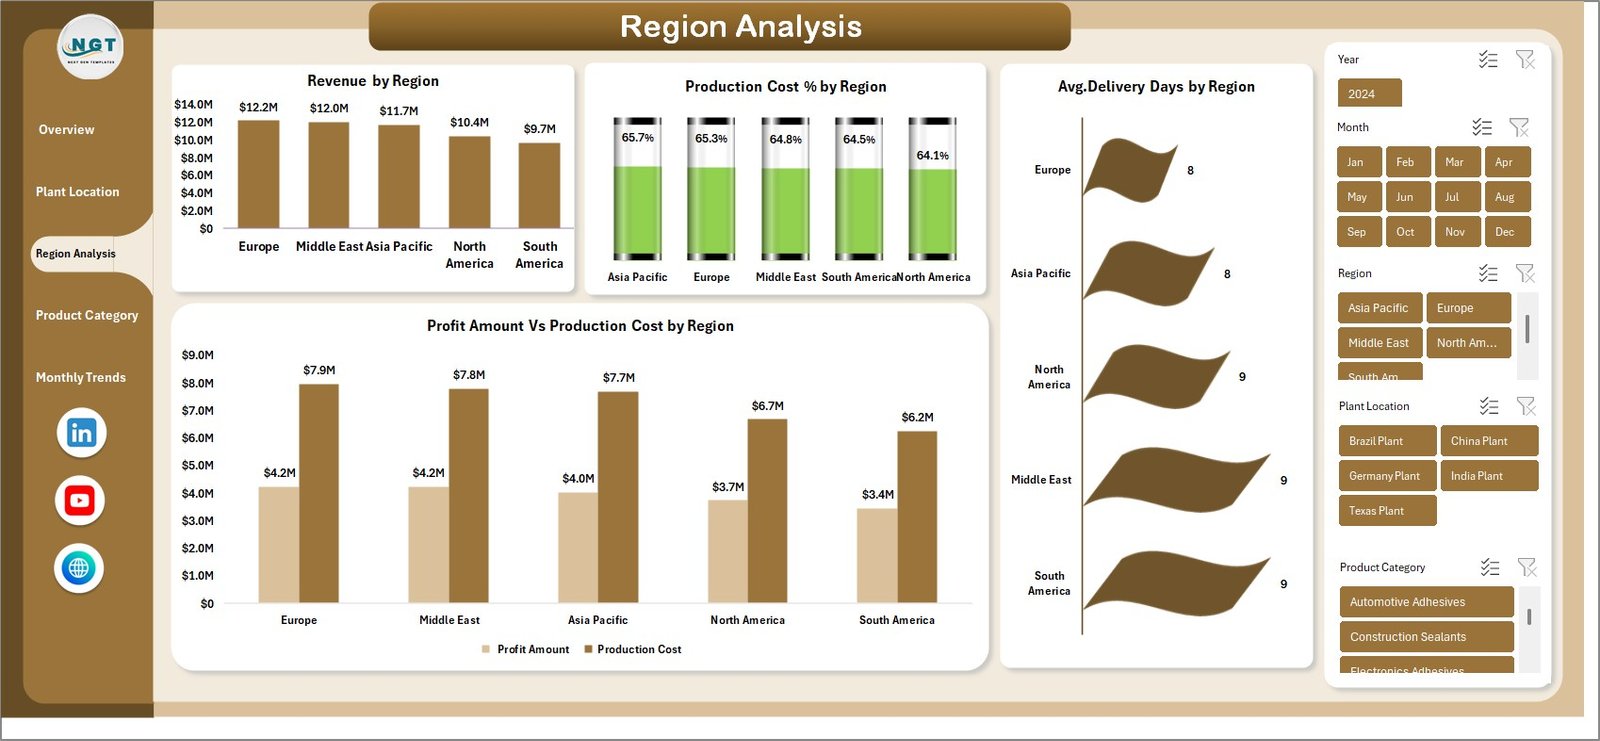
Region Analysis – Understanding Geographic Sales Performance
Companies that sell adhesives and sealants often operate across multiple geographic regions.
Different regions may show different demand levels, pricing structures, and profitability.
The Region Analysis Page provides a clear view of geographic performance.
Charts Included in Region Analysis
- Revenue by Region
- Production Cost % by Region
- Profit Amount vs Production Cost by Region
- Average Delivery Days by Region
This analysis allows organizations to:
- Identify high-performing sales regions
- Detect regions with high operational costs
-
Monitor
delivery performance across regions
- Compare regional profitability
As a result, companies can develop more effective regional strategies.
Click to buy Adhesives and Sealants Dashboard in Excel
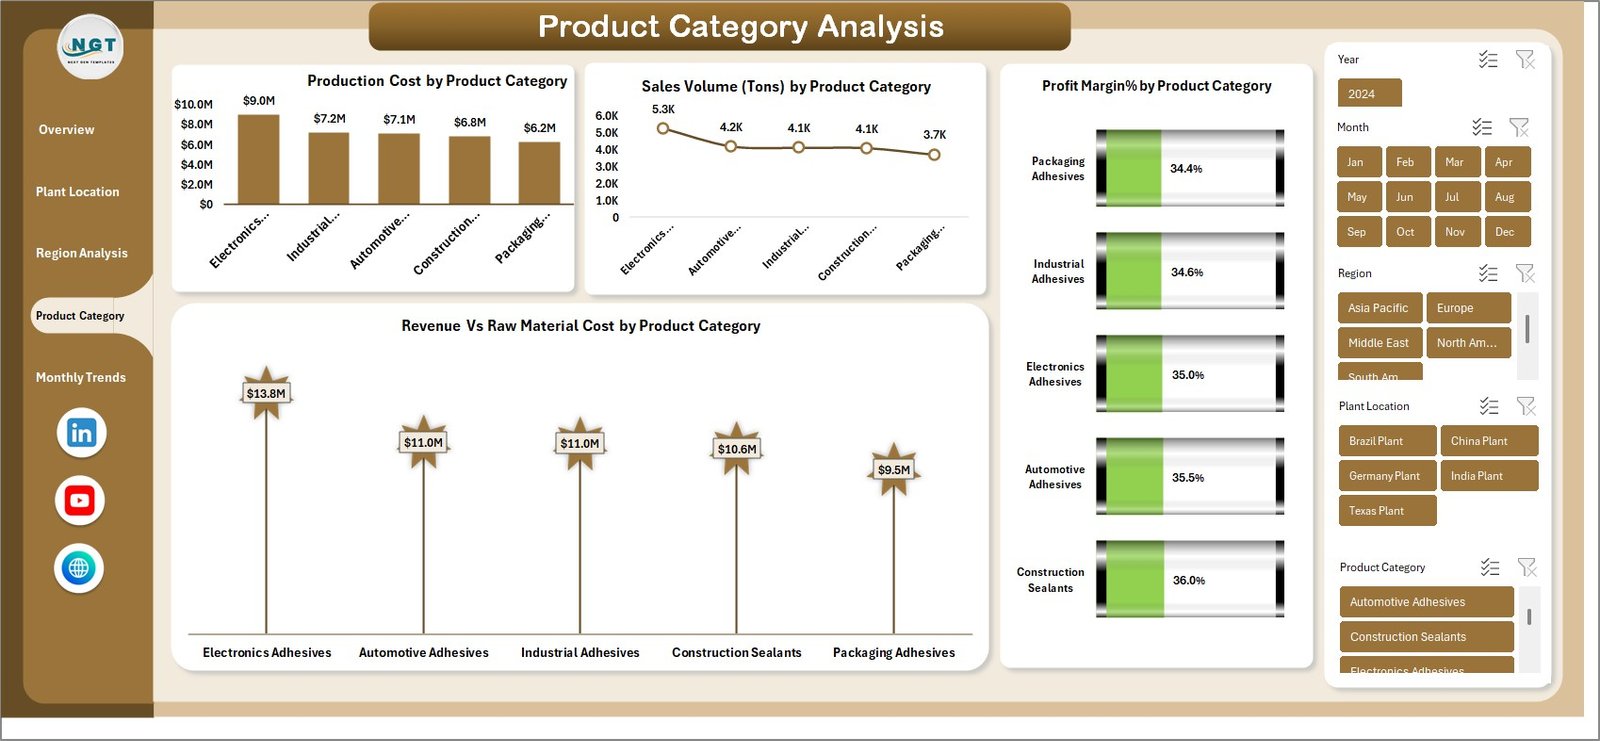
Product Category Analysis – Which Products Drive Profit?
Adhesives and sealants manufacturers typically offer multiple product categories, such as:
- Industrial adhesives
- Construction sealants
- Automotive adhesives
- Packaging adhesives
- Silicone sealants
Each category may contribute differently to overall revenue and profitability.
The Product Category Analysis Page provides detailed insights into product performance.
Charts Included in Product Category Analysis
- Production Cost by Product Category
- Sales Volume (Tons) by Product Category
- Revenue vs Raw Material Cost by Product Category
- Profit Margin % by Product Category
This analysis helps businesses identify:
- High-demand products
- Cost-heavy product lines
- Most profitable product categories
Therefore, managers can focus on expanding profitable product lines.
Click to buy Adhesives and Sealants Dashboard in Excel
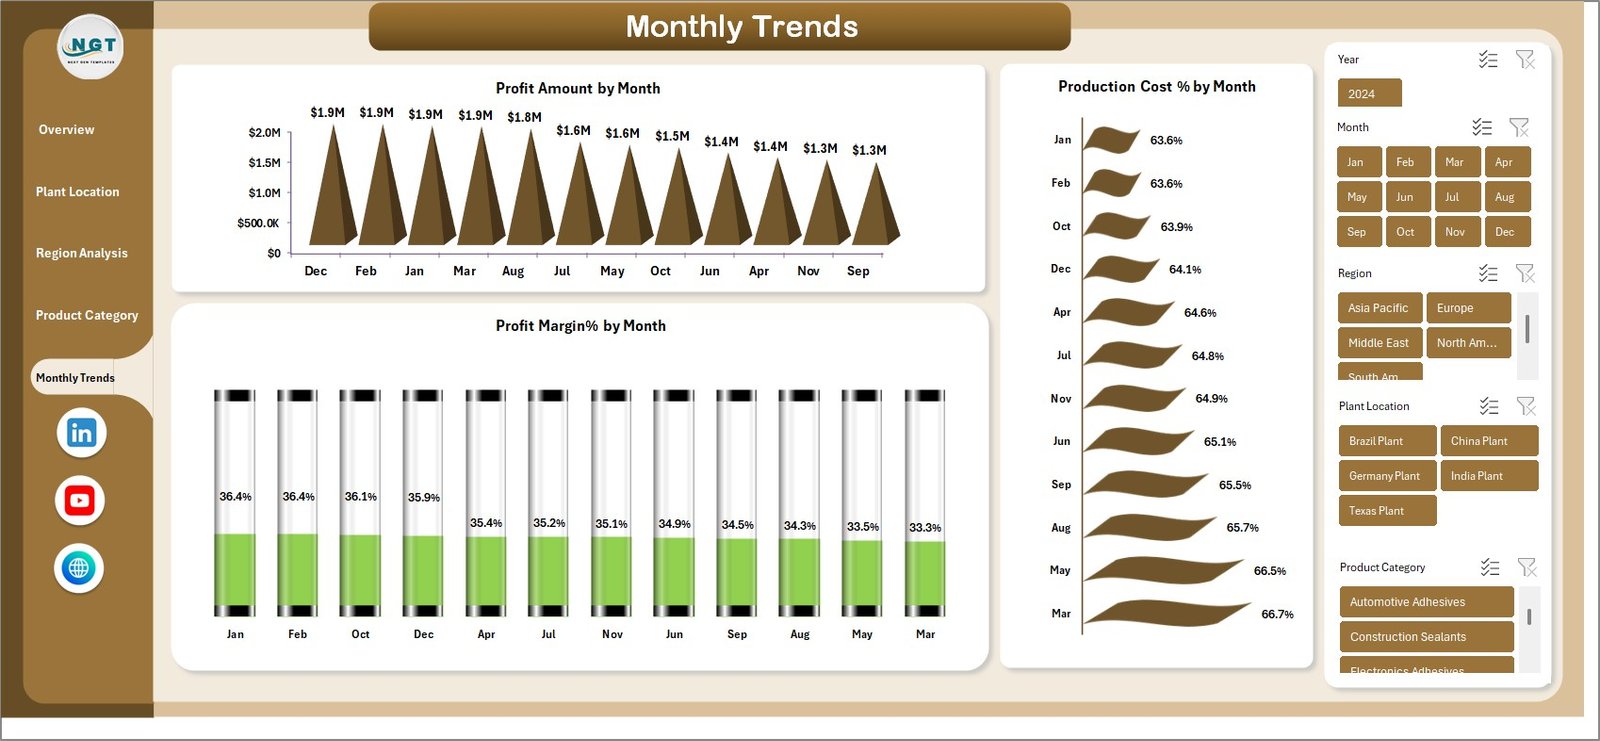
Monthly Trends – Monitoring Business Performance Over Time
Time-based analysis helps organizations identify trends and seasonal patterns.
The Monthly Trends Page focuses on tracking performance throughout the year.
Charts Included in Monthly Trends
- Profit Amount by Month
- Profit Margin % by Month
- Production Cost % by Month
This analysis helps businesses:
- Detect seasonal demand patterns
- Monitor cost fluctuations
- Evaluate long-term profitability trends
Consequently, companies can make better forecasting decisions.
Click to buy Adhesives and Sealants Dashboard in Excel
Advantages of the Adhesives and Sealants Dashboard in Excel
Implementing a dashboard for adhesives and sealants operations offers several benefits.
- Centralized Data Monitoring
The dashboard consolidates multiple datasets into a single analytical interface.
Therefore, users can easily monitor performance without switching between different reports.
- Faster Decision Making
Because the dashboard provides real-time insights, managers can quickly respond to operational challenges.
As a result, companies can reduce losses and improve efficiency.
- Improved Cost Control
Production cost and raw material expenses significantly affect profitability.
The dashboard allows managers to monitor cost structures closely.
- Better Production Planning
Plant-level performance insights help organizations optimize manufacturing capacity.
Consequently, companies can improve plant utilization.
- Enhanced Sales Strategy
Regional and product-level analysis helps businesses identify the most profitable markets and products.
Therefore, companies can develop targeted sales strategies.
Opportunities for Improvement in Adhesives and Sealants Analytics
Although dashboards provide powerful insights, organizations can further enhance their analytical capabilities.
Here are some opportunities for improvement.
Advanced Demand Forecasting
Companies can integrate predictive models to forecast demand for different adhesive products.
Raw Material Price Monitoring
Tracking global raw material price trends can help businesses manage cost volatility.
Customer Segmentation Analysis
Analyzing customer industries can help identify high-value customer segments.
Inventory Optimization
Integrating inventory tracking can help reduce storage costs and avoid production delays.
Best Practices for the Adhesives and Sealants Dashboard in Excel
To maximize the value of the dashboard, organizations should follow several best practices.
Maintain Accurate Data
Always ensure that the raw data used in the dashboard remains accurate and updated.
Clean and consistent data improves dashboard reliability.
Use Pivot Tables and Pivot Charts
Pivot tables allow users to dynamically analyze data.
Because pivot charts automatically update with filters, they enhance dashboard interactivity.
Implement Data Validation
Data validation ensures that users enter correct data formats.
Therefore, it reduces the chances of reporting errors.
Use Slicers for Interactive Filtering
Slicers allow users to filter the dashboard by region, plant, or product category.
Consequently, users can quickly explore different data perspectives.
Automate Data Refresh
Automating data updates ensures that the dashboard always reflects the latest information.
This improves operational decision-making.
Who Can Benefit from the Adhesives and Sealants Dashboard?
Several professionals can use this dashboard effectively.
Manufacturing Managers
They can monitor production efficiency and plant performance.
Finance Teams
They can analyze cost structures and profitability.
Sales Teams
They can track regional revenue performance.
Supply Chain Managers
They can monitor delivery performance and logistics efficiency.
Business Executives
They can review high-level KPIs for strategic decision-making.
Conclusion
The Adhesives and Sealants Dashboard in Excel provides a powerful solution for monitoring operational performance, financial metrics, and production efficiency.
Because adhesives manufacturing involves complex cost structures, companies need clear visibility into revenue, production cost, raw material expenses, and profit margins.
This dashboard simplifies business analytics by transforming raw data into clear visual insights.
With pages dedicated to overview metrics, plant analysis, regional performance, product category insights, and monthly trends, organizations can quickly understand their operational performance.
As a result, managers can make data-driven decisions that improve efficiency, reduce costs, and increase profitability.
Therefore, implementing the Adhesives and Sealants Dashboard in Excel becomes a valuable step toward building a more efficient and profitable manufacturing operation.
Frequently Asked Questions (FAQs)
What is an Adhesives and Sealants Dashboard?
An Adhesives and Sealants Dashboard is a visual analytics tool that tracks production, revenue, costs, and profitability within adhesives manufacturing operations.
Why should companies use an Excel dashboard for adhesives manufacturing?
Excel dashboards allow companies to analyze production and financial data quickly using pivot tables, charts, and automated calculations.
What KPIs are commonly tracked in an adhesives dashboard?
Typical KPIs include revenue, production cost, raw material cost, profit amount, production cost percentage, and profit margin percentage.
Can Excel dashboards support large manufacturing datasets?
Yes. Excel dashboards can handle large datasets when combined with pivot tables, Power Query, and efficient data modeling.
Who should use the Adhesives and Sealants Dashboard?
Manufacturing managers, finance teams, supply chain professionals, and business executives can all benefit from this dashboard.
Visit our YouTube channel to learn step-by-step video tutorials
Watch the step-by-step video tutorial:
Click to buy Adhesives and Sealants Dashboard in Excel