Adult Literacy Programs Dashboard in Power BI is a professionally designed, ready-to-use interactive analytics template that empowers literacy organizations, NGOs, educational institutions, and government education departments to visualize and analyze their literacy program data effectively. This Power BI dashboard covers revenue tracking, materials cost analysis, funding efficiency, learner demographics, program outcomes, and instructor performance across 5 comprehensive dashboard pages — giving decision-makers complete visibility into every aspect of adult literacy program management.
Whether you are managing adult basic education, ESL programs, workplace literacy initiatives, or community reading circles, this dashboard eliminates manual reporting and delivers instant analytical clarity. Built using Microsoft Power BI, the template automatically updates all visuals when filters are applied or datasets are refreshed, enabling faster and more confident strategic decisions.
Key Features of Adult Literacy Programs Dashboard in Power BI
The Adult Literacy Programs Dashboard in Power BI includes 5 interactive dashboard pages, dynamic KPI cards, smart slicers and filters, monthly trend analysis, funding efficiency tracking, regional performance comparison, and learner demographics insights. This template tracks 5 key performance indicators at the overview level: Total Records, Total Revenue, Total Materials Cost, Net Funding Surplus, and Average Satisfaction Rating.
With interactive Power BI slicers, you can filter data by program type, region, literacy level, referral source, and more — giving you granular control over the analysis. The dashboard also includes charts that reveal patterns in monthly revenue, enrollment distribution by program type, and regional funding performance. All charts and visuals update automatically when the underlying data is refreshed, making it a powerful self-service analytics solution.
Organizations like literacy councils, government agencies, and international NGOs can use this template to streamline performance reporting, improve funding transparency, and make evidence-based decisions about resource allocation. Explore more Power BI Dashboard Templates for other domains.
Dashboard Pages Explained
1. Overview Page
The Overview page serves as the central command center for your literacy program analytics. At the top, you will find high-level KPI cards displaying Total Records, Total Revenue, Total Materials Cost, Net Funding Surplus, and Avg Satisfaction Rating. These cards provide an instant snapshot of your organization’s overall performance.
Below the cards, the page features several analytical charts. Total Revenue by Month Name displays monthly revenue trends, helping you identify seasonal patterns and plan budgets accordingly. The Funding Efficiency chart measures how effectively your programs convert funding into tangible outcomes. Total Records by Program Type compares enrollment across different literacy program categories such as basic education, ESL, and workplace literacy. Total Revenue and Net Funding Surplus by Region highlights geographic performance differences, enabling you to allocate resources strategically to underperforming areas. Multiple interactive slicers allow you to filter the entire dashboard in one click.
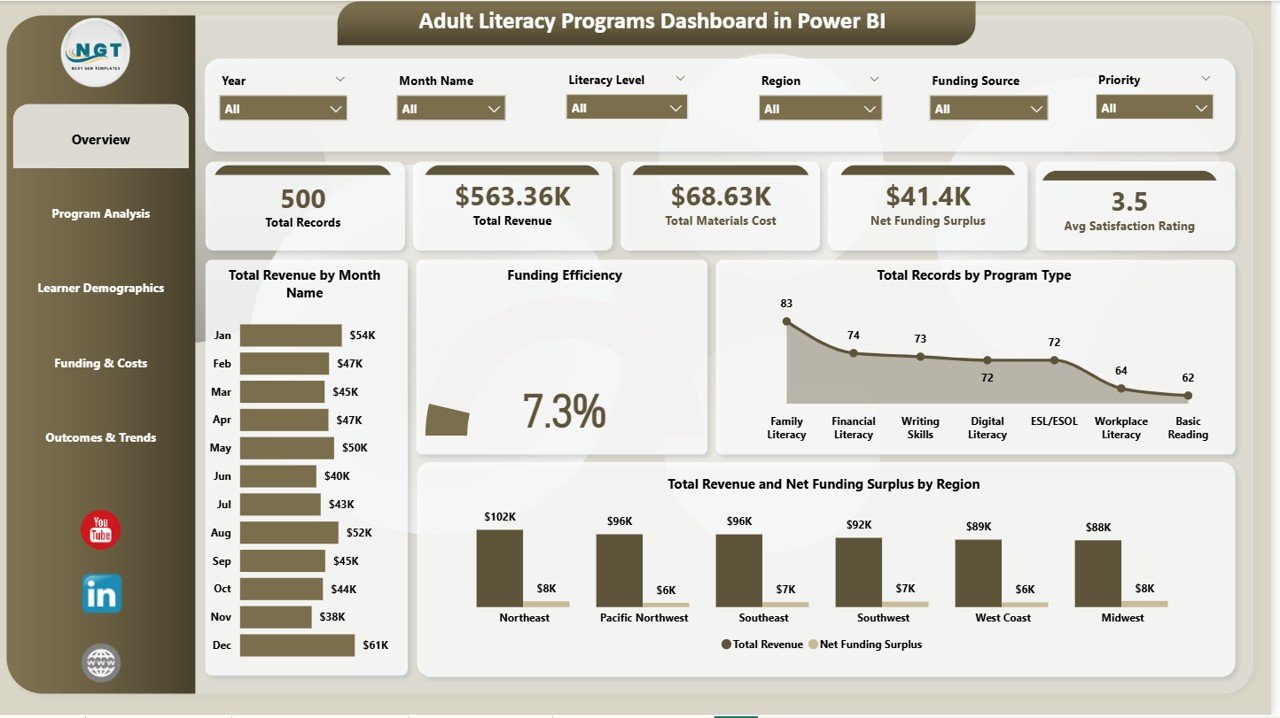 Adult Literacy Programs Dashboard in Power BI
2. Program Analysis
The Program Analysis page dives deeper into individual program performance. Total Revenue by Program Name ranks revenue generation across all registered literacy programs, making it easy to identify top performers and underperforming initiatives. Avg Satisfaction Rating by Program Name reveals which programs deliver the highest learner satisfaction, a critical metric for donor reporting and program continuation decisions.
Total Materials Cost by Literacy Level breaks down spending across beginner, intermediate, and advanced literacy levels, helping you understand where your materials budget is being consumed most heavily. This page is essential for program managers who need to justify funding allocation and optimize resource distribution across programs.
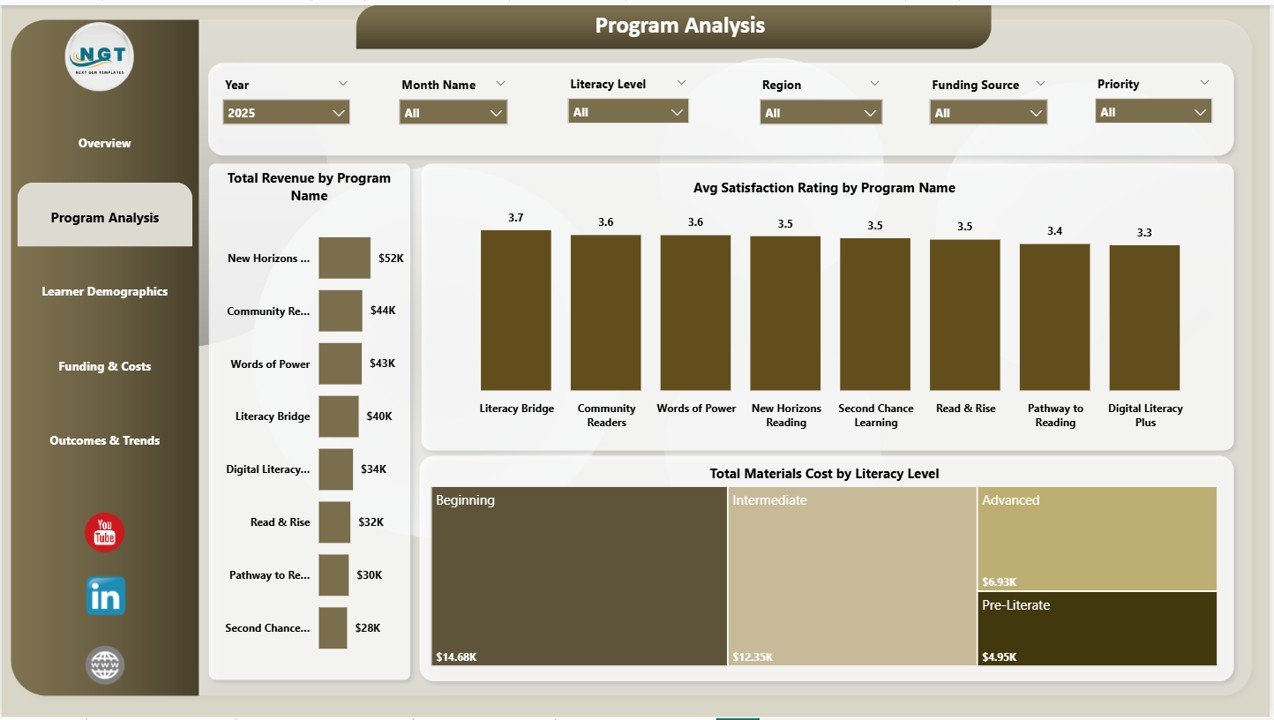 Program Analysis Page
3. Learner Demographics
Understanding your learner population is critical for targeted outreach and program design. The Learner Demographics page includes Total Revenue by Learner Age Group, showing how different age brackets contribute to overall enrollment and revenue. Total Records by Referral Source tracks where your learners are coming from — whether through community outreach, government referrals, self-enrollment, or partner organizations.
Avg Post-Assessment Score by Learner Age Group measures actual learning outcomes across demographics, providing evidence of program effectiveness that can be shared with donors, boards, and government stakeholders. This page helps you tailor your programs to the populations that need them most.
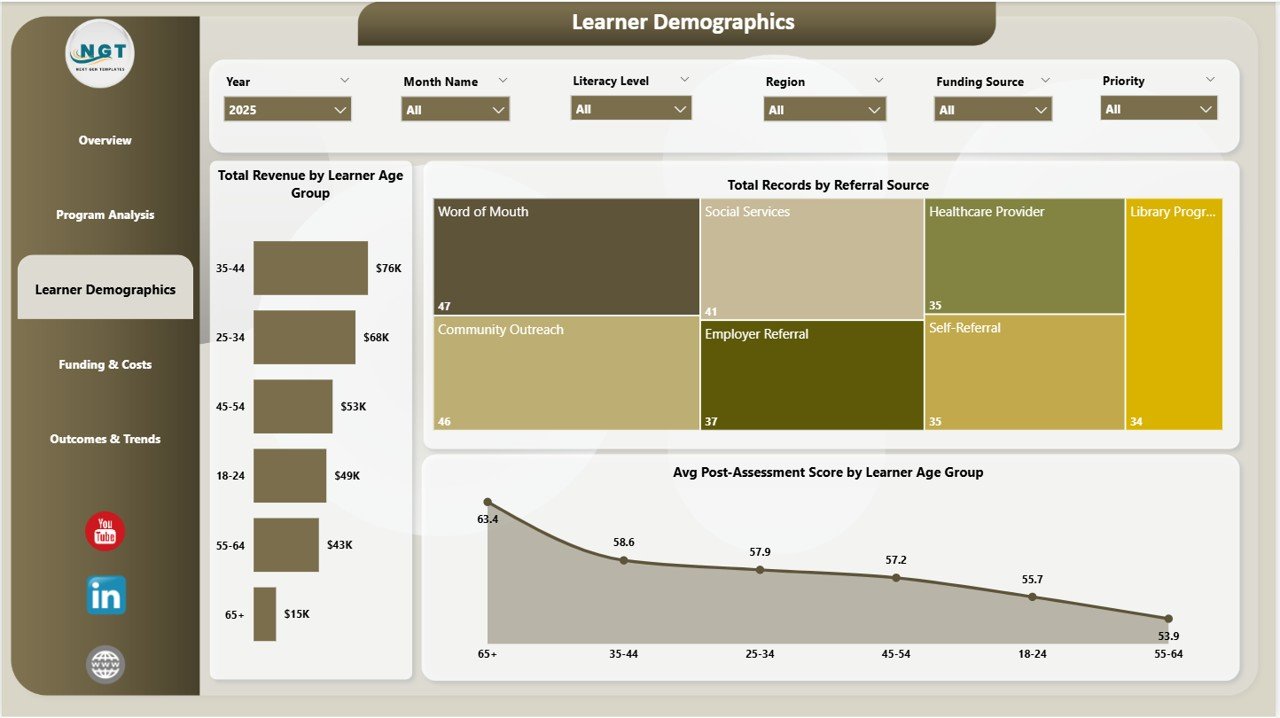 Learner Demographics Page
4. Funding and Costs
Financial sustainability is a major concern for literacy organizations. The Funding and Costs page addresses this with Total Revenue by Funding Source, showing which funding channels — grants, donations, government funding, tuition — contribute the most to your revenue. Net Funding Surplus by Region highlights which geographic areas are financially efficient and which may need budget rebalancing.
Total Instructor Cost by Month Name tracks how instructor-related expenses evolve over time, enabling you to forecast costs and plan hiring cycles. This page is invaluable for finance teams, grant managers, and executive leaders who need clear visibility into where money comes from and where it goes.
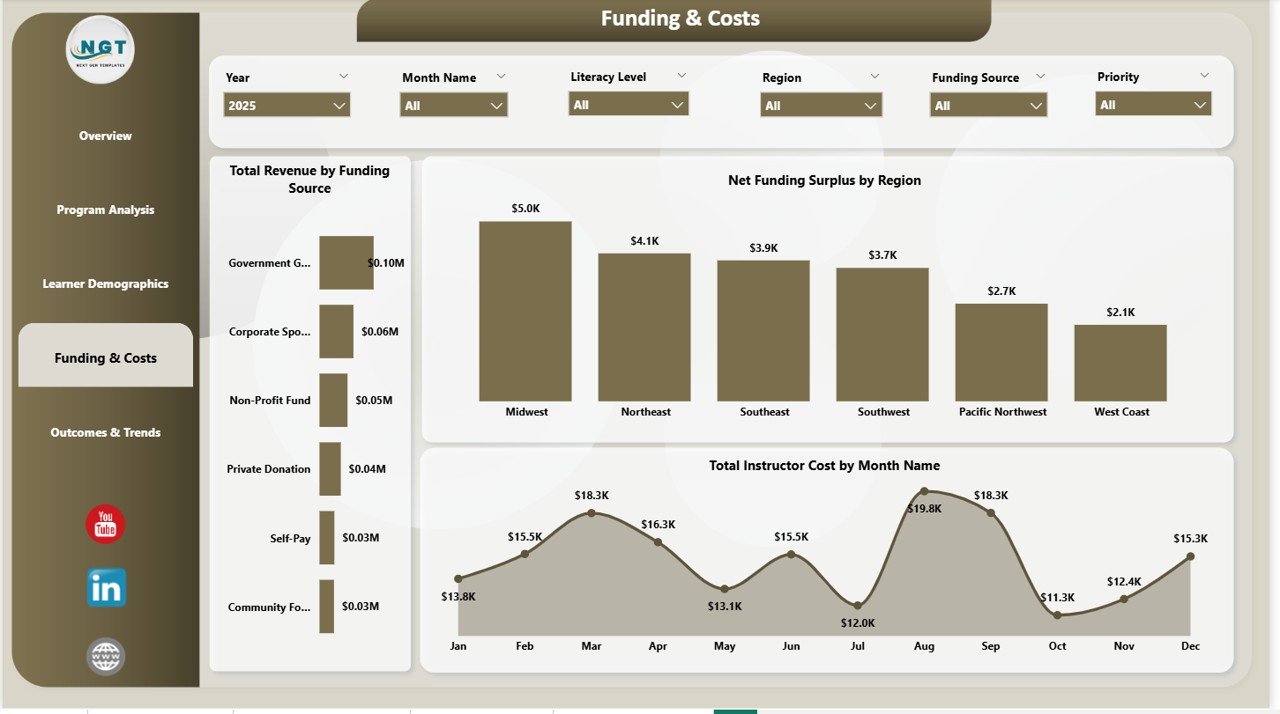 Funding and Costs Page
5. Outcomes and Trends
The Outcomes and Trends page evaluates long-term program success. Total Records by Month Name tracks enrollment trends over time, revealing growth patterns or seasonal dips. Avg Satisfaction Rating by Instructor identifies which instructors consistently deliver the best learner experience — useful for training, performance reviews, and recognition programs.
Total Revenue by Priority shows revenue distribution by priority level, helping leadership understand which priority categories are driving the most financial activity. This page provides the trend data needed for annual reviews, board presentations, and strategic planning sessions.
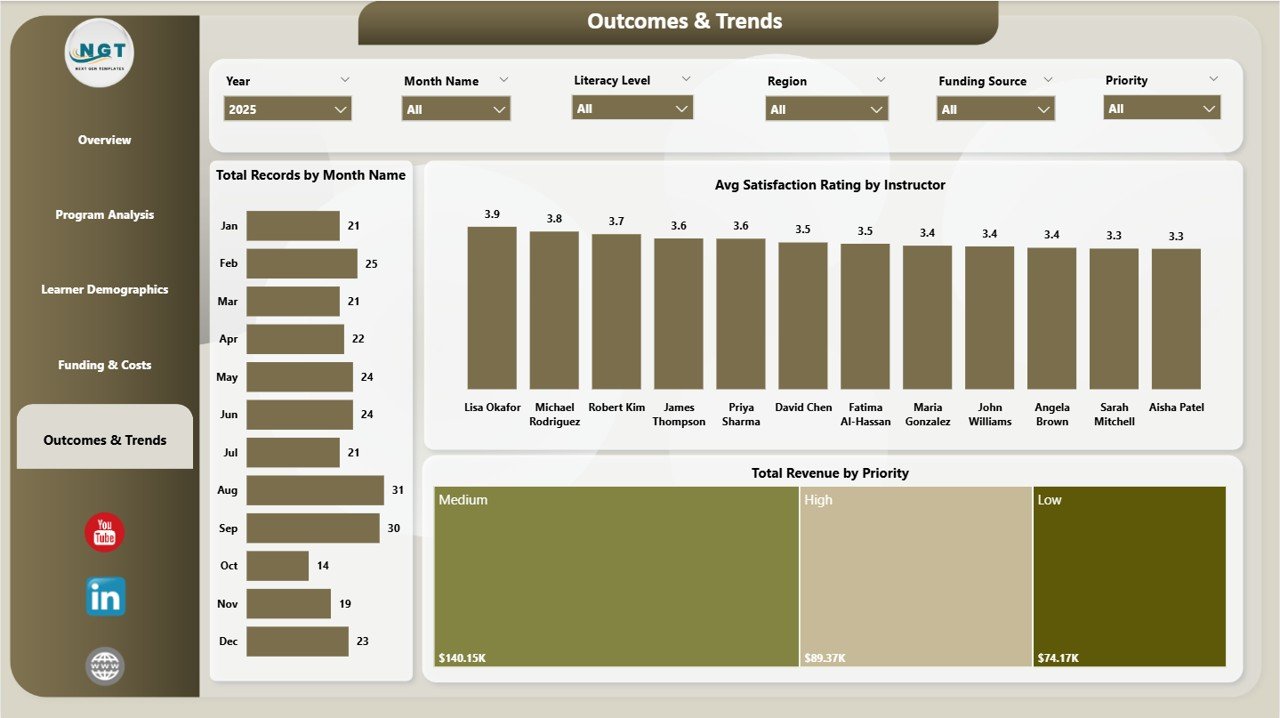 Outcomes and Trends Page
Advantages of Adult Literacy Programs Dashboard in Power BI
This dashboard eliminates the need for manual report compilation by centralizing all literacy program data into one interactive analytics platform. Key advantages include automated visual updates when data is refreshed, interactive filtering that enables deep-dive analysis without creating new reports, professional chart layouts suitable for donor presentations and board meetings, and regional comparison capabilities that highlight geographic performance differences.
The Power BI platform also enables cloud publishing through Power BI Service, allowing you to share dashboards securely with remote teams, stakeholders, and funding partners. Compared to traditional spreadsheet reporting, Power BI delivers significantly faster insights with richer visual storytelling.
Opportunities for Improvement
While this dashboard provides comprehensive coverage of literacy program analytics, organizations could further enhance it by integrating real-time data connections from learning management systems (LMS) or student information systems (SIS). Adding individual learner progress tracking, certificate completion rates, or attendance metrics would deepen the analysis. Custom DAX measures could also be added for more advanced calculations such as cost-per-learner or completion rate percentages.
Best Practices for Using This Dashboard
- Update your data source regularly (weekly or monthly) to keep dashboard insights current.
- Use the slicer filters strategically to focus on specific regions, programs, or time periods during review meetings.
- Publish your dashboard to Power BI Service to enable secure online access for remote stakeholders.
- Schedule automatic data refreshes in Power BI Service to ensure your dashboard always shows the latest data.
- Combine this dashboard with Power BI’s built-in commenting and annotation features for collaborative analysis.
Explore Relevant Templates
If you found this Adult Literacy Programs Dashboard useful, explore these related templates:
- Adult Literacy Programs Dashboard in Excel — The same literacy analytics solution in a pivot-powered Excel format with 7 worksheets.
- Educational Nonprofits Dashboard in Power BI — Track nonprofit education program performance with interactive Power BI analytics.
- Digital Learning KPI Dashboard in Power BI — Monitor digital learning KPIs including course completion, engagement, and training success.
- Rural Development KPI Dashboard in Power BI — Track infrastructure, agriculture, and social development KPIs with target comparison.
Frequently Asked Questions
What is the best Power BI dashboard for tracking adult literacy programs?
The Adult Literacy Programs Dashboard in Power BI by NextGenTemplates is a comprehensive analytics solution that tracks 5 key metrics across 5 interactive pages covering program performance, learner demographics, funding analysis, and outcome trends. It is designed specifically for literacy organizations, NGOs, and education departments.
How do I use the Adult Literacy Programs Dashboard in Power BI?
Download the .pbix file, open it in Power BI Desktop (free from Microsoft), connect or replace the sample data with your own literacy program dataset, and click Refresh. All 5 dashboard pages update automatically with your data. Use the interactive slicers to filter by program type, region, age group, and more.
Can this Power BI dashboard be shared with my team online?
Yes. After customizing the dashboard in Power BI Desktop, you can publish it to Power BI Service and share it securely with team members, donors, and stakeholders who have Power BI Pro or Premium licenses.
Does this dashboard require coding or DAX knowledge?
No. The dashboard is ready to use out of the box. Simply replace the sample data and refresh. All measures, visuals, and slicers are pre-built. Advanced users can add custom DAX measures if needed, but it is not required.
What types of literacy programs can this dashboard track?
This dashboard supports any type of adult literacy program including adult basic education (ABE), English as a Second Language (ESL), workplace literacy, community reading programs, digital literacy initiatives, and government-funded education schemes. The program types, regions, and categories are fully customizable.
Conclusion
The Adult Literacy Programs Dashboard in Power BI is an essential analytics tool for any organization managing adult literacy programs. With 5 interactive pages, dynamic KPI cards, smart slicers, and professional chart layouts, this template transforms complex program data into clear, actionable insights. Whether you need to report to donors, optimize funding allocation, or evaluate instructor performance, this dashboard gives you the visibility and confidence to make data-driven decisions.
Click here to Purchase Adult Literacy Programs Dashboard in Power BI
Visit our YouTube channel for step-by-step video tutorials: