Adventure tourism has become one of the fastest-growing segments of the global travel industry. Travelers no longer want traditional sightseeing experiences only. Instead, they look for thrilling outdoor activities such as trekking, rafting, paragliding, mountain biking, scuba diving, wildlife expeditions, and many other adventure experiences.
However, as the adventure tourism industry grows rapidly, businesses must manage large amounts of booking data, customer feedback, revenue records, tour package performance, and seasonal demand patterns. Without a structured analytics system, travel companies struggle to understand customer behavior, monitor booking performance, and optimize revenue strategies.
Therefore, organizations need a powerful analytical tool that converts tourism data into meaningful insights. This is exactly where the Adventure Tourism Dashboard in Power BI becomes extremely valuable.
The Adventure Tourism Dashboard in Power BI provides a comprehensive visual analytics solution that helps tourism companies monitor bookings, analyze revenue trends, track customer ratings, and evaluate tour package performance. Because Power BI offers interactive visuals, slicers, and dynamic reports, tourism managers can easily identify trends and make better business decisions.
In this article, you will learn everything about the Adventure Tourism Dashboard in Power BI, including its features, benefits, best practices, and practical use cases.
What Is an Adventure Tourism Dashboard in Power BI?
An Adventure Tourism Dashboard in Power BI is an interactive business intelligence solution that helps tourism organizations analyze and monitor adventure travel performance.
It collects tourism data from multiple sources such as booking systems, travel portals, CRM systems, and financial platforms. After that, the dashboard transforms the raw data into interactive visuals and KPIs.
Because Power BI supports powerful visualization tools, the dashboard allows managers to quickly understand:
-
Booking trends
-
Revenue patterns
-
Customer satisfaction levels
-
Tour package popularity
-
Destination performance
-
Seasonal demand patterns
As a result, travel agencies, tour operators, and tourism managers can make data-driven decisions and improve operational efficiency.
Why Does the Adventure Tourism Industry Need Data Analytics?
Adventure tourism involves multiple operational components. Businesses must manage destinations, adventure activities, guides, safety measures, transportation, accommodation, and customer satisfaction.
Without proper analytics, it becomes extremely difficult to track performance.
For example:
-
Some destinations may receive high bookings but generate low revenue.
-
Certain tour packages may receive poor customer ratings.
-
Seasonal demand fluctuations may impact revenue planning.
Therefore, companies must use dashboards to monitor performance continuously.
A Power BI adventure tourism dashboard solves this problem because it converts complex data into simple visual insights.
Key Features of the Adventure Tourism Dashboard in Power BI
The Adventure Tourism Dashboard in Power BI contains five interactive analytical pages designed to provide a comprehensive overview of tourism operations.
Each page focuses on a different aspect of adventure tourism performance.
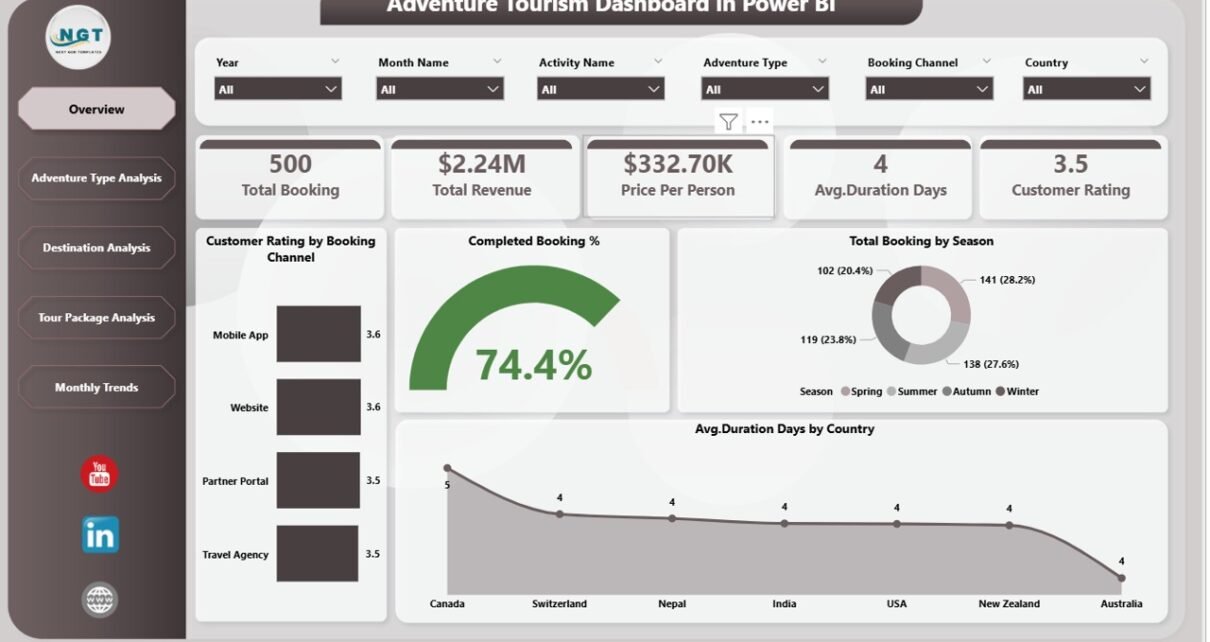
1. Overview Page
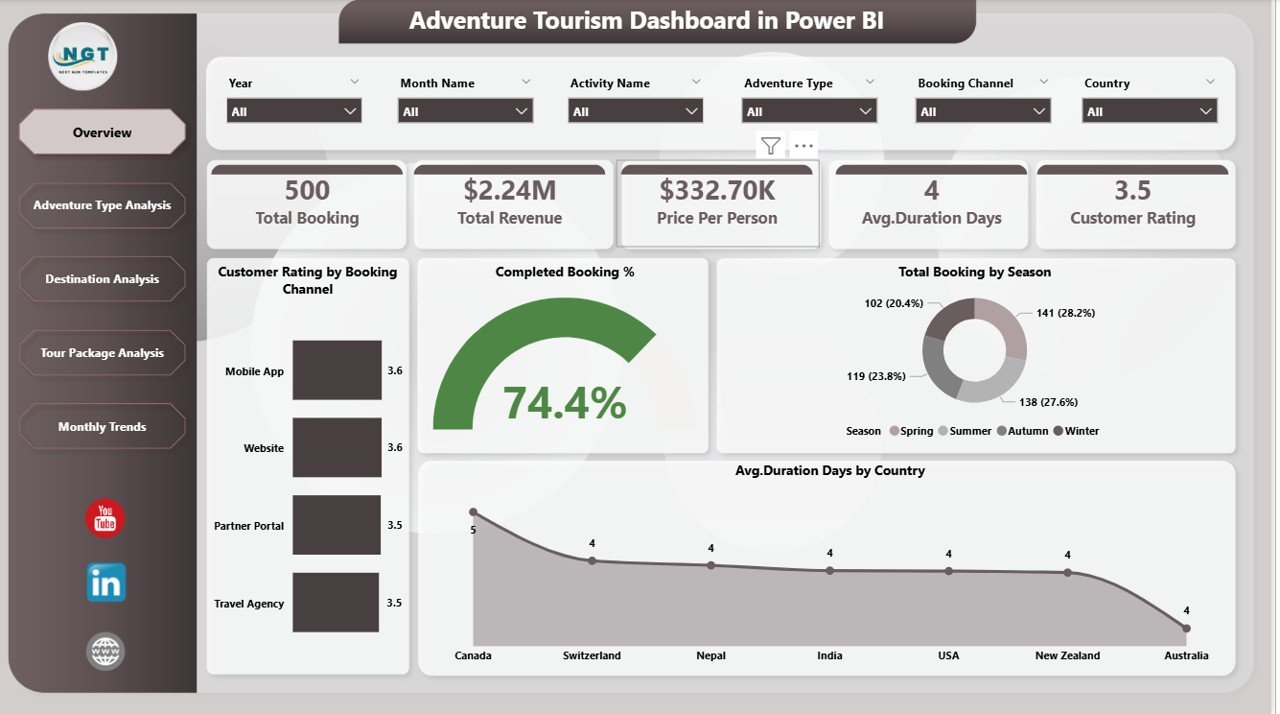
The Overview Page works as the main summary page of the dashboard. It provides a quick snapshot of tourism performance across multiple metrics.
This page contains interactive slicers that allow users to filter data dynamically.
KPI Cards Included
The dashboard displays the following important KPI cards:
-
Customer Rating by Booking Channel
-
Completed Booking %
-
Total Booking by Season
-
Average Duration Days by Country
Why This Page Is Important
The overview page helps managers quickly understand overall tourism performance. Instead of analyzing multiple reports separately, they can see the most important insights in one place.
For example:
-
Which season generates the most bookings
-
Which booking channel receives the best customer ratings
-
Average trip duration across destinations
-
Overall booking completion rate
Therefore, managers can immediately identify trends and take action.
2. Adventure Type Analysis
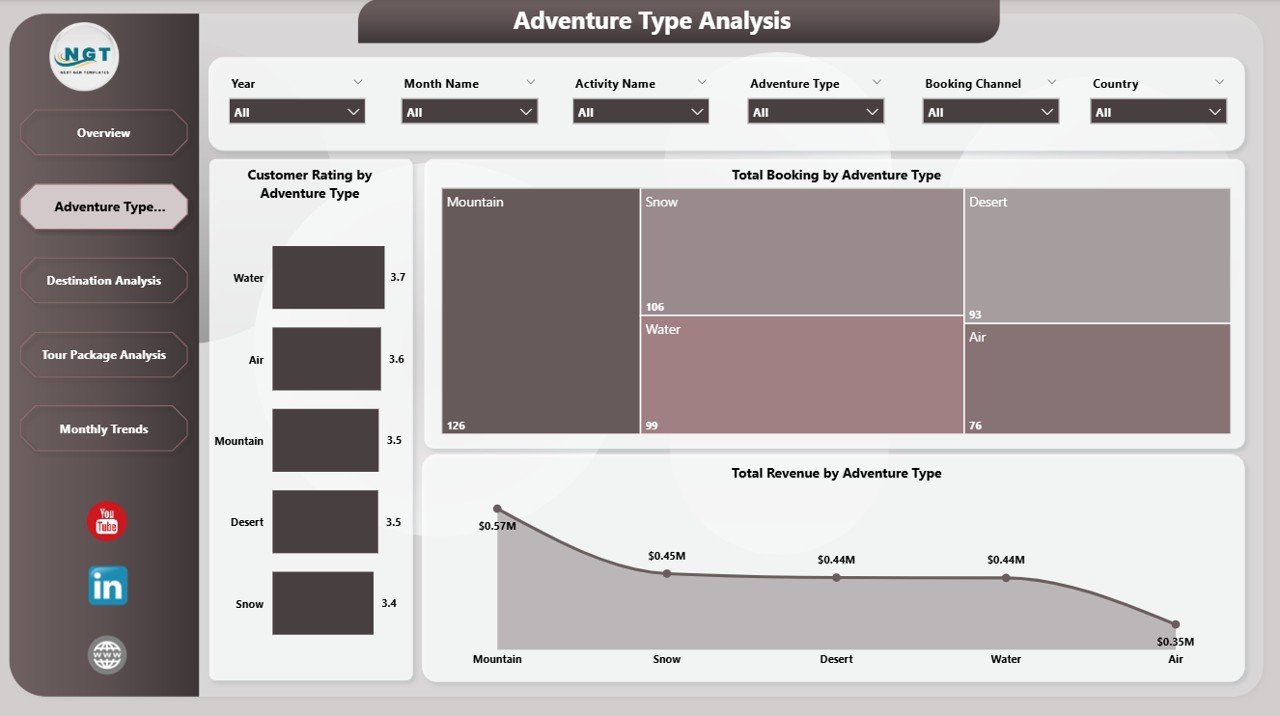
Adventure tourism offers various activity types such as trekking, rafting, skiing, scuba diving, and wildlife expeditions. Each activity generates different levels of revenue and customer engagement.
The Adventure Type Analysis page helps tourism companies analyze how each adventure category performs.
Charts Included
This page includes the following charts:
-
Customer Rating by Adventure Type
-
Total Booking by Adventure Type
-
Total Revenue by Adventure Type
Insights Provided
This page helps managers answer important questions such as:
-
Which adventure activity receives the highest bookings?
-
Which adventure type generates the highest revenue?
-
Which activity receives the best customer ratings?
For example, if rafting generates high bookings but lower ratings, the company may improve safety standards or service quality.
3. Destination Analysis
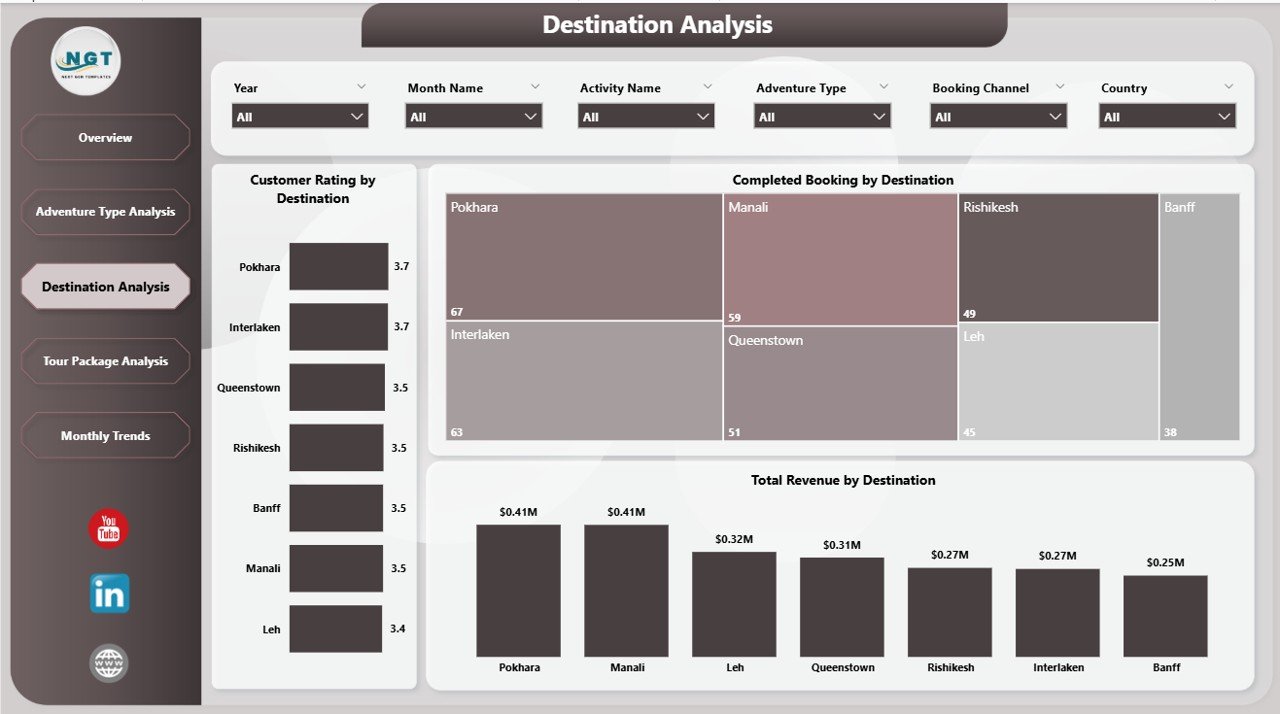
Adventure tourism heavily depends on destination popularity. Some locations attract more visitors due to natural landscapes, accessibility, or unique experiences.
The Destination Analysis page evaluates performance across different travel destinations.
Charts Included
This page includes the following charts:
-
Customer Rating by Destination
-
Completed Booking by Destination
-
Total Revenue by Destination
Insights Provided
The destination analysis page allows tourism managers to:
-
Identify top-performing destinations
-
Monitor revenue generated by each destination
-
Evaluate customer satisfaction levels across locations
For example, if a destination generates high revenue but low ratings, the company may improve accommodation, safety arrangements, or tour guides.
4. Tour Package Analysis

Tour operators usually offer multiple tour packages that combine different adventure activities and destinations.
The Tour Package Analysis page focuses on analyzing the performance of different tour packages.
Charts Included
This page includes:
-
Customer Rating by Tour Package
-
Total Booking by Tour Package
-
Total Revenue by Tour Package
Insights Provided
Using this page, tourism companies can determine:
-
Which tour package attracts the most travelers
-
Which package generates the highest revenue
-
Which packages require improvement
For example, if a premium package generates low bookings, managers may revise pricing or marketing strategies.
5. Month Analysis
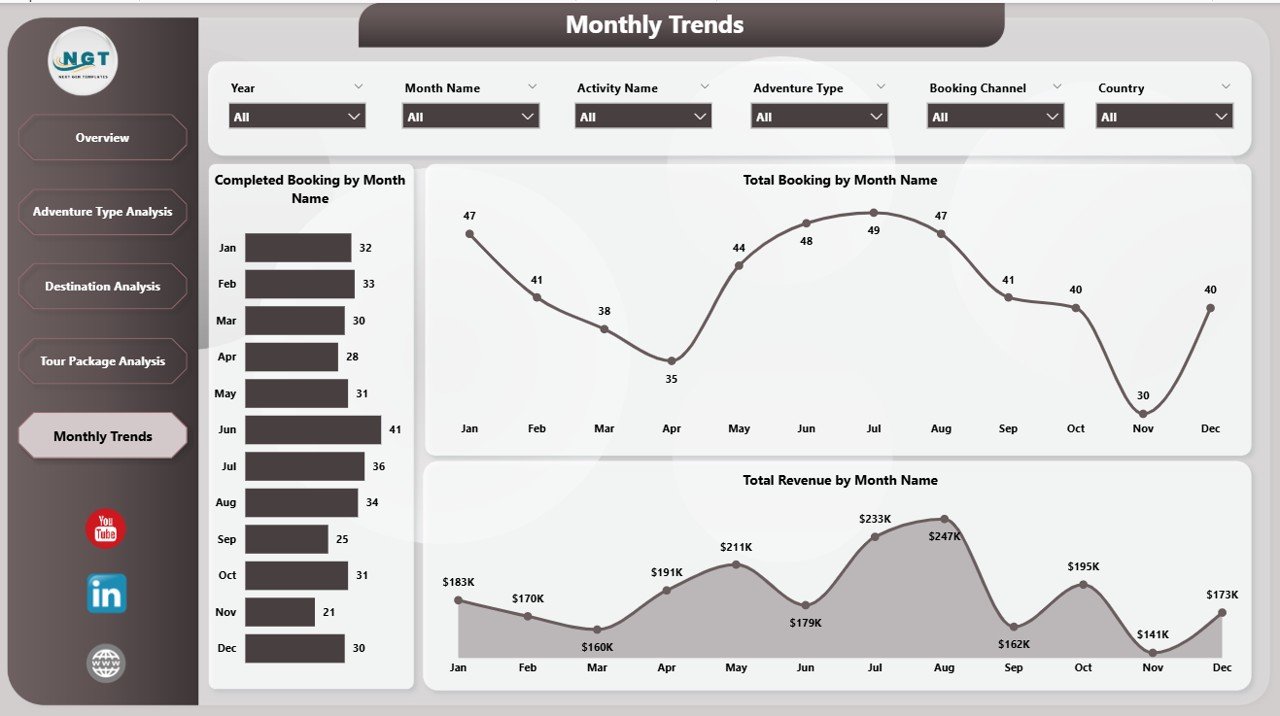
Tourism demand changes significantly throughout the year. Weather conditions, holidays, and seasonal travel trends strongly influence booking patterns.
The Month Analysis page helps organizations analyze monthly performance trends.
Charts Included
This page contains the following charts:
-
Completed Booking by Month
-
Total Booking by Month
-
Total Revenue by Month
Insights Provided
This page helps managers understand:
-
Peak travel seasons
-
Off-season booking patterns
-
Monthly revenue trends
Therefore, businesses can optimize marketing campaigns and staffing strategies.
Advantages of the Adventure Tourism Dashboard in Power BI
The Adventure Tourism Dashboard in Power BI offers numerous advantages for travel agencies and tourism operators.
1. Centralized Data Management
The dashboard consolidates data from multiple sources into a single analytical platform.
As a result, managers can access all tourism insights from one place.
2. Real-Time Insights
Power BI supports real-time data refresh. Therefore, organizations can monitor tourism performance instantly.
3. Improved Decision-Making
Because the dashboard presents clear visual insights, managers can make faster and more informed decisions.
4. Better Customer Experience
The dashboard tracks customer ratings and feedback. Consequently, tourism companies can identify service gaps and improve customer satisfaction.
5. Revenue Optimization
The dashboard highlights revenue performance across destinations, packages, and adventure types.
Therefore, businesses can focus on high-performing offerings.
6. Easy Data Visualization
Power BI transforms complex tourism data into simple charts and dashboards.
As a result, even non-technical users can understand insights easily.
Opportunities for Improvement in Adventure Tourism Analytics
Although dashboards provide powerful insights, organizations can further enhance their analytics capabilities.
1. Predictive Tourism Forecasting
Companies can use predictive analytics to forecast future tourism demand.
2. Customer Behavior Analysis
Advanced analytics can identify customer preferences and booking patterns.
3. AI-Powered Recommendations
Artificial intelligence can suggest personalized tour packages based on traveler interests.
4. Mobile Dashboard Access
Mobile-friendly dashboards allow managers to monitor tourism performance from anywhere.
5. Integration with Booking Platforms
Integration with travel booking systems improves data accuracy and automation.
Best Practices for the Adventure Tourism Dashboard
To maximize the value of the Adventure Tourism Dashboard in Power BI, organizations should follow certain best practices.
1. Maintain Clean Data
Ensure tourism data remains accurate and consistent.
2. Update Data Regularly
Frequent data updates improve the reliability of dashboard insights.
3. Use Clear KPIs
Select KPIs that truly reflect tourism performance.
4. Focus on User-Friendly Design
Use simple visuals and intuitive navigation.
5. Monitor Customer Feedback
Customer ratings provide valuable insights into service quality.
6. Track Seasonal Trends
Seasonal tourism patterns strongly impact revenue planning.
Who Can Benefit from the Adventure Tourism Dashboard?
The Adventure Tourism Dashboard in Power BI benefits multiple stakeholders in the tourism industry.
Travel Agencies
Travel agencies can analyze booking trends and customer preferences.
Tour Operators
Tour operators can evaluate tour package performance.
Tourism Boards
Government tourism boards can monitor regional tourism activity.
Hotel and Resort Managers
Accommodation providers can align their services with tourism demand.
Adventure Activity Providers
Activity providers such as trekking guides, rafting companies, and diving centers can monitor customer demand.
How Does Power BI Improve Tourism Data Analysis?
Power BI offers powerful analytical capabilities that transform tourism data into meaningful insights.
Key features include:
-
Interactive dashboards
-
Dynamic filters and slicers
-
Real-time data updates
-
Advanced data modeling
-
Integration with multiple data sources
Because of these features, Power BI has become one of the most popular business intelligence tools for tourism analytics.
Conclusion
Adventure tourism continues to grow rapidly across the world. As travelers seek exciting outdoor experiences, tourism companies must manage increasing amounts of operational data.
Without proper analytics, businesses struggle to monitor bookings, track revenue trends, and evaluate customer satisfaction.
The Adventure Tourism Dashboard in Power BI provides a powerful solution for this challenge. It transforms tourism data into interactive visual insights that help organizations monitor performance effectively.
Because the dashboard analyzes bookings, destinations, adventure types, tour packages, and seasonal trends, tourism managers gain a comprehensive understanding of their operations.
Therefore, organizations that adopt data-driven tourism analytics can improve decision-making, optimize revenue strategies, and deliver better travel experiences.
Frequently Asked Questions (FAQs)
What is an Adventure Tourism Dashboard in Power BI?
An Adventure Tourism Dashboard in Power BI is an interactive analytics tool that helps tourism companies monitor bookings, revenue, destinations, and customer ratings using visual reports.
Why should tourism companies use Power BI dashboards?
Power BI dashboards provide real-time insights, improve decision-making, and help businesses analyze tourism performance effectively.
What KPIs are included in the Adventure Tourism Dashboard?
Common KPIs include:
-
Customer Rating
-
Completed Booking %
-
Total Bookings
-
Total Revenue
-
Average Trip Duration
Can small tourism businesses use this dashboard?
Yes. Small travel agencies and tour operators can also use Power BI dashboards to analyze bookings and revenue trends.
How often should tourism dashboards be updated?
Ideally, tourism dashboards should refresh daily or weekly so that managers can monitor performance accurately.
Visit our YouTube channel to learn step-by-step video tutorials