The aerospace and defense industry operates in a high-risk, high-investment environment. Organizations manage billion-dollar contracts, complex supply chains, strict export controls, and performance-critical systems. Therefore, decision-makers must track financial performance, operational readiness, and program health in real time.However, traditional spreadsheets and static reports slow down analysis. As a result, executives struggle to see cost overruns, budget gaps, and performance risks quickly.So, how can aerospace and defense companies gain complete visibility?You need an Aerospace and Defense Dashboard in Power BI.This interactive dashboard centralizes revenue, cost, inventory, readiness, risk level, and performance metrics into one structured system. Moreover, it allows leadership teams to monitor KPIs instantly, compare actual vs budget, and identify trends across facilities and regions.
In this complete guide, you will learn:
- What an Aerospace and Defense Dashboard in Power BI is
- Why aerospace and defense organizations need it
- Detailed explanation of all 5 dashboard pages
- Key KPIs included in the dashboard
- Advantages of using this dashboard
- Best practices for implementation
- Frequently Asked Questions with answers
Click to buy Aerospace and Defense Dashboard in Power BI
What Is an Aerospace and Defense Dashboard in Power BI?
An Aerospace and Defense Dashboard in Power BI is an interactive business intelligence system designed specifically for aerospace manufacturers, defense contractors, and government suppliers.
It transforms complex operational and financial data into:
- Clear KPI cards
- Interactive charts
- Regional comparisons
- Program-level performance insights
- Monthly trend analysis
Instead of reviewing scattered Excel files, decision-makers can access all insights in one Power BI file.
Moreover, slicers allow users to filter data by:
- Facility
- Region
- Risk level
- Contract type
- Workstream
- Month
As a result, leaders can drill down into performance instantly.
Why Do Aerospace and Defense Organizations Need This Dashboard?
Aerospace and defense projects involve strict compliance, tight budgets, and performance deadlines. Therefore, organizations must monitor:
- Revenue vs budget
- Actual cost vs projected cost
- Inventory value
- Program reliability
- Operational readiness
- Risk exposure
However, manual reporting creates delays. In contrast, Power BI provides real-time visualization and faster decision-making.
Furthermore, government contracts demand transparency. Consequently, organizations must track cost allocation and performance metrics accurately.
This dashboard solves those challenges by offering structured and visual reporting.
Detailed Explanation of All 5 Pages
The Aerospace and Defense Dashboard in Power BI includes 5 powerful analytical pages. Each page focuses on a specific business area.
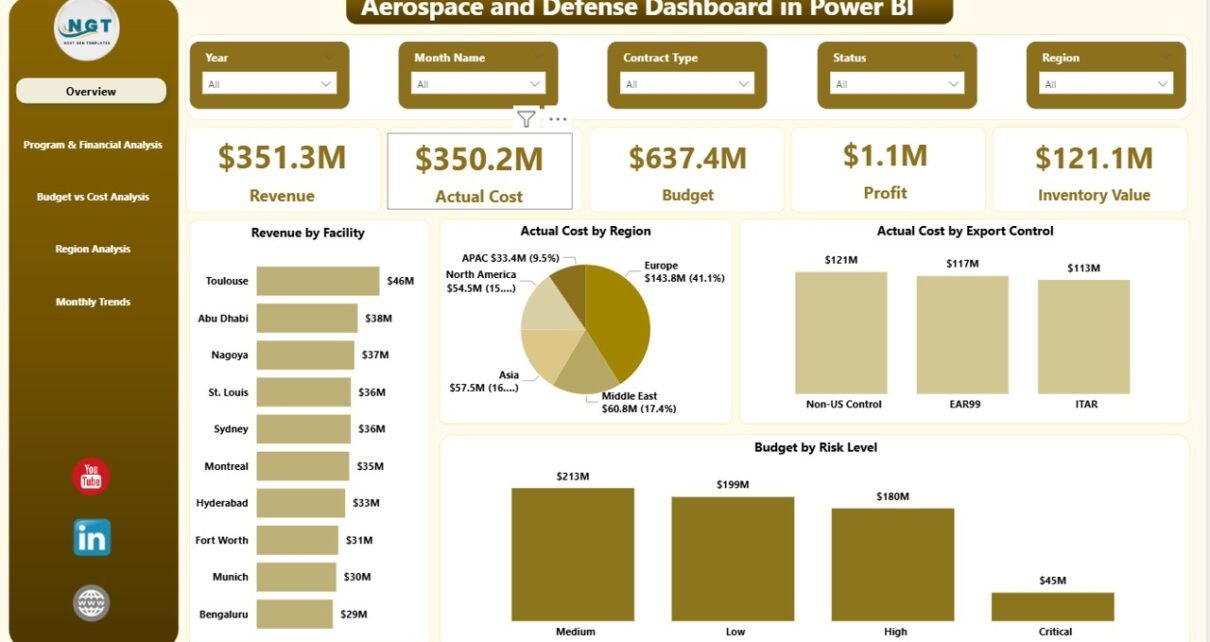
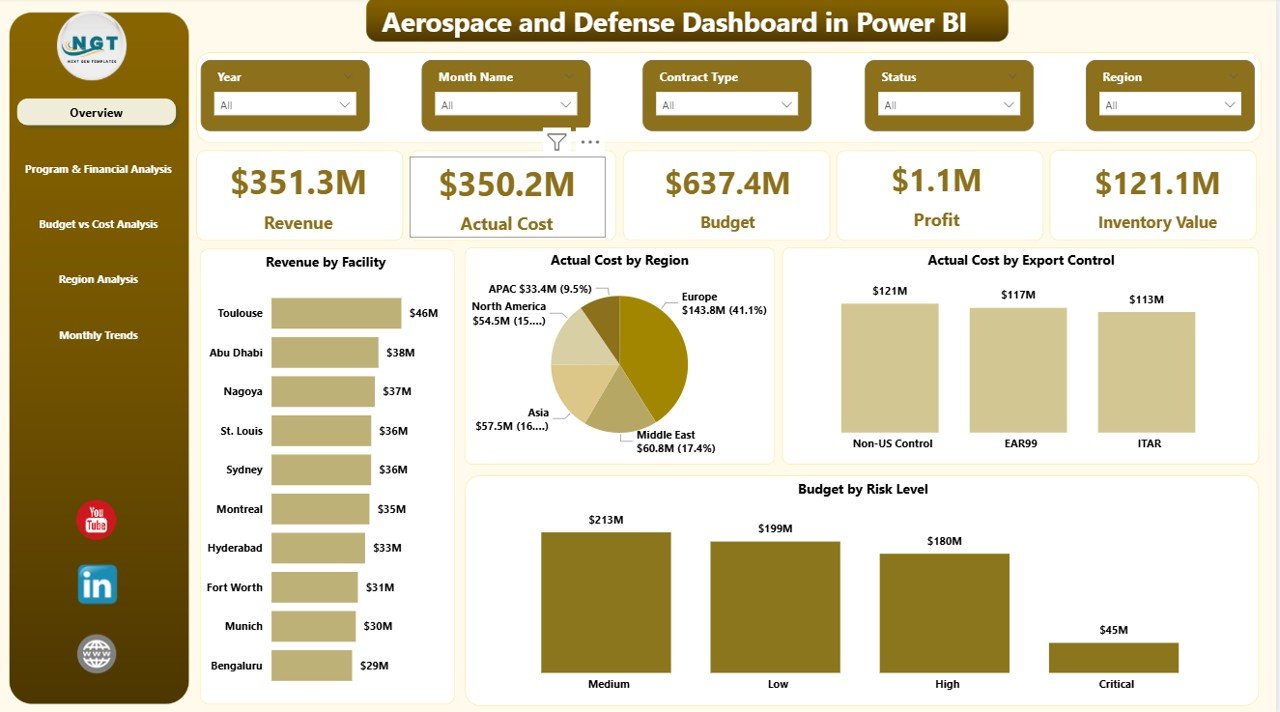
Overview Page – Executive Snapshot
The Overview Page serves as the main control center of the dashboard.
Here, executives can see high-level performance instantly.
KPI Cards Included:
- Revenue
- Actual Cost
- Budget
- Profit
- Inventory Value
These cards provide immediate financial clarity.
Charts on the Overview Page:
- Revenue by Facility
- Actual Cost by Region
- Actual Cost by Export Control
- Budget by Risk Level
Because slicers are available, users can filter results by region, facility, or risk category. Therefore, leadership teams can identify which facility generates maximum revenue and which region consumes higher costs.
Moreover, inventory value visibility helps supply chain managers maintain optimal stock levels.
Click to buy Aerospace and Defense Dashboard in Power BI
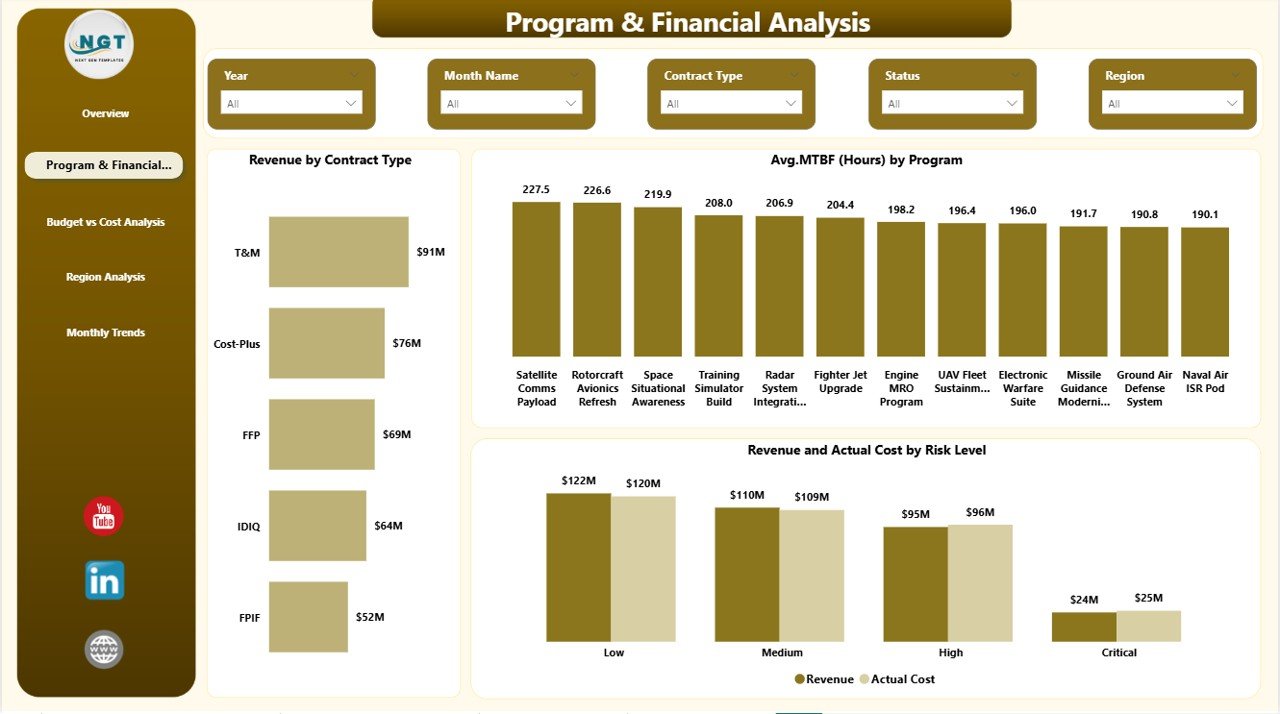
Program & Financial Analysis – Contract and Program Insights
This page focuses on program performance and contract analysis.
Aerospace organizations manage multiple programs simultaneously. Therefore, they must analyze program reliability and financial contribution carefully.
Charts Included:
- Revenue by Contract Type
- Average MTBF (Hours) by Program
- Revenue and Actual Cost by Risk Level
Why This Page Matters:
- Contract type analysis shows whether fixed-price or cost-plus contracts generate better margins.
- MTBF (Mean Time Between Failures) highlights equipment reliability.
- Risk-level revenue comparison reveals exposure areas.
Consequently, program managers can balance risk and profitability effectively.
Click to buy Aerospace and Defense Dashboard in Power BI
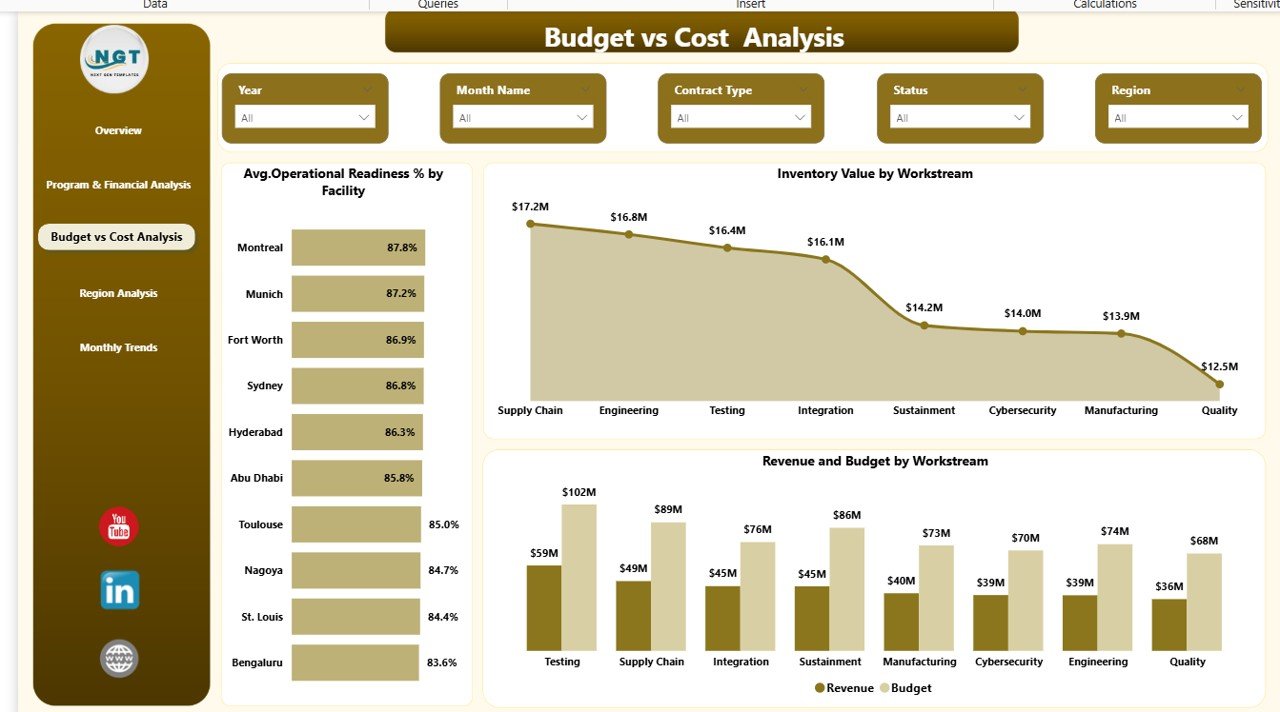
Budget vs Cost Analysis – Financial Control Center
Budget control plays a crucial role in aerospace and defense projects. Even small overruns can impact contract profitability.
This page focuses on cost control and readiness tracking.
Charts Included:
- Average Operational Readiness % by Facility
- Inventory Value by Workstream
- Revenue and Budget by Workstream
Key Insights:
- Operational readiness percentage reflects mission preparedness.
- Inventory by workstream shows capital allocation efficiency.
- Revenue vs budget comparison highlights financial gaps.
Because this page centralizes financial variance analysis, CFOs can quickly identify overspending areas.
Click to buy Aerospace and Defense Dashboard in Power BI
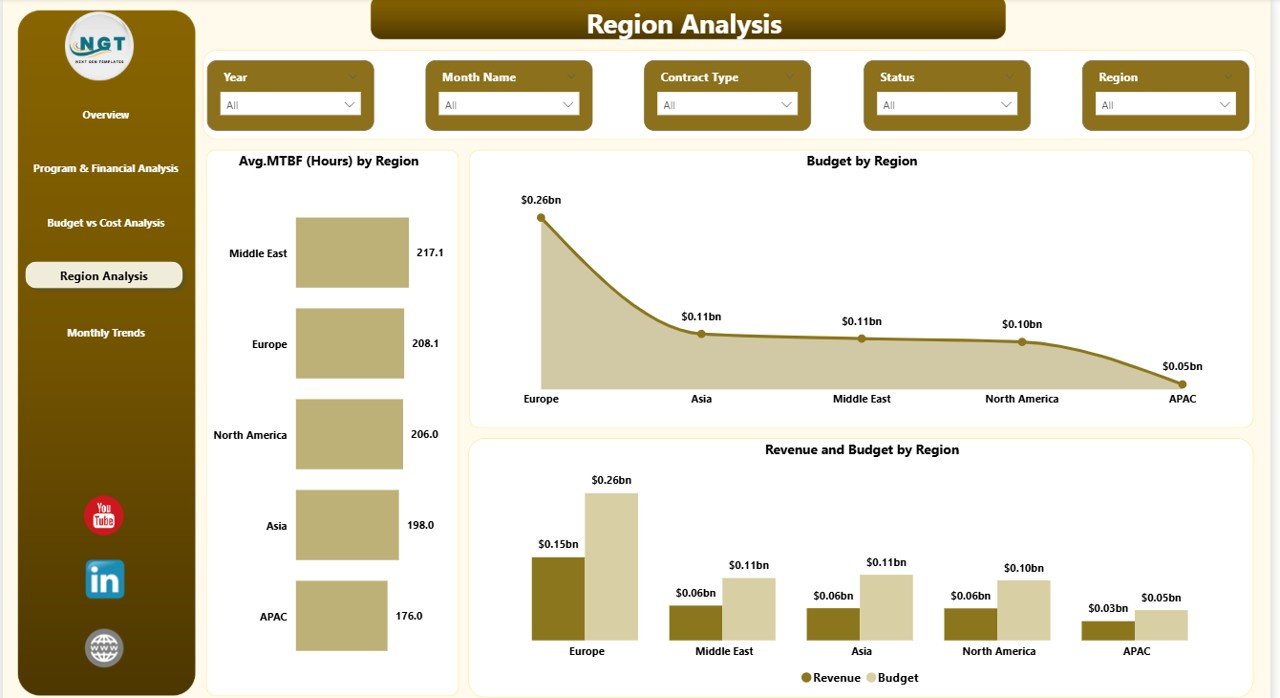
Region Analysis – Geographic Performance Monitoring
Aerospace and defense operations span multiple regions. Therefore, regional performance tracking becomes essential.
Charts Included:
- Average MTBF (Hours) by Region
- Budget by Region
- Revenue and Budget by Region
Strategic Benefits:
- Compare reliability performance across regions.
- Identify high-budget regions.
- Analyze revenue distribution geographically.
As a result, executives can allocate resources strategically.
Click to buy Aerospace and Defense Dashboard in Power BI
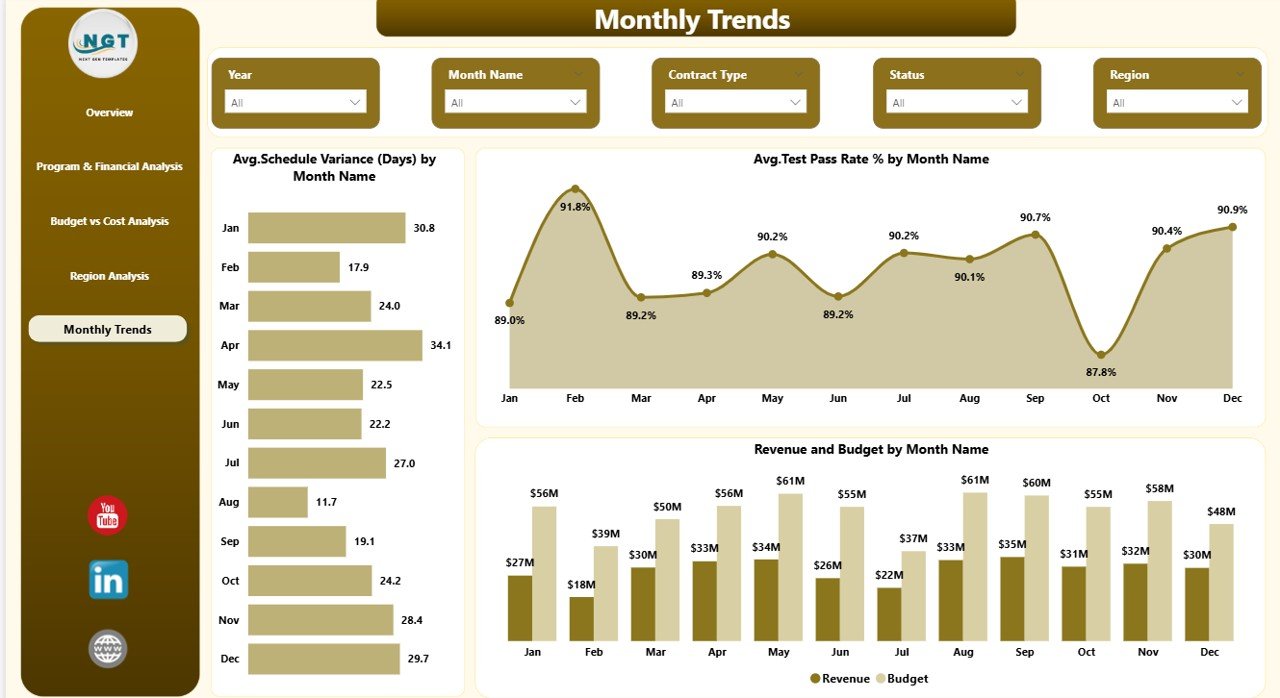
Monthly Trends – Time-Based Performance Tracking
Trend analysis drives long-term planning.
This page focuses on monthly performance tracking.
Charts Included:
- Average Schedule Variance (Days) by Month
- Average Test Pass Rate % by Month
- Revenue and Budget by Month
Why This Page Matters:
- Schedule variance highlights project delays.
- Test pass rate measures quality control.
- Monthly revenue vs budget comparison shows growth patterns.
Therefore, management teams can forecast future performance accurately.
Click to buy Aerospace and Defense Dashboard in Power BI
Key KPIs in the Aerospace and Defense Dashboard
This Power BI dashboard tracks critical aerospace and defense KPIs, including:
- Revenue
- Actual Cost
- Budget
- Profit
- Inventory Value
- Average MTBF (Hours)
- Operational Readiness %
- Schedule Variance (Days)
- Test Pass Rate %
- Risk Level Distribution
- Revenue by Contract Type
Each KPI supports performance monitoring and strategic planning.
How Does Power BI Improve Aerospace Decision-Making?
Power BI enhances aerospace analytics through:
- Interactive slicers
- Drill-down capabilities
- Real-time updates
- Dynamic visual comparisons
- Automated calculations
Moreover, Power BI integrates with ERP and financial systems. Therefore, organizations can pull live data instead of updating reports manually.
As a result, teams make faster and smarter decisions.
Advantages of Aerospace and Defense Dashboard in Power BI
Using this dashboard offers multiple benefits.
Centralized Data Visibility
You can view financial and operational metrics in one place. Therefore, you avoid scattered reports.
Improved Budget Control
You can compare revenue, actual cost, and budget instantly. Consequently, you prevent cost overruns.
Better Risk Management
You can monitor revenue and cost by risk level. Thus, you minimize financial exposure.
Enhanced Operational Readiness Tracking
You can track readiness percentage by facility. Therefore, you maintain mission preparedness.
Program Performance Monitoring
You can evaluate MTBF and reliability by program. Consequently, you improve equipment performance.
Stronger Regional Insights
You can compare revenue and budget by region. As a result, you allocate resources effectively.
Monthly Trend Visibility
You can analyze schedule variance and test pass rate trends. Therefore, you improve forecasting accuracy.
Best Practices for the Aerospace and Defense Dashboard in Power BI
To maximize results, follow these best practices.
Connect to Reliable Data Sources
Always connect Power BI to trusted ERP and finance systems. Clean data improves accuracy.
Update Data Regularly
Schedule automatic refresh. Therefore, you maintain real-time insights.
Define Clear KPI Ownership
Assign responsibility for each KPI. Consequently, teams stay accountable.
Monitor Risk Levels Consistently
Track high-risk contracts regularly. Therefore, you reduce financial impact.
Review Monthly Trends
Analyze monthly variance patterns. As a result, you improve forecasting.
Use Drill-Through Features
Encourage managers to drill into details. This approach enhances root cause analysis.
Maintain Export Control Compliance
Track cost allocation under export control guidelines carefully.
Who Can Use This Dashboard?
This Aerospace and Defense Dashboard in Power BI suits:
- Aerospace manufacturers
- Defense contractors
- Government suppliers
- Program managers
- Financial controllers
- Operations managers
- Compliance officers
How to Implement the Aerospace and Defense Dashboard in Power BI?
Follow these steps:
- Import financial and operational datasets into Power BI.
- Map KPIs correctly.
- Configure slicers for region, facility, and risk level.
- Validate calculations.
- Publish the dashboard to Power BI Service.
- Share access with stakeholders.
Because the dashboard uses structured visuals, teams can start using it immediately.
Conclusion
The aerospace and defense industry demands precision, accountability, and strategic control. Therefore, organizations must rely on structured analytics instead of manual reporting.
The Aerospace and Defense Dashboard in Power BI delivers real-time financial clarity, operational insight, and risk transparency in one powerful system.
Moreover, it improves budget control, program reliability, and regional performance tracking. As a result, leadership teams gain confidence in decision-making.
If you want complete visibility over aerospace and defense performance, this Power BI dashboard provides the perfect solution.
Frequently Asked Questions with Answers
- What is an Aerospace and Defense Dashboard in Power BI?
It is an interactive reporting system that tracks financial, operational, and program performance metrics in one Power BI file.
- Which KPIs does this dashboard track?
It tracks revenue, cost, budget, profit, MTBF, operational readiness, schedule variance, and test pass rate.
- Can I filter data by region and facility?
Yes. The dashboard includes slicers that allow filtering by region, facility, risk level, and month.
- How does this dashboard improve budget control?
It compares revenue, actual cost, and budget instantly. Therefore, managers can identify overspending quickly.
- Is this dashboard suitable for government contractors?
Yes. It supports compliance monitoring and financial transparency.
- Can Power BI integrate with ERP systems?
Yes. Power BI connects easily with ERP, finance, and operational databases.
- Does this dashboard support monthly trend analysis?
Yes. The Monthly Trends page tracks schedule variance, test pass rate, and financial performance by month.
Click to buy Aerospace and Defense Dashboard in Power BI
Visit our YouTube channel to learn step-by-step video tutorials
Watch the step-by-step video tutorial: